Four sliders, one detector and three bands of drawing, and the whole argument is the area of a sphere. This inverse square law simulator is a free interactive lab built to make that visible: set how much power the source radiates, how far the detector sits from its centre, what shape the source is, and how big it is compared with that gap. On arrival the four cards answer 7.958 W/m^2, 1.0000x, 1/4 exactly and 1.0000x.
The last of those is the one to watch, because it is the only card that asks about your tape measure rather than about the source. Push Source size, as R / s to its top rung and it reads 4.0000x while every other reading stays exactly where it was, and the card itself changes appearance. Only one rung of the eight escapes the one per cent line this lab tests against, and it escapes by being a true point source rather than by being close enough, which is why 1,792 of the 2,048 reachable states carry the warning and why not one reading here ever reports the opposite.
Inverse Square Law Simulator
One source, one detector, and the four surfaces the energy can spread over. Only a point source obeys I = P / (4 pi r^2); this simulation anchors all four laws to the same reading at one metre.
Load a Real Source
Each button writes the four sliders and nothing else; the simulation does every calculation itself, exactly as it would if you had dragged them. There is no mode to pick, no run button and no animation to wait for, so each press lands on a finished state immediately.
Press the first and then the second if you only press two. They are the same source and the same geometry, and the only thing that moves between them is one rung of the distance ladder.
Pick one of the five sources above, or drag the four sliders yourself.
What Is the Inverse Square Law Simulator?
The inverse square law simulator is a free interactive physics lab that runs in your browser, with nothing to install and no sign-up. One source and one detector are drawn three times over: as a sphere the energy has to cross, as four fall-off slopes on one shared logarithmic axis, and as a radius sitting beside a gap. The panel answers four things about the state you set and prints the sentence behind each of them.
Four ladders drive it and not one of them is a free-typed number. Source power P steps through eight rungs from one milliwatt to a hundred kilowatts, Distance r, from the centre through eight from 0.1 m to 100 m, Shape of the source through four surfaces, and Source size, as R / s through eight. That is 2,048 reachable states, which is why any reading quoted about this lab can be landed on exactly rather than approached.
Four cards carry the answer and each has a sentence under it. Intensity at the detector is the reading itself, and its sentence says whether the number is the law or a normalisation. Against the reading at 1 m is the ratio the whole subject turns on.
Doubling the distance leaves is an exact fraction and never a decimal. If you measured from the surface is the only card that is about your tape measure.
The lab opens on a 100 W point source one metre away, where those four read 7.958 W/m^2, 1.0000x, 1/4 exactly and 1.0000x. A compact grid under the drawing adds six more readings, which at that opening state are an exponent of 2, a sphere, area 4 pi r^2, 12.566 m^2 here, a halving distance of 1.414 m, a doubling distance of 70.711 cm, 2.821 m for where this source would read one watt per square metre, and 12.566 W for the power that would give one watt per square metre here.
Those last two rows are worth a second look, because the 12.566 W is the same number as the 12.566 m^2 of sphere above it. The power needed for one watt on every square metre simply is the area in square metres, which is the cheapest way to see that this law is a statement about geometry. Move one rung out to two metres and both become 50.265, while the reading falls to 1.989 W/m^2, exactly a quarter, on a sphere exactly four times the size.
If you measured from the surface is the card to watch, because its sentence is where this lab is honest. Walk the size slider from end to end on the opening state and sixteen of the nineteen readouts do not move at all: only that card changes, through 1.0000x, 1.0100x, 1.0201x, 1.1025x, 1.2100x, 1.4400x, 2.2500x and 4.0000x, and the card itself changes appearance on all but the first. Seven of those eight rungs are outside the one per cent line the lab tests against and the eighth is a true point source, so 1,792 of the 2,048 reachable states are in that condition and none of them ever reports being inside the line.
Shape of the source is the slider that makes the argument. The exponent is a property of the surface the energy crosses and not of the radiation, so the slider names a shape and the exponent row follows: a sphere of area four pi r squared gives 2 and 1/4 exactly, a cylinder around a long line source gives 1 and 1/2 exactly, a flat sheet gives 0 and 1x -- no change, and a radar echo that crosses the sphere twice gives 4 and 1/16 exactly. On the flat sheet the halving and doubling rows stop being numbers and read no distance halves it and no distance doubles it instead, from branches of their own rather than a division.
The three non-point rungs are a normalisation and the panel admits it rather than hiding it. At one metre all four shapes print the same 7.958 W/m^2, because they are deliberately anchored to the same reading there so that four slopes can be compared on one axis, and the sentence under the first card reads anchored to the same reading at 1 m on every one of them. Only the point-source rung is the law itself.
The drawing is three labelled bands. The top band is the source, the sphere the energy crosses and the detector, with the same number of radial lines drawn at the detector and again at twice that distance, so that their spacing rather than their count carries the law.
That top band’s gap is a fixed fraction of the canvas width rather than a length to scale, which is why a labelled bar states the scale and why no two states may be compared by eye there. The middle band is four straight fall-off lines on one shared logarithmic axis, twenty-one decades tall with a tick at every one, passing through the single point they share at one metre. The bottom band is the source radius against the gap, to scale and at its own scale, with both candidate origins marked.
| Control | Range | Step, default and what it moves |
|---|---|---|
| Source power P | 1 mW to 100 kW | a ladder of 8 fixed rungs - 1 and 10 and 100 mW, then 1, 10 and 100 W, then 1 kW and 100 kW - so the slider steps 1 index at a time and opens on rung 5, where the label reads "100.000 W". It scales the reading in exact proportion and decides nothing about how it falls off: at the bottom rung the first card reads 79.577 uW/m^2 and at the top 7.958 kW/m^2, while the ratio card stays on 1.0000x and the halving row on 1.414 m at both |
| Distance r, from the centre | 0.1 to 100 m | a ladder of 8 fixed rungs - 0.1, 0.25, 0.5, 1, 2, 5, 10 and 100 m - stepping 1 index at a time and opening on rung 3, where the label reads "1.000 m". It is measured from the CENTRE of the source and not from its surface, which is what the fourth slider exists to price. At 0.1 m the first card reads 795.775 W/m^2 over 100.0000x; at 100 m it reads 795.775 uW/m^2 over 0.0001x |
| Shape of the source | 4 surfaces | four rungs - point source, line source, plane source and radar echo - stepping 1 index at a time and opening on rung 0, where the label reads "point source" over the sub-line "exponent 2 -- the surface is a sphere, area 4 pi r^2". It sets the surface the energy spreads over and so the exponent, which runs 2, 1, 0 and 4, and the cost of doubling the distance, which runs 1/4 exactly, 1/2 exactly, 1x -- no change and 1/16 exactly. Only the first rung is the law itself; the other three are anchored to the same reading at 1 m |
| Source size, as R / s | 8 rungs | a ladder of 8 fixed rungs - a true point, then a radius of 0.005, 0.01, 0.05, 0.1, 0.2, 0.5 and 1 of the distance from the surface - stepping 1 index at a time and opening on rung 0, where the label reads "a true point source". The label prints a word at rung 0 and a ratio such as "source radius 0.1000 of the distance" after it, never a radius in metres, because that figure would be arithmetic across two ladders. It moves the fourth card and nothing else at all |
| Reset | one button | restores the opening state - 100 W, one metre, a point source and a true point size - and replays the settle, so the scene is drawn in rather than cut to. That state reads 7.958 W/m^2 for the intensity, 1.0000x against the reading at one metre, 1/4 exactly for doubling the distance and 1.0000x for the origin, and nothing is left animating once it has landed. There is no run button and no animation anywhere in this lab |
How to Use the Simulator
- Read the four cards before you touch anything. They are already answering for a 100 W point source one metre away: Intensity at the detector
7.958 W/m^2, Against the reading at 1 m1.0000x, Doubling the distance leaves1/4 exactlyand If you measured from the surface1.0000x. - Read the sentence under each card, because that is where the panel shows its hand. They read
P / (4 pi r^2) -- the surface the energy crosses is a sphere, area 4 pi r^2,the reading at this distance against the reading at 1 m,double the distance and a point source leaves 1/4 exactlyandno error: the source is a point, so r from the centre and r from the surface are the same. - Move Distance r, from the centre one rung right, from 1 m to 2 m. The first card falls to
1.989 W/m^2and the second to0.2500x. Watch the sphere row under the drawing while you do it: it goes from12.566 m^2 hereto50.265 m^2 here, which is four times for a reading that fell to a quarter. - Put the distance back and read the six grid rows. On the opening state they are
2for the exponent,a sphere, area 4 pi r^2, 12.566 m^2 here,1.414 mfor the halving,70.711 cmfor the doubling,2.821 mfor where it would read 1 W/m^2, and12.566 Wfor the power that would give 1 W/m^2 here. Those last two are not the same kind of number as each other. - Move Shape of the source one rung. The slider label turns to
line sourceoverexponent 1 -- the surface is a cylinder, area 2 pi r L, the cost card turns to1/2 exactly, the surface row toa cylinder, area 2 pi r L, growing as r^1, and the halving distance stretches from1.414 mto2.000 m. - Push it one further, to the flat sheet. The cost card reads
1x -- no change, and the three distance rows stop being numbers at all:no distance halves it,no distance doubles itandevery distance reads the same. They are sentences from branches of their own, never a division. - Push it to the top rung, the radar echo. The exponent row reads
4, the cost card1/16 exactly— not an eighth — and the surface rowa sphere twice over, out and back, growing as r^2, because the echo pays for the sphere on the way out and again on the way back. - Notice what did not change while you did all that. At one metre the first card reads
7.958 W/m^2on every one of the four shapes. That is the anchoring, and the sentence under the card admits it: on the three non-point rungs it beginsanchored to the same reading at 1 minstead of quoting the law. - Now walk Source size, as R / s from end to end. The label goes from
a true point sourcetosource radius 1.0000 of the distance, the fourth card from1.0000xto4.0000x, and nothing else on the panel moves at all. The bottom band redraws, because that card is the only reading in the lab that depends on this slider. - Finally push Source power P to each end. At its bottom rung the first card reads
79.577 uW/m^2and at its top7.958 kW/m^2, while the ratio card sits at1.0000xand the halving row at1.414 mthroughout. Power scales the reading and decides nothing about how it falls off. - Press Reset when you have finished. It puts the four sliders back to
100.000 W,1.000 m,point sourceanda true point source, and replays the opening settle so the scene is drawn in rather than cut to.
Dragging is the right way to find out which readings move together and a poor way to land on a particular state, because all four controls step by whole rungs. The five preset buttons above exist for that reason, and the written inverse square law guide is where the argument is made from scratch and the problems are worked with every step shown.
One thing this panel cannot do is take a power, a distance or a source size that is not on a rung, and it cannot run the relation backwards at all. The inverse square law calculator takes typed figures and solves in four directions, including the one question this lab never asks: at what distance has a known reading fallen to a target.
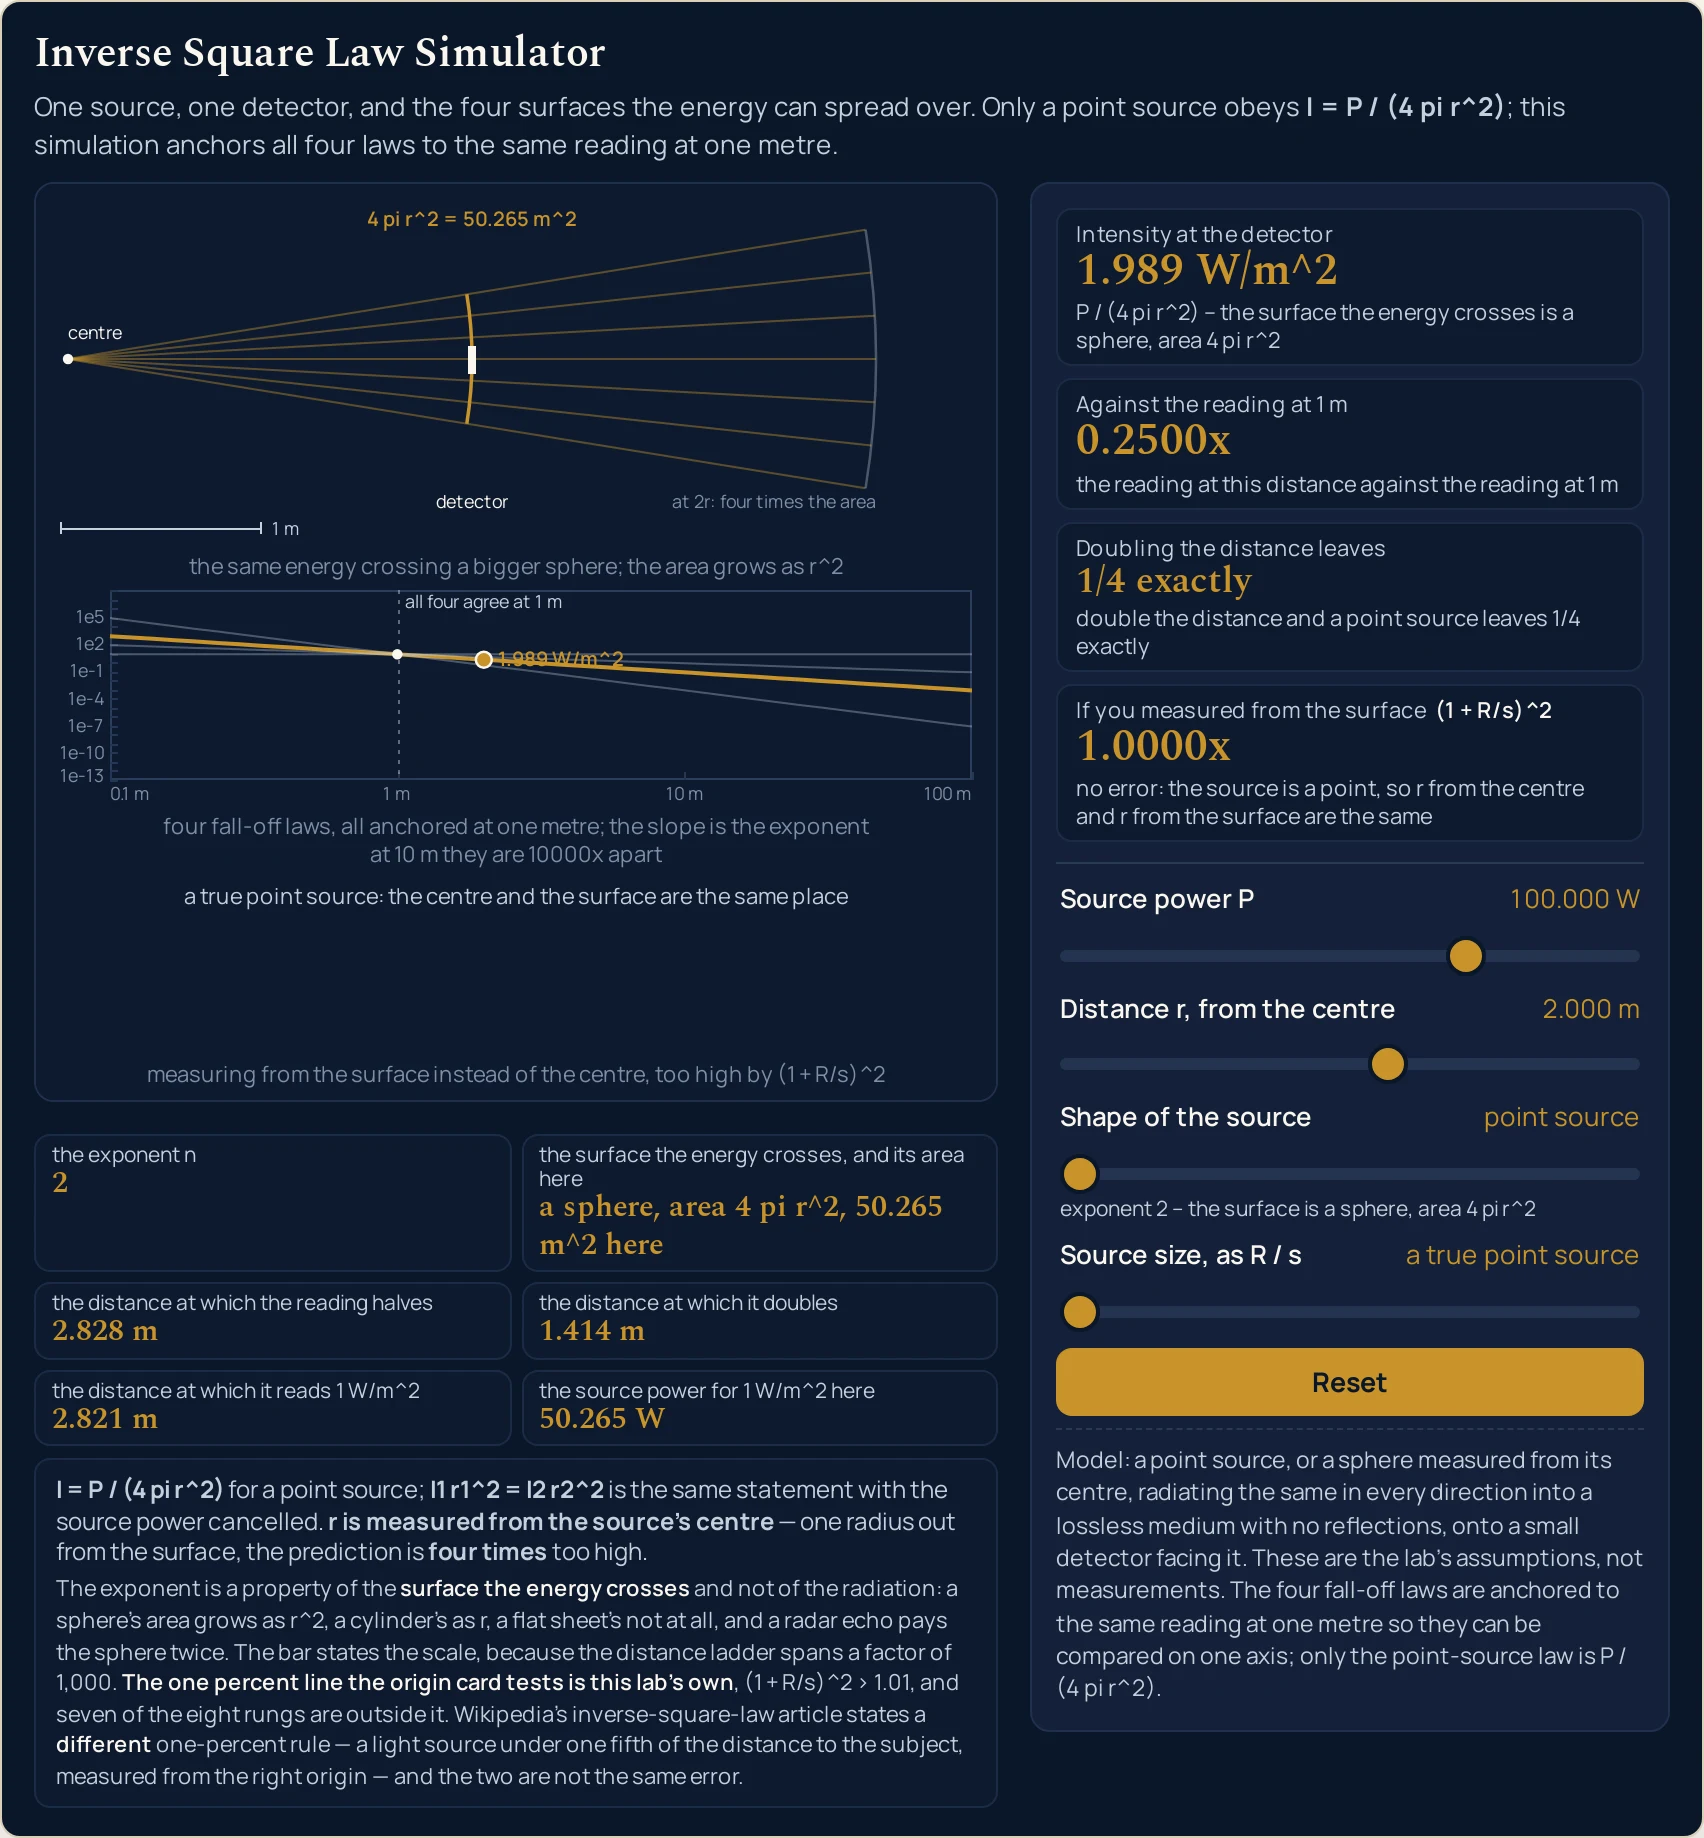
1.989 W/m^2 at 0.2500x while the sphere under it has grown to 50.265 m^2 — a quarter of the reading on four times the area. The band text is what the drawing paints at this page’s own width; it shortens on a narrow column, band by band.Worked Example: One Metre, Then Two
Nothing in the tables below was worked out here. Each column is a state the lab was put into through its own sliders and then read back from, cell by cell, so every string in them is the panel’s own. The first table is the pair this section is named after.
One: one source, one geometry, and one rung of the distance ladder
Press A 100 W point source one metre away and then Twice as far: exactly a quarter. Only the distance slider moves between them, so the four control rows are the same except one. This table is transposed, because the comparison worth making runs down a column.
| Panel reading | One metre | Two metres |
|---|---|---|
| Source power P | 100.000 W | 100.000 W |
| Distance r, from the centre | 1.000 m | 2.000 m |
| Shape of the source | point source | point source |
| what the shape slider adds | exponent 2 -- the surface is a sphere, area 4 pi r^2 | exponent 2 -- the surface is a sphere, area 4 pi r^2 |
| Source size, as R / s | a true point source | a true point source |
| Intensity at the detector | 7.958 W/m^2 | 1.989 W/m^2 |
| what that card is made of | P / (4 pi r^2) -- the surface the energy crosses is a sphere, area 4 pi r^2 | P / (4 pi r^2) -- the surface the energy crosses is a sphere, area 4 pi r^2 |
| Against the reading at 1 m | 1.0000x | 0.2500x |
| what the ratio is against | the reading at this distance against the reading at 1 m | the reading at this distance against the reading at 1 m |
| Doubling the distance leaves | 1/4 exactly | 1/4 exactly |
| the exact cost | double the distance and a point source leaves 1/4 exactly | double the distance and a point source leaves 1/4 exactly |
| If you measured from the surface | 1.0000x | 1.0000x |
| the origin verdict | no error: the source is a point, so r from the centre and r from the surface are the same | no error: the source is a point, so r from the centre and r from the surface are the same |
| the exponent n | 2 | 2 |
| the surface the energy crosses, and its area here | a sphere, area 4 pi r^2, 12.566 m^2 here | a sphere, area 4 pi r^2, 50.265 m^2 here |
| the distance at which the reading halves | 1.414 m | 2.828 m |
| the distance at which it doubles | 70.711 cm | 1.414 m |
| the distance at which it reads 1 W/m^2 | 2.821 m | 2.821 m |
| the source power for 1 W/m^2 here | 12.566 W | 50.265 W |
The sphere row is half the lesson and leaving it out would hide the reason. The reading falls from 7.958 W/m^2 to 1.989 W/m^2, which is exactly a quarter, and the surface the energy crosses goes from 12.566 m^2 here to 50.265 m^2 here, which is exactly four times. The same power, four times the area, a quarter of the reading: that is the whole law in two rows of one table.
Two rows refuse to move, and they are the interesting ones. Doubling the distance leaves reads 1/4 exactly in both columns, because it is a property of the geometry rather than of where you are standing. So does the distance at which it reads 1 W/m^2, at 2.821 m in both: that is a fact about the source, and walking towards it or away from it cannot change it.
The last row is the cheapest check in the whole lab. At one metre the power needed for 1 W/m^2 reads 12.566 W and the sphere area three rows above it reads 12.566 m^2; at two metres they are 50.265 W and 50.265 m^2. They agree because the power for one watt per square metre is the area in square metres, which is the law stated as a fact about geometry. The unit of that area is where the SI units guide starts, and the watt itself belongs to the power guide.
Two: the five sources the buttons load
These are the presets with the readings they produce. Read the last three columns across: two of the five change the cost of doubling the distance, and exactly one of the five has anything wrong with its origin.
| Preset | Source power | Distance | Shape of the source | Source size | Intensity at the detector | Against the reading at 1 m | Doubling the distance leaves | If you measured from the surface |
|---|---|---|---|---|---|---|---|---|
| A 100 W point source one metre away | 100.000 W | 1.000 m | point source | a true point source | 7.958 W/m^2 | 1.0000x | 1/4 exactly | 1.0000x |
| Twice as far: exactly a quarter | 100.000 W | 2.000 m | point source | a true point source | 1.989 W/m^2 | 0.2500x | 1/4 exactly | 1.0000x |
| A long line source: 1/r, not 1/r squared | 100.000 W | 2.000 m | line source | a true point source | 3.979 W/m^2 | 0.5000x | 1/2 exactly | 1.0000x |
| A radar echo: out and back, 1/r to the fourth | 1.000 kW | 10.000 m | radar echo | a true point source | 7.958 mW/m^2 | 0.0001x | 1/16 exactly | 1.0000x |
| Measured from the surface, not the centre | 100.000 W | 1.000 m | point source | source radius 1.0000 of the distance | 7.958 W/m^2 | 1.0000x | 1/4 exactly | 4.0000x |
Rows two and three differ by one slider and tell the whole exponent story. Same 100 W, same 2 m, and only the shape changed: the point source reads 1.989 W/m^2 and the line source 3.979 W/m^2, which is exactly twice. The cost card goes with it, from 1/4 exactly to 1/2 exactly, and the halving distance from 2.828 m to 4.000 m.
Row four is the one worth loading on its own. A kilowatt at ten metres on the fourth-power rung reads 7.958 mW/m^2 at 0.0001x of the one-metre reading, and the cost card says 1/16 exactly. Sixteen rather than eight, because the echo crosses the sphere twice: that doubles the exponent, which squares the ratio.
Row five is the honest one, and it is the anchor in disguise. Its power, its distance and its shape are row one’s, and its intensity, ratio and cost cards print row one’s strings character for character. Only the last column moved, to 4.0000x. The geometry did not change; the question did.
Formula and Symbol Reference
The band at the head of this page carries the law with the ratio form beside it, because the first on its own needs a source power and the second does not. Every reading on the panel is one of those two forms, a distance that follows from them, or a ratio between two states.
The symbol column below uses the panel’s own names, spelled the way the lab’s own strip spells them in plain ASCII, with pi and rho written out rather than drawn. For which letter belongs to which quantity, the physics symbols guide keeps the list, and the physics formula sheet is the one-page reference this relation sits on.
| Symbol or readout | Meaning | SI unit | In this lab |
|---|---|---|---|
| I | The intensity at the detector: how much power is crossing each square metre of a surface facing the source. It is what the lab answers, and it is a reading rather than something you set | watt per square metre | the first card, to three decimals in the largest unit that keeps the number at or above one, so it carries pW/m^2 through uW/m^2, mW/m^2, W/m^2 and kW/m^2 up to MW/m^2, and the unit changes under you as you slide. The opening state reads 7.958 W/m^2; across the whole grid the smallest reachable reading is 0.796 pW/m^2 and the largest 79.577 MW/m^2, which is exactly twenty decades and the reason the middle band is drawn twenty-one wide. |
| P | The total power the source radiates, counted over the whole sphere rather than in one direction. It scales the reading in exact proportion and changes nothing else on the panel | watt (W) | a ladder of eight rungs, one milliwatt to a hundred kilowatts, opening on 100.000 W. The slider steps one index at a time, so no intermediate power exists. At the bottom rung the first card reads 79.577 uW/m^2 and at the top 7.958 kW/m^2, while 1.0000x and 12.566 W do not move at either end, with everything else held at the default. |
| r | The distance from the centre of the source to the detector. Measure it from the surface, or from the front of a housing, and every intensity figure on the panel comes out too high — which is the single most likely reader error in this subject | metre (m) | a ladder of eight rungs, 0.1 m to 100 m, opening on 1.000 m. At the bottom rung the first card reads 795.775 W/m^2 over 100.0000x and at the top 795.775 uW/m^2 over 0.0001x. The grid’s halving row tracks it exactly: 14.142 cm at 0.1 m, 1.414 m at 1 m, 141.421 m at 100 m. |
| 4 pi r^2 | The area of the sphere the energy is crossing at that distance. The exponent is this and nothing else: double the distance and this area is four times, so the same power is spread four times thinner | square metre | the second grid row, which prints the surface and its area together. a sphere, area 4 pi r^2, 12.566 m^2 here at one metre and 50.265 m^2 here at two. Only the point-source rung prints an area at all; the other three print how their own surface grows, as growing as r^1, growing as r^0 or growing as r^2. |
| n | The fall-off exponent, which is a consequence of the spreading surface rather than a setting of its own. That is why the slider above it names a shape and not a number | dimensionless | the first grid row, and the shape slider is what moves it. Four rungs: 2 for a point source, 1 for a line source, 0 for a plane source and 4 for a radar echo, with the sub-line under the slider spelling out why, as in exponent 2 -- the surface is a sphere, area 4 pi r^2. The cost card follows it exactly, through four strings and no others. |
| R / s | How big the source is compared with the gap from its own surface to the detector: its radius divided by that gap. It is the only control on the panel that is about your tape measure rather than about the physics | dimensionless ratio | a ladder of eight rungs, opening on a true point source and running through source radius 0.0050 of the distance up to source radius 1.0000 of the distance. The label prints a word at the first rung and a ratio after it, and never a radius in metres, because that figure would be arithmetic across two ladders. |
| (1 + R/s)^2 | The factor by which a prediction is too high when the distance was taken from the source’s surface instead of its centre. It is exact, for every power, every distance and every exponent | dimensionless ratio | the fourth card, to four decimals with an x after it. It reads 1.0000x only at a true point source and then climbs rung by rung: 1.0100x, 1.0201x, 1.1025x, 1.2100x, 1.4400x, 2.2500x and 4.0000x. The card changes appearance on all seven of those, and 1,792 of the 2,048 states the sliders reach are in that condition. |
| the halving and doubling distances | Where this reading would fall to half and climb to double, holding the power and the geometry still. On a point source they are the distance multiplied and divided by the square root of two | metre (m) | the third and fourth grid rows, to three decimals in kilometres, metres, centimetres, millimetres or micrometres. 1.414 m and 70.711 cm on the opening state; 4.000 m and 1.000 m on the line-source preset; 11.892 m and 8.409 m on the radar one. On the plane-source rung both become sentences: no distance halves it and no distance doubles it. |
| the distance at which it reads 1 W/m^2 | Where this source would put exactly one watt on each square metre. It is a property of the source rather than of where you happen to be standing, so moving the distance slider does not move it | metre (m) | the fifth grid row. It reads 2.821 m at both one metre and two metres on the same 100 W point source, which is the point of it; the power slider is what moves it, from 8.921 mm at one milliwatt to 89.206 m at a hundred kilowatts. On the plane-source rung it becomes every distance reads the same. |
| the source power for 1 W/m^2 here | What the row prints is 4 pi r^2 at the distance on screen, which is the power this source would need to radiate to put one watt on each square metre on the point-source law. At one metre it is that power on all four shapes, because one metre is where the four laws are pinned, and there it is numerically the sphere area — the cheapest way to see that the law is a statement about area | watt (W) | the sixth grid row, to three decimals, and it takes no exponent: it is 4 pi r^2 whatever the shape slider says. 12.566 W at one metre, which is the same number as the 12.566 m^2 two rows above it; 50.265 W at two metres, matching that state’s own sphere area; 1.257 kW on the radar preset, where it is the point-source figure for ten metres and not the fourth-power one. At the ends of the distance ladder it runs 125.664 mW to 125.664 kW. |
| I1 r1^2 = I2 r2^2 | The ratio form, in which the source power cancels completely. It is on the band at the head of this page because it is the form a reader can use with a meter and a tape measure and nothing else | not a control | not on the panel at all. This lab goes forwards only: you set a power, a distance, a shape and a size, and it reports what follows. Comparing two readings at two distances, or running the relation backwards to a distance, is the companion calculator’s job and it has four solve modes for it. |
If you read one row twice, make it the third. Every intensity the panel prints is quoted at a distance counted from the centre of the source, which is not what a tape measure does when the source has a size. The fourth card exists to price that difference, and the row below it is the only place a radius enters the lab at all.
Reading the Diagram: a Growing Sphere, Four Slopes and Two Origins
The drawing is laid out as three bands: the top band carries the sphere, the middle band carries the four laws, and the bottom band carries the two candidate origins. On the largest source-size rung the bottom band draws the source as a disc wide enough to reach up across the middle band, and it is painted after that band rather than under it. The five lowest decade labels, the 0.1 m and 1 m distance ticks and the left part of that band’s own caption lose most of their contrast to it; the bottom band’s caption stays on top, and every reading is in the cards rather than off that axis.
| Part of the drawing | What it paints | What it does not claim |
|---|---|---|
| the sphere band | The top band. The source at the left, the detector at the set distance, and the sphere the energy crosses drawn as an arc through the detector with its area leading on 4 pi r^2 = 12.566 m^2. The same number of radial lines is drawn at the detector and again at twice that distance, so their spacing carries the law rather than their count, and a note beside them reads at 2r: four times the area. Both candidate origins are marked, centre and surface, and a labelled scale bar states the scale |
it is not a distance-to-scale drawing. The gap between the source and the detector is a fixed fraction of the canvas width, so the metres per pixel change as the distance slider moves and no two states may be compared by eye in this band at all. The bar is what states the scale — it read 0.5 m on the harvested state — and the distance ladder spans 0.1 m to 100 m, a factor of a thousand. It also claims nothing about a quarter: at twice the distance the area is four times and it is the intensity that is a quarter |
| the four-laws band | The middle band. The reading against the distance on logarithmic axes, with all four fall-off laws drawn as straight lines through the single point they share at one metre, the current state marked on its own line, the other three faint, and all four agree at 1 m written beside that point. The distance axis labels all four of its decades, 0.1 m, 1 m, 10 m and 100 m, at every width tested |
it does not put the four laws on four scales. One shared axis is the only honest way to draw them, and only the point-source line is P / (4 pi r^2): the other three are anchored to the same reading at one metre, and the intensity card says so in words whenever the shape is not a point. The vertical axis spans twenty-one decades with a tick at every one, and none of the 256 power, distance and shape readings is clamped at either end |
| the origin band | The bottom band. The source’s own radius drawn against the gap from its surface to the detector, with both candidate measurements marked — s from the surface and r = s + R from the centre — and the error factor written beside them as, for instance, 4.0000x too high. At a true point source the band says so in words instead of drawing a circle of no radius |
it is not at the top band’s scale. This one is to scale — the drawn radius over the drawn gap is exactly the ratio the slider is set to — but it is at its own scale, so nothing horizontal here means anything up there. It also offers no correction to apply: it shows the size of the error and the panel prints the factor, and adding the radius back before you measure is the whole fix. On the largest size rung the disc it draws for the source is wide enough to reach up across the band above it, and it is painted after that band rather than under it, so the middle band’s five lowest decade labels, its 0.1 m and 1 m distance ticks and the left part of its caption lose most of their contrast to it. That is a drawing overlap and not a second quantity; this band’s own caption is drawn after the disc and stays on top, and the figures are in the cards and the grid rather than off that axis |
| what the picture is for | Seeing the shape of the result. A sphere growing while the same lines spread apart, four straight lines fanning out from one shared point, and a radius sitting next to a gap are the three arguments of this lab drawn rather than stated | it is not evidence. The drawing is made from the numbers the four sliders set, so it shows the shape of the model rather than discovering anything, and the panel prints every figure in it so the picture can be checked rather than trusted. Where a real measurement departs from the model is set out below, and almost none of it is visible in the picture at all |
The line count in the top band is held fixed on purpose, and the spacing is what carries the law. The same number of radial lines leaves the source at the detector’s distance and again at twice it, so nothing is lost between the two: what changes is how far apart they are where they cross. Count them and the picture says conservation; measure their spacing and it says fall-off. Drawing more lines further out would have said neither.
All four lines in the middle band pass through one point, and that point is a construction rather than a coincidence. The anchored reading at one metre is byte-identical for all four exponents, which is why the band can carry them on one shared axis and why the label beside that point reads all four agree at 1 m. Only the point-source line is the law; the other three are the same reading given a different slope.
At ten metres the fastest and slowest of those four are 10000x apart, which is what the band’s second caption line states. That is a property of the four exponents rather than a claim about any one engine’s arithmetic: raising ten to the power of minus four lands one bit out in one of the two browsers this lab was compared in, no readout anywhere moves because of it, and the ratio card prints 0.0001x in both. Safari was never exercised at all.
The bottom band’s label is the whole of the fourth slider in one expression. Call the source’s radius R and the gap from its surface to the detector s; then the distance the law actually wants is s + R, and using s instead inflates the prediction by the square of their ratio, which is (1 + R/s)^2. One radius out from the surface that is a factor of four, and the band draws the radius against the gap so the size of the mistake is visible rather than merely stated.
The decade ladders stop rather than skip. The vertical axis labels every third decade, seven labels, at most of the canvas widths tested; at a 380 pixel canvas the stride widens to seven and four labels remain; at a 320 pixel one only the bottom label survives. The distance axis keeps all four of its decades everywhere. Every labelled run is a prefix of the stride grid starting at the first tick, so a reader never sees a gap in the middle of a ladder.
The Physics: Why Squared, and When It Is Not
Leave the panel on its opening state and ask what the sphere in the top band is for. Whatever the source radiates has to cross that sphere, all of it, and the area of a sphere grows as the square of its radius. Divide a fixed power by an area that quadruples and the reading quarters, which is the first two grid rows and the first card in one sentence.
That is also why the exponent is sometimes not two, and the shape slider is the proof. The exponent is a property of the surface the energy crosses and not of the radiation: change the surface and the exponent changes with it, while nothing about the source has moved. The ladder below is that sentence driven through the panel, one row per rung.
| Shape of the source | Spreading surface | Exponent | Doubling the distance leaves | Against the reading at 1 m | The distance at which the reading halves |
|---|---|---|---|---|---|
| point source | a sphere, area 4 pi r^2 | 2 | 1/4 exactly | 0.2500x | 2.828 m |
| line source | a cylinder, area 2 pi r L | 1 | 1/2 exactly | 0.5000x | 4.000 m |
| plane source | a flat sheet, area fixed | 0 | 1x -- no change | 1.0000x | no distance halves it |
| radar echo | a sphere twice over, out and back | 4 | 1/16 exactly | 0.0625x | 2.378 m |
Read the second column and the fourth together and the table becomes one idea. A sphere’s area grows as the square of the distance and the cost of doubling is a quarter; a cylinder’s grows as the distance itself and the cost is a half; a flat sheet’s does not grow and there is no cost at all. The echo pays the sphere twice and the cost is a sixteenth, which is the quarter squared rather than halved.
Those four strings are the only four the cost card has. Across all 2,048 states the four sliders can reach it prints 1/4 exactly, 1/2 exactly, 1x -- no change or 1/16 exactly and nothing else, because the cost is exactly two to the power of minus the exponent. A card that printed a decimal there would have hidden that.
The three non-point rungs need their honest caveat, and the panel gives it rather than hiding it. A line source’s intensity really wants a power per unit length and a flat sheet’s a power per unit area, so four absolute scales on one slider would have been four different quantities pretending to be one. Instead all four are pinned to the same reading at one metre, and the first card’s sentence says anchored to the same reading at 1 m whenever the shape is not a point.
| Shape of the source | Exponent | Intensity at the detector | The surface the energy crosses | What the sentence under the card says |
|---|---|---|---|---|
| point source | 2 | 7.958 W/m^2 | a sphere, area 4 pi r^2, 12.566 m^2 here | P / (4 pi r^2) -- the surface the energy crosses is a sphere, area 4 pi r^2 |
| line source | 1 | 7.958 W/m^2 | a cylinder, area 2 pi r L, growing as r^1 | anchored to the same reading at 1 m; the slope is set by a cylinder, area 2 pi r L |
| plane source | 0 | 7.958 W/m^2 | a flat sheet, area fixed, growing as r^0 | anchored to the same reading at 1 m; the slope is set by a flat sheet, area fixed |
| radar echo | 4 | 7.958 W/m^2 | a sphere twice over, out and back, growing as r^2 | anchored to the same reading at 1 m; the slope is set by a sphere twice over, out and back |
Three columns move and one does not. The exponent, the surface and the sentence all change down the four rows; the intensity is the same string in every one, because one metre is where they were pinned together. Note also that only the first row prints an area: the other three print how their surface grows, so no row ever claims a sphere’s area for a cylinder.
Two famous laws wear this exponent for exactly this reason and neither has a slider on this panel. The gravitational force law wants a pair of masses and a constant, and the electrostatic force law wants a pair of charges and a different one. Each is an instance with its own page and its own tools, and naming them is as far as this lab goes.
One clause on sound, and then it stops. The cleared source records that a sound source’s pressure falls off as 1/r while the intensity, which is that pressure multiplied by the particle velocity, keeps the square — one source, one distance, and the exponent depending on which quantity was asked for. Turning either into a level is the decibel formula guide’s job, and there is no logarithm anywhere on this panel.
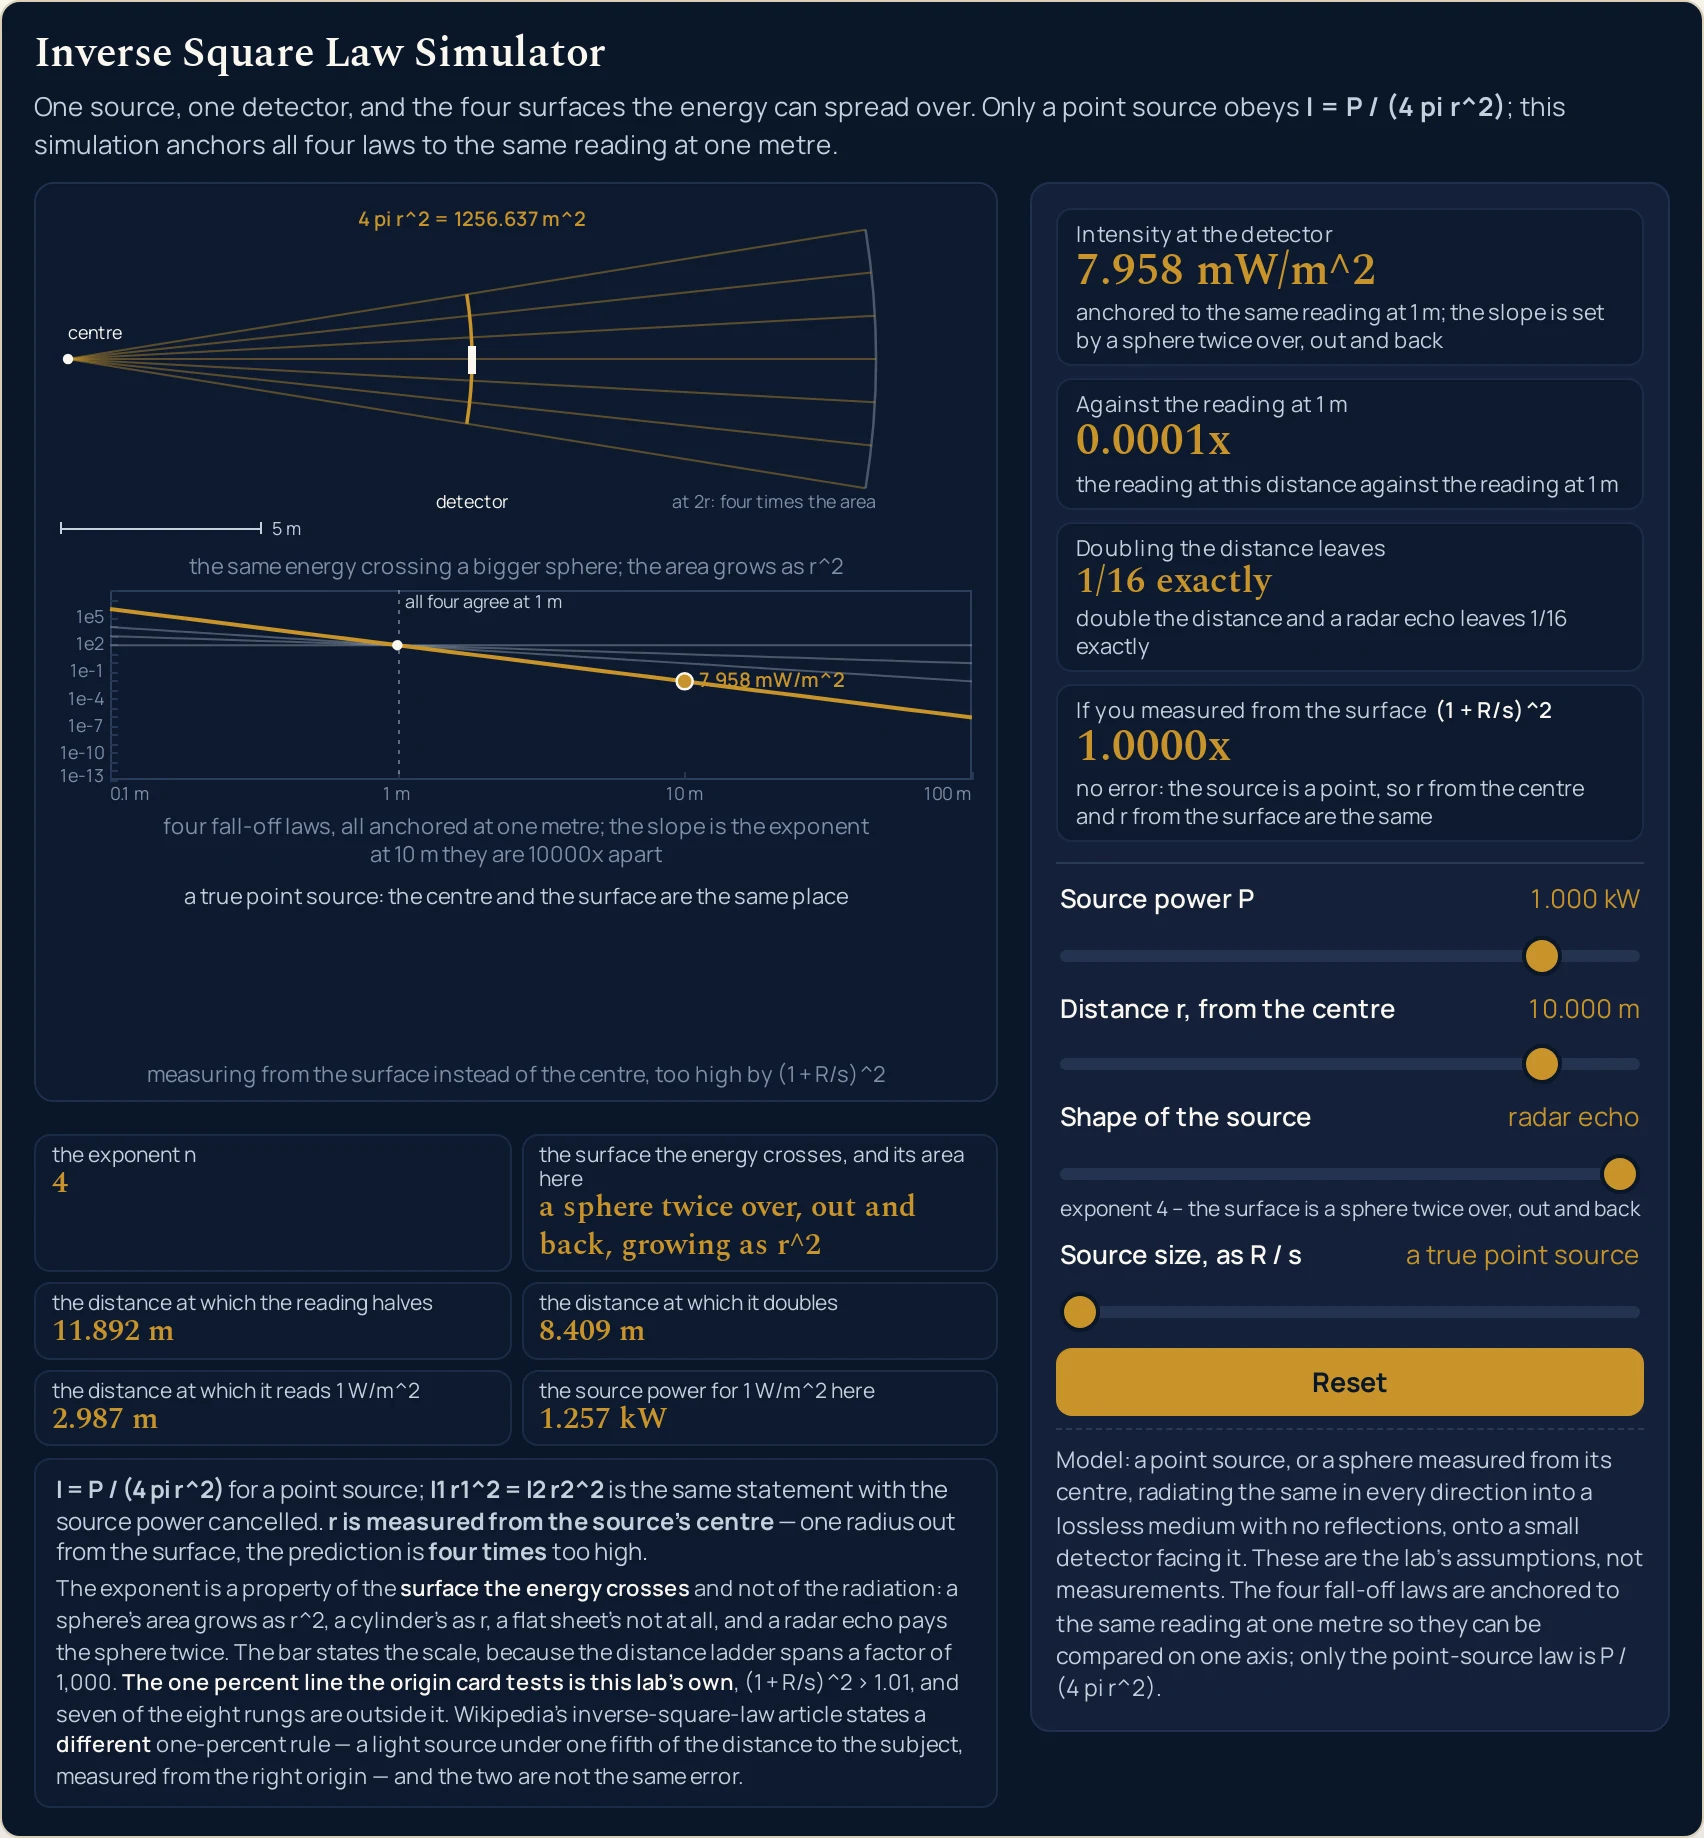
7.958 mW/m^2, 0.0001x of the anchored one-metre reading, and the cost card says 1/16 exactly. Compare the slope of the marked line in the middle band with the other three, remembering that all four were pinned together at one metre.Where It Breaks Down
Every state the four sliders can reach is answered, and the arithmetic is not where this lab can let you down. What it cannot do is model a real measurement, and what it refuses to do is treat its own idealisations as facts. The first item below is the one that matters more than all the others put together.
- Measuring from the wrong origin costs a factor of four
- Read this one before any of the others. Every intensity this panel prints assumes the distance was counted from the middle of the source, which is where a spherically symmetric emitter behaves as though all of it sat. Take the gap from its surface instead and square that, and the prediction is too high by exactly
(1 + R/s)^2—4.0000xone radius out,1.4400xat five radii,1.2100xat ten,1.0201xat a hundred. The one per cent line sits at 200.4988 source radii, which was solved rather than guessed, and 1,792 of the 2,048 states this lab can reach are past it. Adding the radius back before you measure is the whole fix, and the fourth card is there to price not doing it. - That is a different error from an extended source, and the two never correct each other
- The cleared source states its own approximation: when the size of the light source is less than one-fifth of the distance to the subject, the calculation error is less than 1 per cent. That rule is about treating a source with a size as a point at the right origin; the fourth slider on this panel is about using the wrong origin. They are different quantities, the reference script asserts that they are, and neither may be applied to the other. The source’s rule is quoted here and not extended, because the integral that would extend it needs a model of the source that nothing here provides.
- Three of the four shapes are a normalisation, not a second law
- Only the point-source rung is
P / (4 pi r^2). On the other three the slider changes the exponent while holding the one-metre reading fixed, so the numbers it prints are a fall-off law compared on a shared axis rather than an absolute intensity for that geometry. The first card says so, in those words, on every one of them. If you need an absolute figure for a long tube or a flat panel, this lab is not the place to get it and it does not pretend to be. - The top band is not a drawing you may measure
- The gap it draws between the source and the detector is a fixed fraction of the canvas width rather than a length to scale, so the metres per pixel change every time the distance slider moves. Two states cannot be compared by eye in that band at all. The labelled bar is the only thing in it that states a scale, which is exactly why it is mandatory: the distance ladder covers a factor of a thousand. The bottom band is to scale, but at its own scale, so no horizontal distance in one band means anything in the other.
- Aim this panel at a beam and the distance slider stops meaning anything
- A torch, a spotlight, a dish antenna and a laser all share one problem the cleared source names outright: their effective origin lies far behind the aperture the light appears to leave from. Set a distance on the slider for one of those and you have measured from somewhere that is not where the energy behaves as though it came from, by an amount this model cannot tell you. There is no control for it here and no figure anywhere on the page, because nothing in this cluster sources a beam divergence.
- Nothing is lost on the way, which no real medium manages
- Absorption and scattering are excluded by assumption here rather than measured away, and the cleared source states its proportionality on exactly that understanding. Air, water, glass and anything else in between take energy out as the quantity travels, so a meter on a bench drops behind this panel faster than the exponent alone would have it. Not one coefficient, half-value layer or dose figure is printed anywhere on this page for any of that, and the gamma ray guide is where attenuation and shielding belong.
- Nothing sends energy back across the sphere
- The law counts the energy crossing one sphere once. Indoors a reflected path crosses it twice, so a reading taken near a wall or in a small room is higher than this panel predicts and stops falling off at all once the reflected field dominates. No number is attached to any of that here, for the plain reason that no reflection coefficient is sourced anywhere in this cluster.
- The detector faces the source and is small compared with the distance
- The source defines the reading as what passes through unit area directly facing the source, so a tilted detector collects less and one comparable in size with the distance averages over a range of distances instead of sampling one. Neither is corrected for here and neither has a control. What the quantity itself is, and how it behaves when a detector is not facing squarely, belongs to the polarisation of light guide rather than to this panel.
- A rounded distance gets worse when it is squared
- The error in a reading is always more than double the error in the distance, by exactly the square of it: one per cent in the distance is 2.0100 per cent in the reading, five per cent is 10.2500, ten per cent is 21.0000, fifty per cent is 125.0000 and a doubling is 300.0000. Nothing on this panel is rounded, because every rung is an exact value, but the moment a distance comes off a tape measure it is. The source’s own quick photographic rules and its solar example are both instances of that, and the written guide works them through.
- The wrong geometry gives the wrong exponent, and it is one slider away
- Assume the square for a fluorescent tube at close range and the answer is out by the whole difference between
1/rand1/r^2: at ten times the distance, a tenth against a hundredth. The shape slider is here precisely so that mistake can be seen rather than argued about. The inverse square law calculator has no geometry control at all, by design, so a long, flat or echoing source is this panel’s question and not that one’s. - One sentence in this lab ships and never fires
- The sub-line under the fourth card is built to end either
outside the one percent ruleorinside the one percent rule, and across all 2,048 states the second ending never appears. Seven of the eight size rungs are outside the line — even the rung at one two-hundredth, by 0.0025 of a percentage point — and the eighth is a true point source, which takes the no-error sentence instead. The branch was kept rather than deleted, its reachable count is asserted to be zero, and no reading you can reach here will report being inside that line. - The sliders are ladders, and the lab runs one way only
- All four controls step by whole rungs, so the lab reaches 2,048 states and nothing between them. It also runs forwards only: you set a power, a distance, a shape and a size, and read what follows. There is no box to type a reading into and no way to ask for a distance back. Every figure on this page is arithmetic from four slider positions, nothing on it was measured from any real source, and the assumptions it rests on are printed in a fixed line under the drawing.
Where the Inverse Square Law Is Actually Used
- Predicting a bench reading before you move the meter
- Load the first two presets and the whole decision is on screen in two cards.
7.958 W/m^2at one metre becomes1.989 W/m^2at two, and the grid tells you where the halfway points are:1.414 mfor half the reading and70.711 cmfor double it. Two slider positions and a ratio did all of it, and at no point was the panel told what kind of thing was radiating. - Adding a lamp’s own radius back before you trust a close-range reading
- The fourth slider is this case and nothing else. A source whose radius equals the gap to its own surface makes a prediction
4.0000xtoo high; at a fifth of that gap it is1.4400x, at a tenth1.2100x, at a hundredth1.0201x. The line below one per cent is 200.4988 source radii, so a reading taken close in is almost always over it. The bottom band draws the radius against the gap so the size of the mistake is obvious. - Backing a source power out of one reading
- The sixth grid row answers it directly, and it prints 4 pi r^2 at the distance on screen. That is the power for one watt on each square metre on the point-source law:
12.566 Wat one metre,50.265 Wat two, and at one metre it is right on all four shapes, because that is where the laws are pinned. It is not that power on the other three rungs away from one metre: the1.257 kWon the radar preset would put a hundredth of a watt on each square metre at its ten, not one. Scale by your own reading for the total radiated power, provided the thing radiates equally in all directions, which the panel prints as the assumption it is. - Judging whether a source is small enough to treat as a point
- This is the question the cleared source itself is sharpest about, and its warning for radiography is that the proportionality does not hold in practical situations unless the source dimensions are much smaller than the distance. The panel offers no correction for an extended source and prints no figure for one, because none is sourced here. What it does give you is the fourth card, which prices the related and commoner mistake of measuring from the wrong place.
- Understanding why radar range costs so much more than radar power
- Load A radar echo: out and back, 1/r to the fourth. A kilowatt at ten metres returns
7.958 mW/m^2, which is0.0001xof its own one-metre reading, and the cost card reads1/16 exactly. Doubling the range costs sixteen times, so recovering it by raising the power means sixteen times the power. The echo pays the sphere twice and that is the entire reason. - Setting a lamp for a one-stop change on a stage or a set
- The halving and doubling rows are the working set for it. At one metre they read
1.414 mand70.711 cm; at two metres,2.828 mand1.414 m. The factor is the square root of two in both directions and it scales with wherever you are standing, which is why moving a light a fixed number of centimetres does something different at every distance. - Catching a fall-off claim that is not an inverse square at all
- Set the shape slider through its four rungs and read the cost card:
1/4 exactly,1/2 exactly,1x -- no change,1/16 exactly. If a claimed fall-off matches none of those, either the surface is not one of these four or something is absorbing. The cost card is the fastest test on the panel because it needs no units and no second reading. - Telling the law apart from the instances it is famous for
- The two best-known cases have their own panels with their own controls: the universal gravitation simulator puts two masses on sliders and the Coulomb law simulator puts two charges on them. Neither control exists here, because this lab is about the surface the energy crosses rather than about what is doing the crossing. Nothing this panel prints can be turned into a force without quantities it was never given.
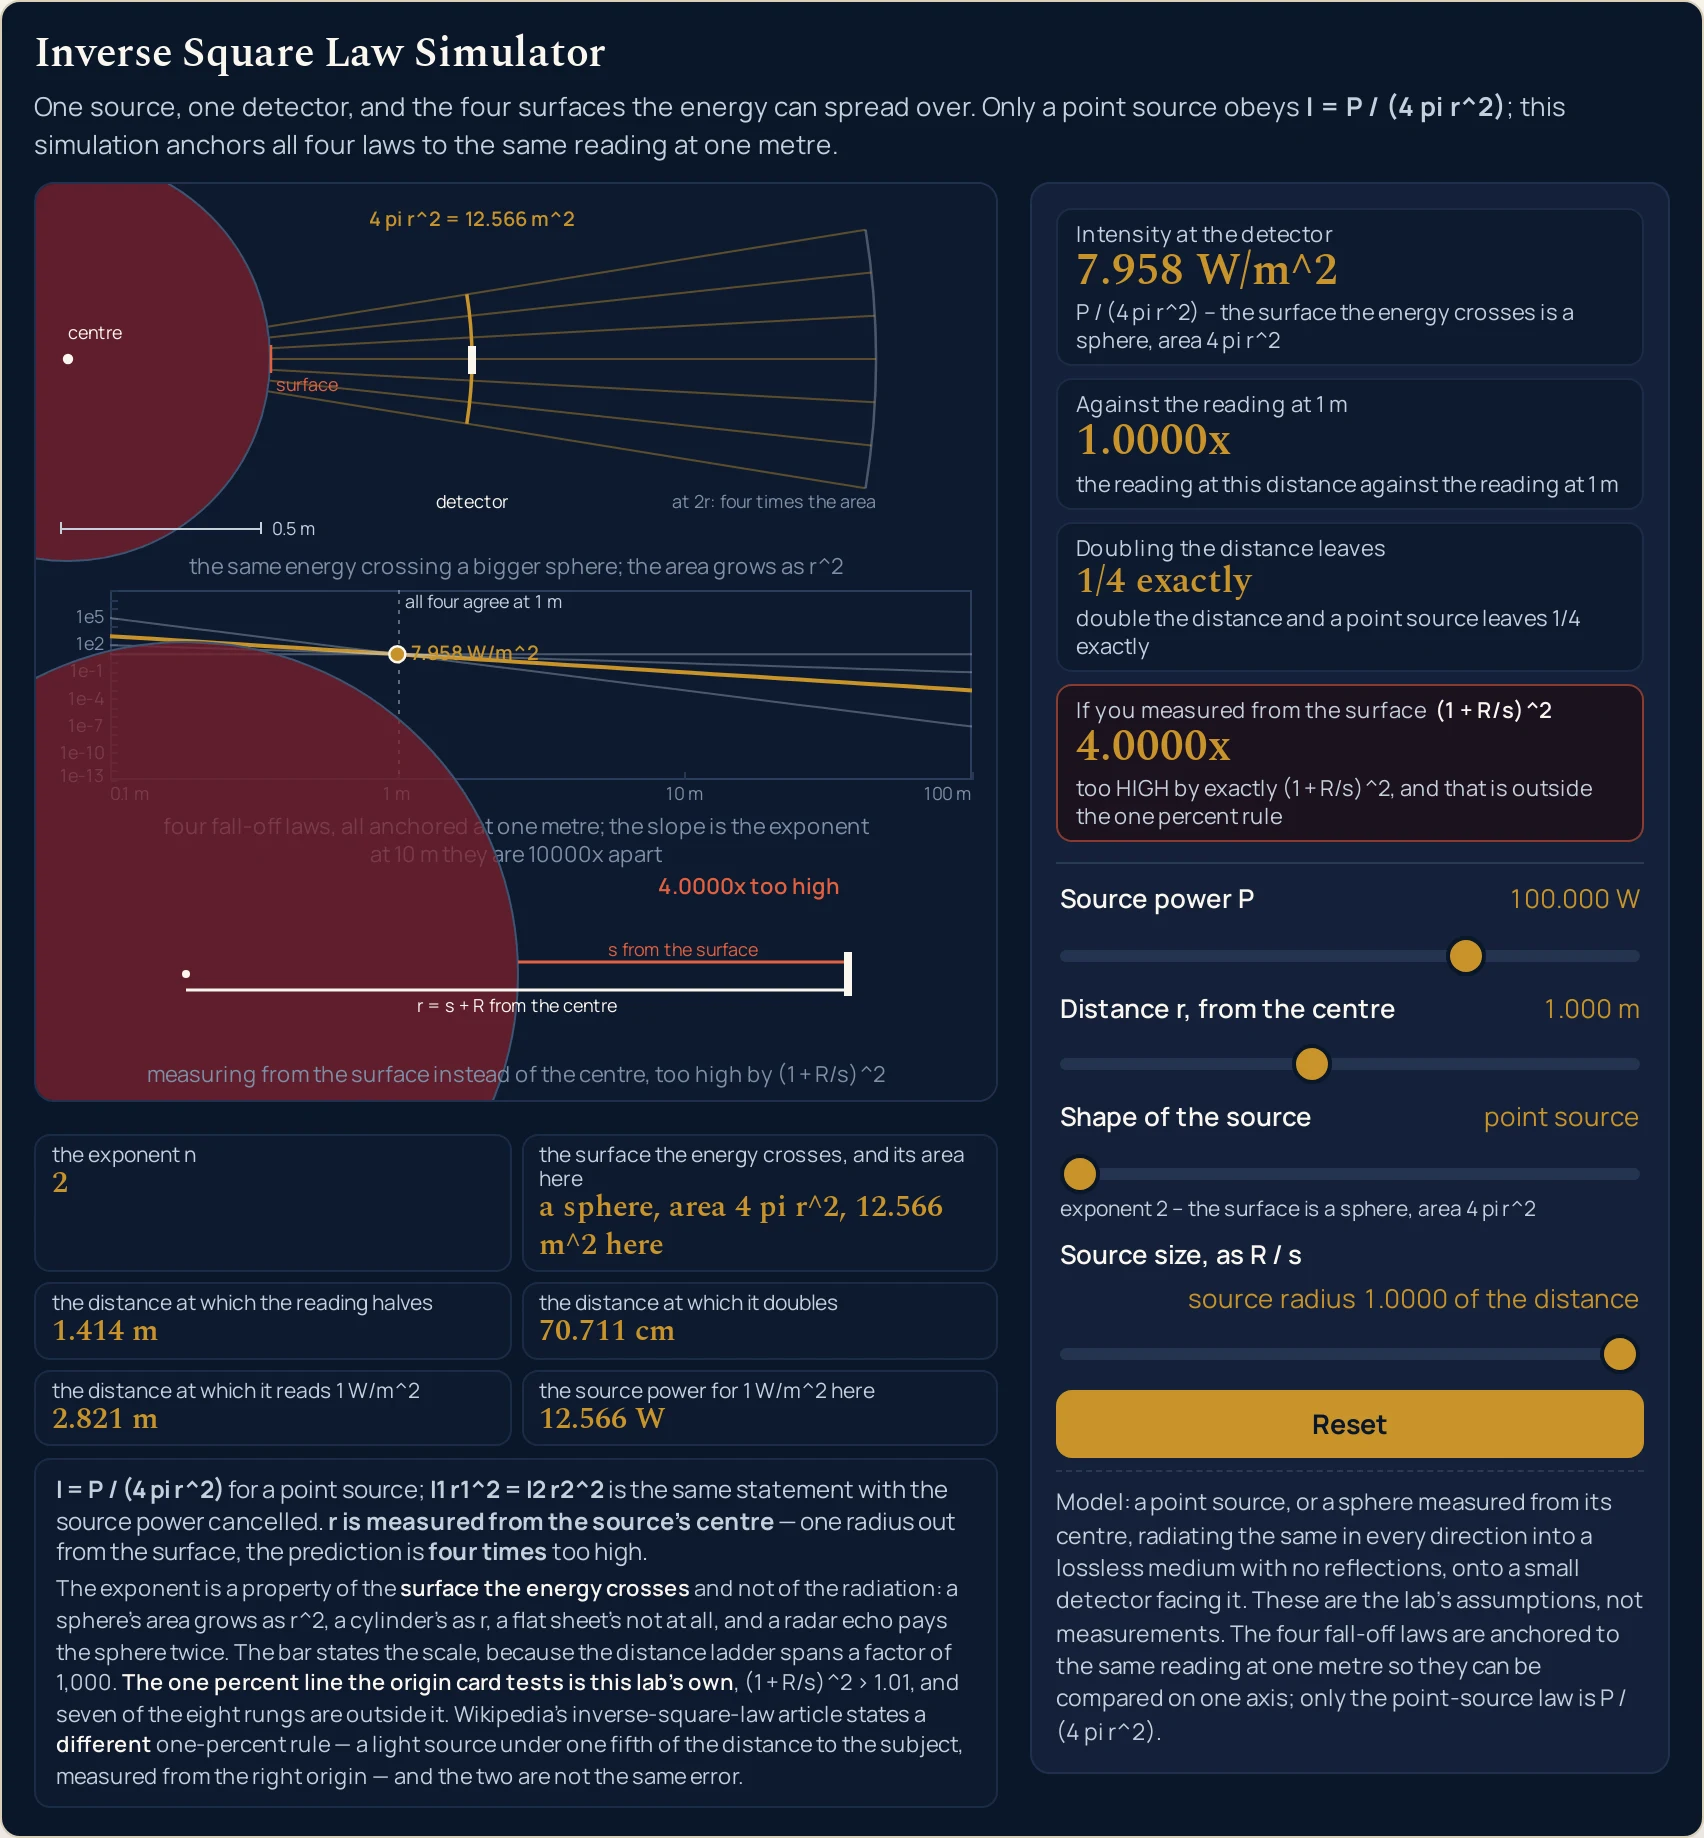
4.0000x, in the warning treatment, with the bottom band now drawing the radius against the gap. This is also the state in which the drawn source is widest, and the two discs behave differently: the top band’s is drawn first, so the middle band’s axis sits over it, while the bottom band’s is drawn after the middle band and covers the left-hand end of that axis — its five lowest decade labels, the 0.1 m and 1 m ticks and the left part of its caption lose most of their contrast. The bottom band’s own caption is drawn last and stays on top, and the readings are in the cards and the grid rather than off that axis.Where to Go Next
A panel can put you in a state and let you move one thing at a time, and that is the end of what a panel is for. The inverse square law guide is where the subject itself is written out: why the exponent is two, what the ratio form buys you, what four different spreading surfaces do to it, and why measuring from the wrong place costs a factor of four, with the problems worked step by step.
Two posts own the instances this lab deliberately stops short of. The law of gravitation guide carries the gravitational force law with its masses and its constant, and the Coulomb law guide carries the electrostatic one with its charges and its own.
Five more pick up what this lab uses but does not explain. The power guide is the quantity on the first slider, the SI units guide is where the watt per square metre comes from, the decibel formula guide is where a sound intensity becomes a level, the physics symbols guide settles which letter is which, and the physics formula sheet is the one-page reference.
Six more sit one step further out. The electromagnetic spectrum guide is what might be doing the radiating, the sound waves guide and the heat transfer guide are two other things that spread outward, the Stefan-Boltzmann guide is where a radiated power comes from, the Kepler laws guide is where an inverse-square pull becomes an orbit, and the electric field guide is the field version of the same picture.
On the tool side, the inverse square law calculator takes typed readings and distances and solves in four directions, the gravitational force calculator and the Coulomb law calculator are the two instances, the decibel calculator turns an intensity into a level, the Stefan-Boltzmann calculator gives the power a hot surface emits, and the electric field calculator is the field quantity.
Five neighbouring pictures sit beside this one: the universal gravitation simulator, the Coulomb law simulator, the decibel simulator, the Stefan-Boltzmann simulator and the electromagnetic spectrum simulator. Beyond them there is the simulation library, an index of calculators, and the blog for everything written out at length.
Frequently asked questions
Why do all four shapes of source read 7.958 W/m^2 at one metre?
Because the four fall-off laws are deliberately anchored to the same reading at one metre so that they can be compared on one axis. Only the point-source rung is P / (4 pi r^2); the other three are normalised to it, and the sentence under the intensity card says anchored to the same reading at 1 m whenever the shape is not a point. That shared value is the one point all four lines in the middle band cross.
Why does the origin card read 4.0000x when no other card moves?
Because the origin error is a property of the source size alone, and nothing else on the panel depends on it. Walk all eight rungs of Source size, as R / s on the opening state and sixteen of the nineteen readouts are byte-identical down every row: only the size label, the origin card and its sentence change. The card goes 1.0000x, 1.0100x, 1.0201x, 1.1025x, 1.2100x, 1.4400x, 2.2500x and 4.0000x.
Why do the halving and doubling rows turn into sentences on the plane-source rung?
Because a flat sheet does not fall off at all, so no distance halves the reading and none doubles it. The lab returns the literal sentences no distance halves it, no distance doubles it and every distance reads the same from branches of its own rather than from a division. A naive formula would divide by a zero exponent and print Infinity m, which is why those three rows are explicit branches.
What does the sphere area row actually tell me?
It tells you where the exponent comes from, because the area is the whole reason for it. On the opening state the row reads a sphere, area 4 pi r^2, 12.566 m^2 here, and one rung further out it reads 50.265 m^2 here, which is four times. The reading fell to exactly a quarter over the same step. Only the point-source rung prints an area; the other three print how their surface grows.
Why is the vertical axis of the middle band twenty-one decades wide?
Because the four sliders together reach twenty decades of intensity and the axis has to hold all of them without clamping. The reachable span runs from 0.796 pW/m^2 to 79.577 MW/m^2, both corners belonging to the fourth-power rung, and the axis is anchored from 1e-13 to 1e8 W/m^2 with a tick at every decade. None of the 256 power, distance and shape readings is pushed off either end.
Can I measure the distance in the top band with a ruler?
No, and the scale bar is there because you cannot. The gap drawn between the source and the detector is a fixed fraction of the canvas width rather than a length to scale, so the metres per pixel change as you move the distance slider. The bar states the scale for the state on screen, and the distance ladder spans a factor of a thousand. Read the bar, or read the cards.
Why do the sliders step through fixed rungs instead of moving smoothly?
Because a ladder makes every reading quoted about this lab reproducible rather than approximate. The power slider has eight rungs from one milliwatt to a hundred kilowatts, the distance slider eight from 0.1 m to 100 m, the shape slider four and the size slider eight, which is 2,048 states and nothing between them. The companion calculator takes typed figures and runs the relation backwards as well.
What does the Reset button put back?
All four sliders, to 100 W at one metre as a point source with a true point size. It replays the opening settle rather than cutting to it, so the scene is drawn in, and the panel lands on 7.958 W/m^2, 1.0000x, 1/4 exactly and 1.0000x. Nothing is left animating once it has finished, and the four control values written back are the opening ones.
References & formula source
- Every figure on this page is one relation read somewhere different. A quantity radiated evenly outward from a small source has to cross every sphere drawn around that source, and the area of such a sphere is four pi times the square of its radius, so the power crossing each square metre is the total power divided by that area. Dividing two such readings cancels the power, which leaves the first reading times the square of the first distance equal to the second reading times the square of the second. The relations are applied here rather than derived; the written guide derives them.
- Seven things are this lab’s stated assumptions and not measurements of anything: the source is a point, or a sphere whose distance is taken from its centre; it radiates the same in every direction, so no beam, no reflector and no laser; the medium neither absorbs nor scatters; nothing reflects energy back across the sphere; the detector faces the source and is small compared with the distance; the quantity is conserved as it spreads; and the four fall-off laws are anchored to the same reading at one metre so that they can be compared on one axis. The panel prints that list in a fixed line under the drawing and labels it as the model rather than as a finding.
- Only the point-source rung is the law itself. At the other three the slider changes the exponent while holding the reading at one metre fixed, which is a normalisation and not a second physical law: a line source’s intensity needs a power per unit length and a plane source’s needs a power per unit area, so putting four absolute scales on one slider would have been dishonest. The sentence under the intensity card says anchored to the same reading at 1 m on all three of them, and it is the reason the four lines in the middle band pass through one point. Four distinct versions of that sentence ship, one per geometry, measured across all 2,048 states.
- The origin result is this cluster’s own and it is exact. For a source that is a sphere of radius R rather than a point, the law is exact in a distance taken from the centre; take a gap from the surface instead and square that, and the prediction is too high by exactly one plus the radius over the gap, all squared. That is four times one radius out, and the one per cent line sits at 200.4988 source radii, which was solved rather than guessed. Measured over the whole grid, 1,792 of the 2,048 states the four sliders reach are outside that line, which is 87.5 per cent, or seven size rungs in eight.
- That is a different error from the one-fifth rule, and the two are never applied to each other. The cleared source states that when the size of the light source is less than one-fifth of the distance to the subject, the calculation error is less than 1 per cent, and that rule is about treating an extended source as a point at the right origin. This lab’s factor is about using the wrong origin. The reference script asserts that they are different quantities, and no surface in this cluster extends the source’s rule, derives it or puts a second number on it, because the integral that would settle it needs a model of the source that nothing here provides.
- One sentence in the lab ships and never fires. The origin sub-line is built to end either outside the one percent rule or inside the one percent rule, and across all 2,048 states the second ending never appears: seven of the eight size rungs are outside the line and the eighth is a true point source, which takes the no-error sentence instead. Even the rung at one two-hundredth is outside it, by 0.0025 of a percentage point. The branch was kept rather than deleted and the reachable count of it is asserted to be zero, so no reading a visitor can reach reports being inside that line.
- The arithmetic never stops, which is the honest shape of this subject. Every one of the 2,048 states the sliders reach returns a finite, strictly positive reading with no empty string, no not-a-number and no infinity anywhere, because the smallest distance on the ladder is a tenth of a metre and the one division the subject contains is therefore unreachable from the panel. The three distances that would be infinite on a flat sheet are literal sentences from branches of their own rather than divisions by a zero exponent. None of that makes a reading true of any real source; it makes the panel answer every question it is asked.
- The top band is not a drawing you may measure. The gap it draws between the source and the detector is a fixed fraction of the canvas width rather than a length to scale, so the metres per pixel change as the distance slider moves, and the labelled bar is the only thing in the band that states a scale. That is why the bar is mandatory: the distance ladder covers a factor of a thousand. The bottom band is to scale, in the sense that the drawn radius over the drawn gap is exactly the ratio the slider is set to, but it is at its own scale and no horizontal distance in one band means anything in the other.
- Every figure quoted on this page is a string the simulation printed. The cluster simulation report is where those strings are recorded, and it is not a sample: it harvests all five presets with all nineteen of their readouts, all eight size rungs on the opening state, all four geometries on it, the exponent ladder driven through the panel, the three flat-sheet sentences, both ends of all four sliders, the four corners of the grid, the anchored reading at four distances on four geometries, the two logarithmic axes with their decade strides at nine canvas widths, every string the canvas drew in draw order, every rendered string in the panel that carries no readout identifier, the Reset button before and after, and all 256 power, distance and shape states as a machine-diffable table. The independent reference script, written before the simulation, runs 3,803 checks against the same relations with none failing.
- Two browser engines were compared reading by reading rather than assumed to agree: the same slider positions were driven in Chrome and in Firefox at four widths and 149 readouts compared, every one identical. There is a hole in that and it is Safari. The WebKit build on the machine this was tested on will not start, so Safari was never exercised and nothing on this page is evidence about it. Touch and pointer dragging were likewise not exercised: every harness drives the sliders by writing a value and dispatching an event rather than by moving a finger.
- One figure on this page is true of the mathematics rather than of every engine’s floating point, and it is the ten-thousand-fold span the middle band’s caption states at ten metres. Raising ten to the power of minus four agrees exactly in Node and lands one bit out in Chrome 131, which would make the span 10000.000000000002 if anything printed it to that many digits. Nothing does: the ratio card prints four decimals and reads 0.0001x in both engines, every one of the 149 compared readouts matched, and the span is quoted here as a property of the four exponents and not as a claim about bitwise float equality.
- The drawing degrades honestly on a narrow screen rather than dropping a rung out of the middle of a run. The vertical decade ladder labels every third decade, seven labels, at most canvas widths; at a 380 pixel canvas the stride widens to seven and four labels remain; and at a 320 pixel one only the bottom label survives. Every labelled run is a prefix of the stride grid starting at the first tick, and both test tiers assert that the k-th label sits at k times the stride. The band captions shorten in the same way, band by band, and the clause about the area growing as the square of the distance is on screen at every width tested.
- Further reading: Inverse-square law — Wikipedia