Blackbody radiation is the thermal radiation an ideal surface emits, with a spectrum fixed by its absolute temperature and nothing else. Planck’s law gives the power radiated at every wavelength, so one number sets the whole curve. The Sun, at its nominal 5772 K, puts 36.64 per cent of that power into the 400 to 700 nm visible band.
Hold a hand near an electric hob ring on its lowest setting and you feel the heat long before the metal shows any colour. Turn it up and a dull red arrives, then orange. Nothing has been added to the metal — the same surface is simply radiating more, and radiating more of it at shorter wavelengths.
Push that far enough and the glow goes white, which is what a filament does. The interesting question is not why the colour changes. It is how much of what comes off is light you can actually see, and the answer turns out to have a hard ceiling nobody can engineer their way past.
What Is Blackbody Radiation?
Blackbody radiation is the electromagnetic radiation given off by a surface purely because it is warm, in a pattern that depends on its absolute temperature and on no other property of the object.
The word “black” is doing something specific here. A blackbody is an idealised surface that swallows every wavelength falling on it — no reflection, no transmission — and, in thermal equilibrium, radiates just as freely as it absorbs. Colour, chemistry, polish and history all drop out. Two blackbodies at the same temperature have identical spectra.
That is a remarkably strong claim, and it is what makes the subject worth the effort. Hand someone a single number, the temperature, and they can reconstruct the entire distribution of radiated power across every wavelength, from radio to gamma. No material data required.
Every object above absolute zero radiates something. At room temperature almost all of it is far infrared, which is why a person, a wall and a cup of tea all glow steadily to a thermal camera and not at all to you.
The physics that follows starts from one surface at one temperature and stays there. It is a statement about the source, never about the eye.
The Planck Radiation Formula
Planck’s law gives the power a blackbody radiates per unit area, per unit wavelength — the shape of the curve rather than its total.
Each symbol is something fixed or something you choose:
- Mλ — spectral exitance: the power leaving one square metre of surface per unit wavelength, in W/m2 per metre of wavelength (usually quoted per nm).
- λ — the wavelength you are asking about, in metres (m).
- T — the absolute temperature of the surface, in kelvin (K). Never degrees Celsius.
- h — the Planck constant, exactly 6.62607015 × 10⁻³⁴ J s.
- c — the speed of light, exactly 299,792,458 m/s.
- k — the Boltzmann constant, exactly 1.380649 × 10⁻²³ J/K.
The 2π at the front matters. It makes this the hemispherical form, power radiated into the whole half-space above the surface; drop it and you have the radiance, which is power per steradian and a different quantity entirely. Losing that factor is an easy slip to make, and the cure is to check that the curve integrates to the total the Stefan-Boltzmann law predicts.
Two summary numbers fall straight out of the curve. Integrate it over all wavelengths and you get the total, M = σT4 with σ = 5.670374419 × 10⁻⁸ W/m2/K4, which our guide to the Stefan-Boltzmann law works through in full. Differentiate it and you get the peak, at λpeak = b/T with b = 2.897771955 × 10⁻³ m K.
Neither of those answers the question this page is about. A total tells you how much; a peak tells you where the maximum is; neither tells you how much power lands between two wavelengths. That integral has no closed form in elementary functions, so it has to be evaluated numerically — which is exactly what the blackbody radiation calculator does when you hand it a temperature and two band edges.
The lab below draws that curve for whatever temperature you set, shades the band you care about and reads out the share of the power inside it. Both edges move, which is the quickest way to see that the percentage belongs to the edges every bit as much as to the temperature.
One caution before you drag anything. The vertical scale is set by the temperature currently on screen, because the peak height climbs as the fifth power of temperature — so a cool curve and a hot one are drawn to fill the same frame and are nothing like the same size. Compare the shapes; take the magnitudes from the readouts.
How Much of the Spectrum Is Visible?
For a blackbody at 5772 K, the Sun’s nominal effective temperature, 36.64 per cent of the radiated power falls between 400 and 700 nm.
Say that out loud and it already sounds low. Sunlight feels like the definition of brightness, yet nearly two thirds of what leaves the solar surface is invisible: 12.18 per cent below 400 nm in the ultraviolet, and 51.18 per cent above 700 nm in the infrared. More of the Sun’s output is heat you cannot see than light you can.
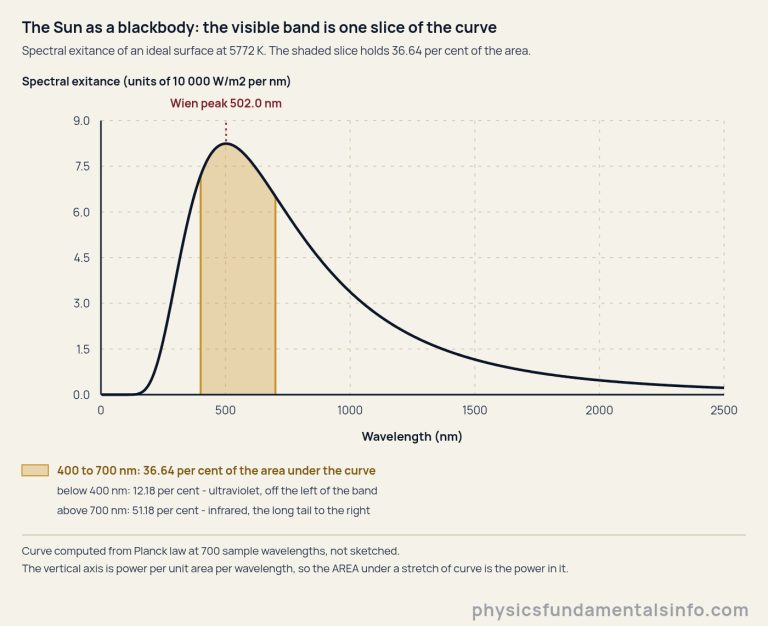
Where those two edges sit is a convention, not a measurement — our guide to the electromagnetic spectrum sets out the bands and where the visible one falls among them. This page takes 400 to 700 nm and states it beside every figure, because the choice moves the answer. Widen it to 380 to 750 nm and the same 5772 K surface reads 43.77 per cent instead, seven points higher for no change in the physics at all.
Change the temperature and the split moves far more violently than the band edges ever could.
| Surface temperature | Wien peak | Below 400 nm | 400 to 700 nm | Above 700 nm |
|---|---|---|---|---|
| 2700 K — warm-white filament | 1073.2 nm | 0.075 % | 4.999 % | 94.925 % |
| 3000 K — halogen lamp | 965.9 nm | 0.213 % | 8.092 % | 91.695 % |
| 3600 K — tungsten near melting | 804.9 nm | 0.961 % | 15.605 % | 83.434 % |
| 5772 K — the Sun | 502.0 nm | 12.177 % | 36.638 % | 51.185 % |
| 6500 K — daylight reference | 445.8 nm | 18.312 % | 38.873 % | 42.815 % |
| 7042 K — the best there is | 411.5 nm | 23.169 % | 39.302 % | 37.529 % |
| 12000 K — a very hot surface | 241.5 nm | 60.754 % | 26.362 % | 12.884 % |
Two things to notice in that table. The visible column rises, peaks and falls again, which is the whole story of the next section. And each row is a partition of one spectrum, so the exact values sum to 100 per cent — though the 2700 K row reads 99.999 because all three cells round down, and rounding a figure twice to force it to 100 would be the wrong fix.
The cold end deserves a sentence of its own. A surface at 1000 K, a solid dull red glow, sends 0.000184 per cent of its power into the visible band — under a thousandth of one per cent, but emphatically not zero. You can see it, because your eye is a very good detector and the total power is large.
Why 7042 K Beats the Obvious Guess
Here is the trap. If you want to fill the 400 to 700 nm band, the natural move is to put the peak in the middle of it, at 550 nm. Invert Wien’s law and that asks for 5268.7 K.
It delivers 33.71 per cent. The best any temperature manages for these two edges is 39.30 per cent, at 7042 K, and that surface has its peak at 411.5 nm — hard against the violet edge, not in the middle at all. That leaves the obvious guess 5.6 points short.
The reason is that a Planck curve is not symmetric, and the asymmetry is the same at every temperature.
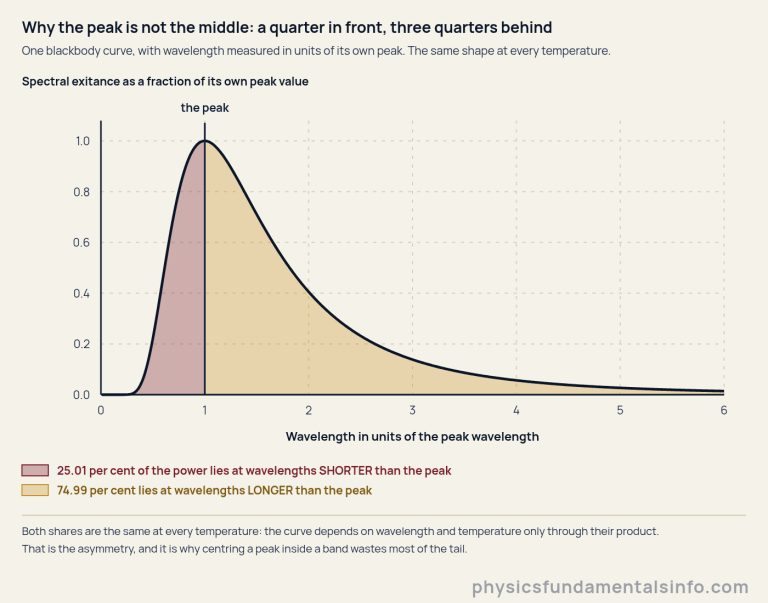
Read the two shares again: 25.01 per cent of the power sits at wavelengths shorter than the peak, and 74.99 per cent at longer ones. Those are not figures for the Sun. They hold for a filament, a star and a radiator alike, because the curve depends on wavelength and temperature only through their product.
Now the tactic is obvious. Centre the peak in your band and you keep the short quarter but throw three quarters of the power out past the far edge. Shove the peak towards the short-wavelength edge instead and the long tail — where the power actually is — lands inside the band rather than beyond it. You give up very little on the steep side, because there was never much out there to give up.
Plot the share against temperature and that trade-off shows up as a single broad hump.
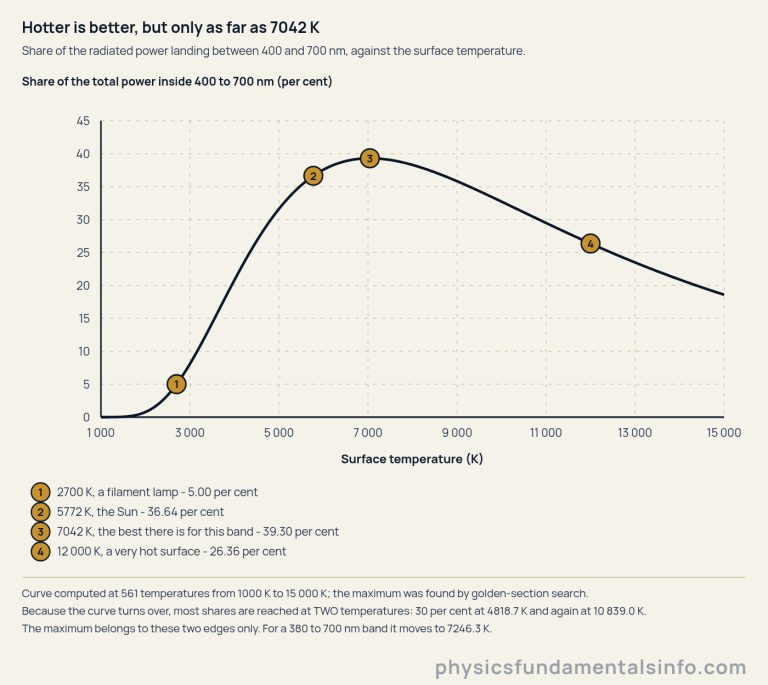
Three readings come out of that curve. The top is flat, so the Sun gives up only 2.66 points despite being 1270 K cooler than the optimum. The left-hand rise is brutally steep, which is why a filament at 2700 K manages 5.00 per cent and a halogen 300 K hotter already manages 8.09 per cent.
And the right-hand fall is the part people do not expect. Past 7042 K the curve slides bodily into the ultraviolet: at 12000 K the visible share is back down to 26.36 per cent, with 60.754 per cent of the power now shorter than 400 nm. Hotter stops helping.
Because the curve turns over, most visible shares belong to two temperatures rather than one. Exactly 30.00 per cent is reached at 4818.7 K on the way up and again at 10839.0 K on the way down, which is worked through in problem 7.
One boundary on all of this. The 39.30 per cent ceiling and the 7042 K that reaches it belong to the 400 to 700 nm band and to nothing else. Move the lower edge to 380 nm and the optimum shifts to 7246.3 K, where the share is 42.531 per cent.
Real-World Examples of Blackbody Radiation
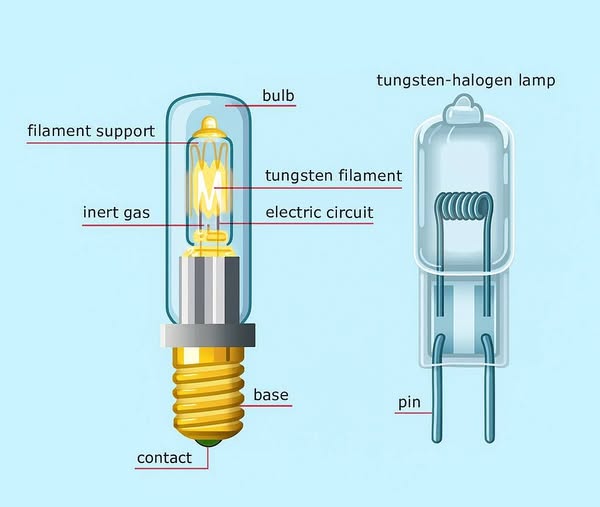
The incandescent lamp. A warm-white filament runs near 2700 K, which puts its peak at 1073.2 nm — deep in the infrared, nowhere near the band you want. Only the leading edge of the curve reaches into the visible at all, and the share is 5.00 per cent. For an ideal emitter that figure is fixed the moment the temperature is, which is why the room to improve a hot wire was always so small.
Non-contact thermometers. Point an infrared thermometer at a casting and it measures brightness in a narrow slice of the spectrum, then infers the temperature that would produce it. Which slice the instrument uses decides how sharply its reading responds, because the steepness of the curve varies enormously along its length.
Stars. A star’s colour index compares the power it emits in two standard wavelength bands — to a first approximation, exactly the quantity this page computes, taken twice. That comparison is how a temperature gets attached to a star nobody will ever visit.
Spacecraft and building surfaces. Something in sunlight absorbs across a roughly 5772 K spectrum and re-radiates across one near its own temperature, a few hundred kelvin. Those two spectra barely overlap, and a coating that behaves differently in each band can therefore run far cooler or warmer than a grey one.
Four different fields, one calculation. In each case somebody needs the power between two wavelengths, not the total and not the peak.
Common Misconceptions About Blackbody Radiation
“The Sun peaks at 502 nm, which is green, and that is why our eyes evolved there.” Two problems. The 502.0 nm figure is the peak of the curve plotted per unit wavelength; write the same spectrum per unit frequency and the maximum lands somewhere else entirely, because changing variable stretches the axis unevenly. And a peak is not where the power is — three quarters of it lies at longer wavelengths.
“A hotter filament would be proportionally more efficient.” Careful. Going from 2700 K to the 7042 K optimum multiplies the visible share by 7.86, but it also multiplies the total radiated power by 46.3, and neither ratio is lumens per watt. Nothing here weights wavelengths the way an eye does, and no filament survives 7042 K in any case.
“Visible light is 400 to 700 nm, so 36.64 per cent is a fact of nature.” The temperature is a fact; the edges are a choice. Adopt 380 to 750 nm and the same surface reads 43.77 per cent. Any percentage quoted without the two wavelengths that produced it cannot be checked against anything, which is why every figure on this page carries its band.
“A dull red hot plate emits no visible light.” It emits very little, which is not the same thing. At 1000 K the visible share is 0.000184 per cent — under 0.001 per cent — and you still see the glow. Zero is a strong word and the model never produces it above absolute zero.
“Blackbody radiation explains why a prism makes a rainbow.” Different subject. The spectrum here says how much power sits at each wavelength; how a medium separates those wavelengths is refraction, which our guide to dispersion of light handles. This page never asks what colour a wavelength looks.
How Blackbody Radiation Relates to Wien’s Law and the Stefan-Boltzmann Law
Three results describe one curve, and confusing them is the commonest way to get a wrong answer quickly.
Wien’s displacement law locates the maximum: λpeak = b/T, so 5772 K gives 502.0 nm and 2700 K gives 1073.2 nm. It says where the curve is tallest and nothing about how much power is there. The Wien’s law calculator handles that one figure on its own.
The Stefan-Boltzmann law gives the area: M = σT4, which is 6.29386 × 10⁷ W/m2 at 5772 K. It says how much in total and nothing about where. The Stefan-Boltzmann calculator adds the emissivity term that real surfaces need.
Planck’s law is the curve both of those are derived from, and the band fraction is the part neither can supply. Peak, area, distribution — three questions, and only the third one asks what lands between two wavelengths.
Wavelength itself is the axis all of this is plotted against, and the nanometre-to-metre bookkeeping is worth having straight before you start; the guide to wavelength formulas and units covers the scale from angstroms upward.
There is a second way to read the band, too. Convert its edges to photon energies with E = hc/λ and 400 nm is 3.0996 eV while 700 nm is 1.7712 eV, so the entire visible range spans a factor of only 1.750 in photon energy — a narrower window than the wavelength numbers suggest.
If you would rather drive the curve than read about it, the blackbody radiation simulator is the same lab on a page of its own, with cases to load and the band edges under your control.
Where the Blackbody Model Breaks Down
Planck’s law is exact for an ideal emitter. Everything that goes wrong comes from pressing it onto a surface that is not one, or from carrying a figure away from the assumptions that produced it.
Real surfaces are not blackbodies. Each emits some fraction of the ideal value at each wavelength, and that fraction generally varies with wavelength, so a measured spectrum differs in shape as well as in area. A single grey factor would cancel straight out of a band share and hide precisely the wavelength dependence that matters.
The Sun is not one either, strictly. Its spectrum carries absorption lines, and its effective temperature varies with wavelength and with position on the disc. And 5772 K is a defined nominal value rather than a reading taken from the Sun.
Every solar figure here is also top-of-atmosphere. Sunlight at the ground is a different spectrum again, with most of the ultraviolet removed and chunks bitten out of the infrared.
One check is worth more than all the internal consistency in the world. Scale the 5772 K surface exitance down to the Earth’s orbit and the model predicts 1361.16 W/m2, against a measured total solar irradiance of about 1361 W/m2 — agreement to 0.01 per cent. That, and the derived constants matching their published values, are the only genuinely external tests here.
Be clear about what is not a test. The three shares adding to 100 per cent is a definition restated, and this article agreeing with the lab and the calculator proves only that one model was implemented three times. Neither is evidence about the world.