The blackbody radiation simulator draws M_lam, the curve an ideal radiator follows at the temperature you set, and shades the slice of it you care about. Four sliders move the temperature, both band edges and a probe wavelength; four cards and eight cells answer. Load one of the seven cases below, then change one thing at a time and watch what the canvas does as well as what the cards say. The rest of the page names every control and readout, tabulates all seven cases as the lab printed them, and says which heights on this drawing may be compared and which may not.
The Blackbody Spectrum
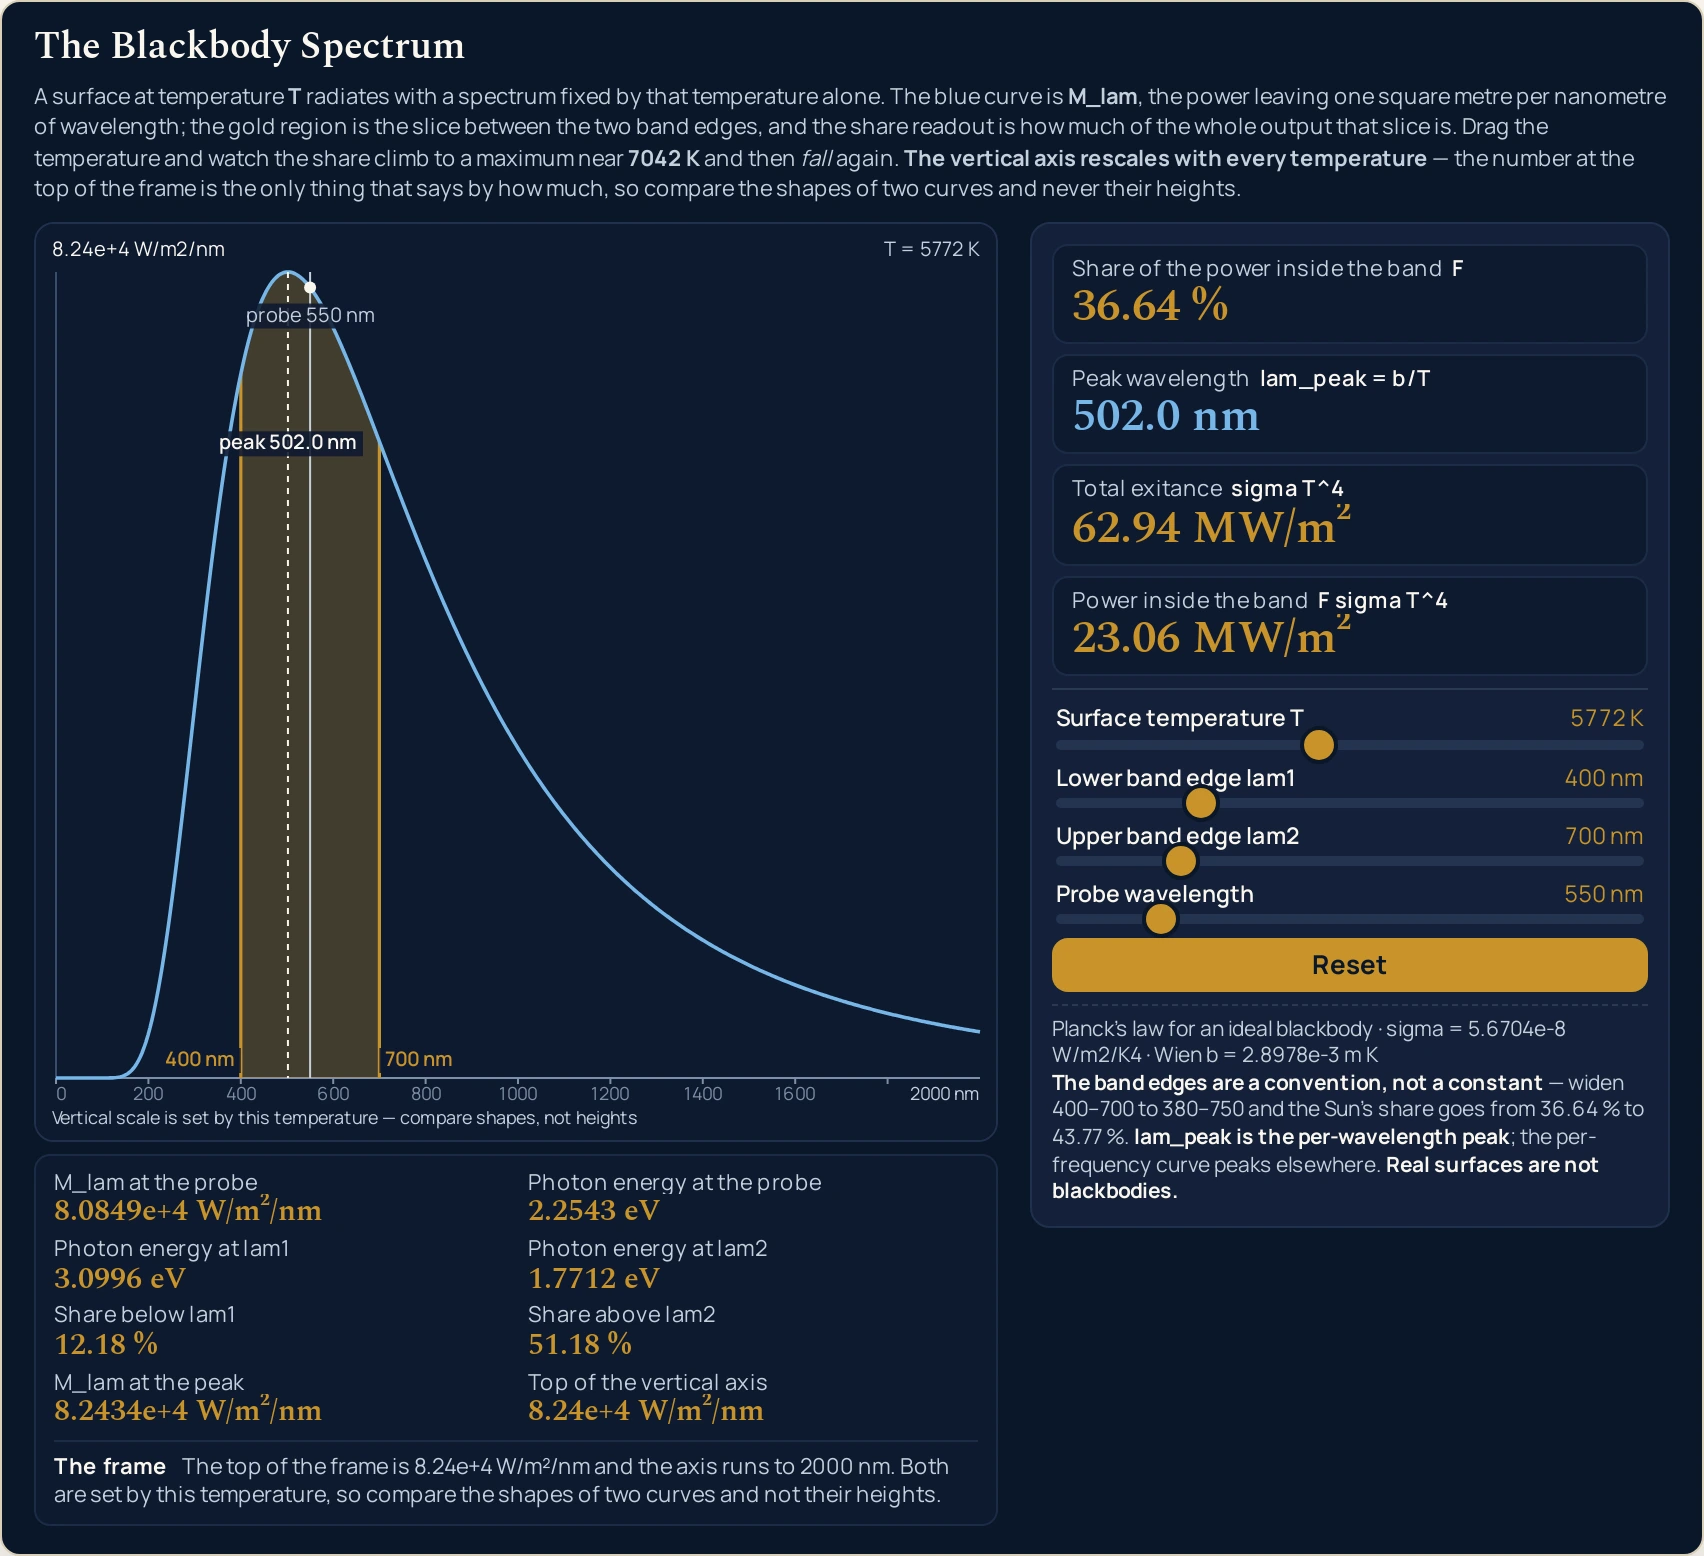
A surface at temperature T radiates with a spectrum fixed by that temperature alone. The blue curve is M_lam, the power leaving one square metre per nanometre of wavelength; the gold region is the slice between the two band edges, and the share readout is how much of the whole output that slice is. Drag the temperature and watch the share climb to a maximum near 7042 K and then fall again. The vertical axis rescales with every temperature — the number at the top of the frame is the only thing that says by how much, so compare the shapes of two curves and never their heights.
M_lam at the probe8.0849e+4 W/m²/nm
Photon energy at the probe2.2543 eV
Photon energy at lam13.0996 eV
Photon energy at lam21.7712 eV
Share below lam112.18 %
Share above lam251.18 %
M_lam at the peak8.2434e+4 W/m²/nm
Top of the vertical axis8.24e+4 W/m²/nm
The frameThe top of the frame is 8.24e+4 W/m²/nm and the axis runs to 2000 nm. Both are set by this temperature, so compare the shapes of two curves and not their heights.
Share of the power inside the band F
36.64 %
Peak wavelength lam_peak = b/T
502.0 nm
Total exitance sigma T^4
62.94 MW/m²
Power inside the band F sigma T^4
23.06 MW/m²
Surface temperature T5772 K
Lower band edge lam1400 nm
Upper band edge lam2700 nm
Probe wavelength550 nm
Planck's law for an ideal blackbody · sigma = 5.6704e-8 W/m2/K4 · Wien b = 2.8978e-3 m K
The band edges are a convention, not a constant — widen 400–700 to 380–750 and the Sun's share goes from 36.64 % to 43.77 %. lam_peak is the per-wavelength peak; the per-frequency curve peaks elsewhere. Real surfaces are not blackbodies.
The band edges are a convention, not a constant — widen 400–700 to 380–750 and the Sun's share goes from 36.64 % to 43.77 %. lam_peak is the per-wavelength peak; the per-frequency curve peaks elsewhere. Real surfaces are not blackbodies.
Load a real case on the sliders
Each button presses the lab’s own Reset and then writes all four sliders, so every load starts from the same place. Work down the list in order: the first six hold the band at 400–700 nm and move only the temperature, which is the one comparison this lab is built to make. The last button changes no temperature at all and still moves the headline by seven points.
Pick a case above, or drag the four sliders yourself.
![Blackbody Radiation Simulator reference card: M_lam = 2 pi h c^2 / [lam^5 (exp(hc/lam kT) - 1)], with the four sliders that set the surface temperature, the two band edges and the probe wavelength, and the range each one covers](/labs/img/blackbody-radiation-simulator.jpg)
What Is the Blackbody Radiation Simulator?
The blackbody radiation simulator is a free interactive physics lab that runs in your browser, with nothing to install and no sign-up. It draws one curve, M_lam, the power an ideal radiator sends out per square metre per nanometre of wavelength at the temperature on the slider, and shades the slice of that curve lying between two band edges you set yourself.
A cream tick marks the Wien peak lam_peak = b/T and a thin cream line reads the curve at a probe wavelength, dropping a dot where the two meet. Both axes are rebuilt from the temperature, so the number printed at the top of the frame is the only thing carrying the magnitude, and a caption along the bottom of the canvas says so.
Four sliders set the surface temperature from 800 to 12,000 K, the lower band edge from 100 to 1400 nm, the upper band edge from 150 to 3000 nm and the probe from 100 to 3000 nm, every one of them in steps of 1. Four cards answer with the share of the power inside the band, the peak wavelength, the total exitance sigma T4 and the power the band itself holds.
Eight smaller cells carry the curve height and the photon energy at the probe, the photon energy at each band edge, the shares of the power falling below and above the band, the curve height at the peak and the top of the vertical axis, with a sentence strip headed The frame naming both live numbers. Reset restores 5772 K with the band at 400 to 700 nm and the probe at 550 nm.
| Control | Range | Step |
|---|---|---|
| Surface temperature | 800 to 12,000 K | 1 K |
| Lower band edge | 100 to 1400 nm | 1 nm |
| Upper band edge | 150 to 3000 nm | 1 nm |
| Probe wavelength | 100 to 3000 nm | 1 nm |
How to use the blackbody radiation simulator
- Start from the state it opens in. The lab boots on Surface temperature T 5772 K, Lower band edge lam1 400 nm, Upper band edge lam2 700 nm and Probe wavelength 550 nm, with the four cards reading 36.64 %, 502.0 nm, 62.94 MW/m² and 23.06 MW/m². Reset returns all four sliders to exactly that.
- Move the temperature first. Surface temperature T runs from 800 to 12000 K in steps of 1, and it is the only slider that changes the curve rather than the way it is read. Take it up slowly and watch Share of the power inside the band climb, stall and then fall back; the turning point is at 7042 K.
- Move the two band edges. Lower band edge lam1 runs from 100 to 1400 nm and Upper band edge lam2 from 150 to 3000 nm, both in steps of 1, and together they decide how wide the gold region is. They cannot cross: push one against the other and the lab moves the edge you are not dragging 1 nm clear and rewrites both its slider and its label.
- Park the probe where you want a reading. Probe wavelength runs from 100 to 3000 nm and drops a thin cream line with a dot where it meets the curve. It feeds M_lam at the probe and Photon energy at the probe and nothing else, so you can move it freely without disturbing a single card.
- Read the four cards down the right. Share of the power inside the band carries its symbol
F; Peak wavelength carrieslam_peak = b/T; Total exitance carriessigma T^4, the quantity the Stefan-Boltzmann calculator returns on its own; and Power inside the band is the product of the first and the third. - Read the eight cells under the canvas. They give the curve height and the photon energy at the probe, the photon energy at each band edge, the Share below lam1 and Share above lam2, the curve height at the peak, and the Top of the vertical axis.
- Read the strip headed The frame. It names both numbers the drawing depends on — the top of the vertical axis and how far right the horizontal one runs — and it is rewritten on every update, so it can never describe a frame that is no longer on screen.
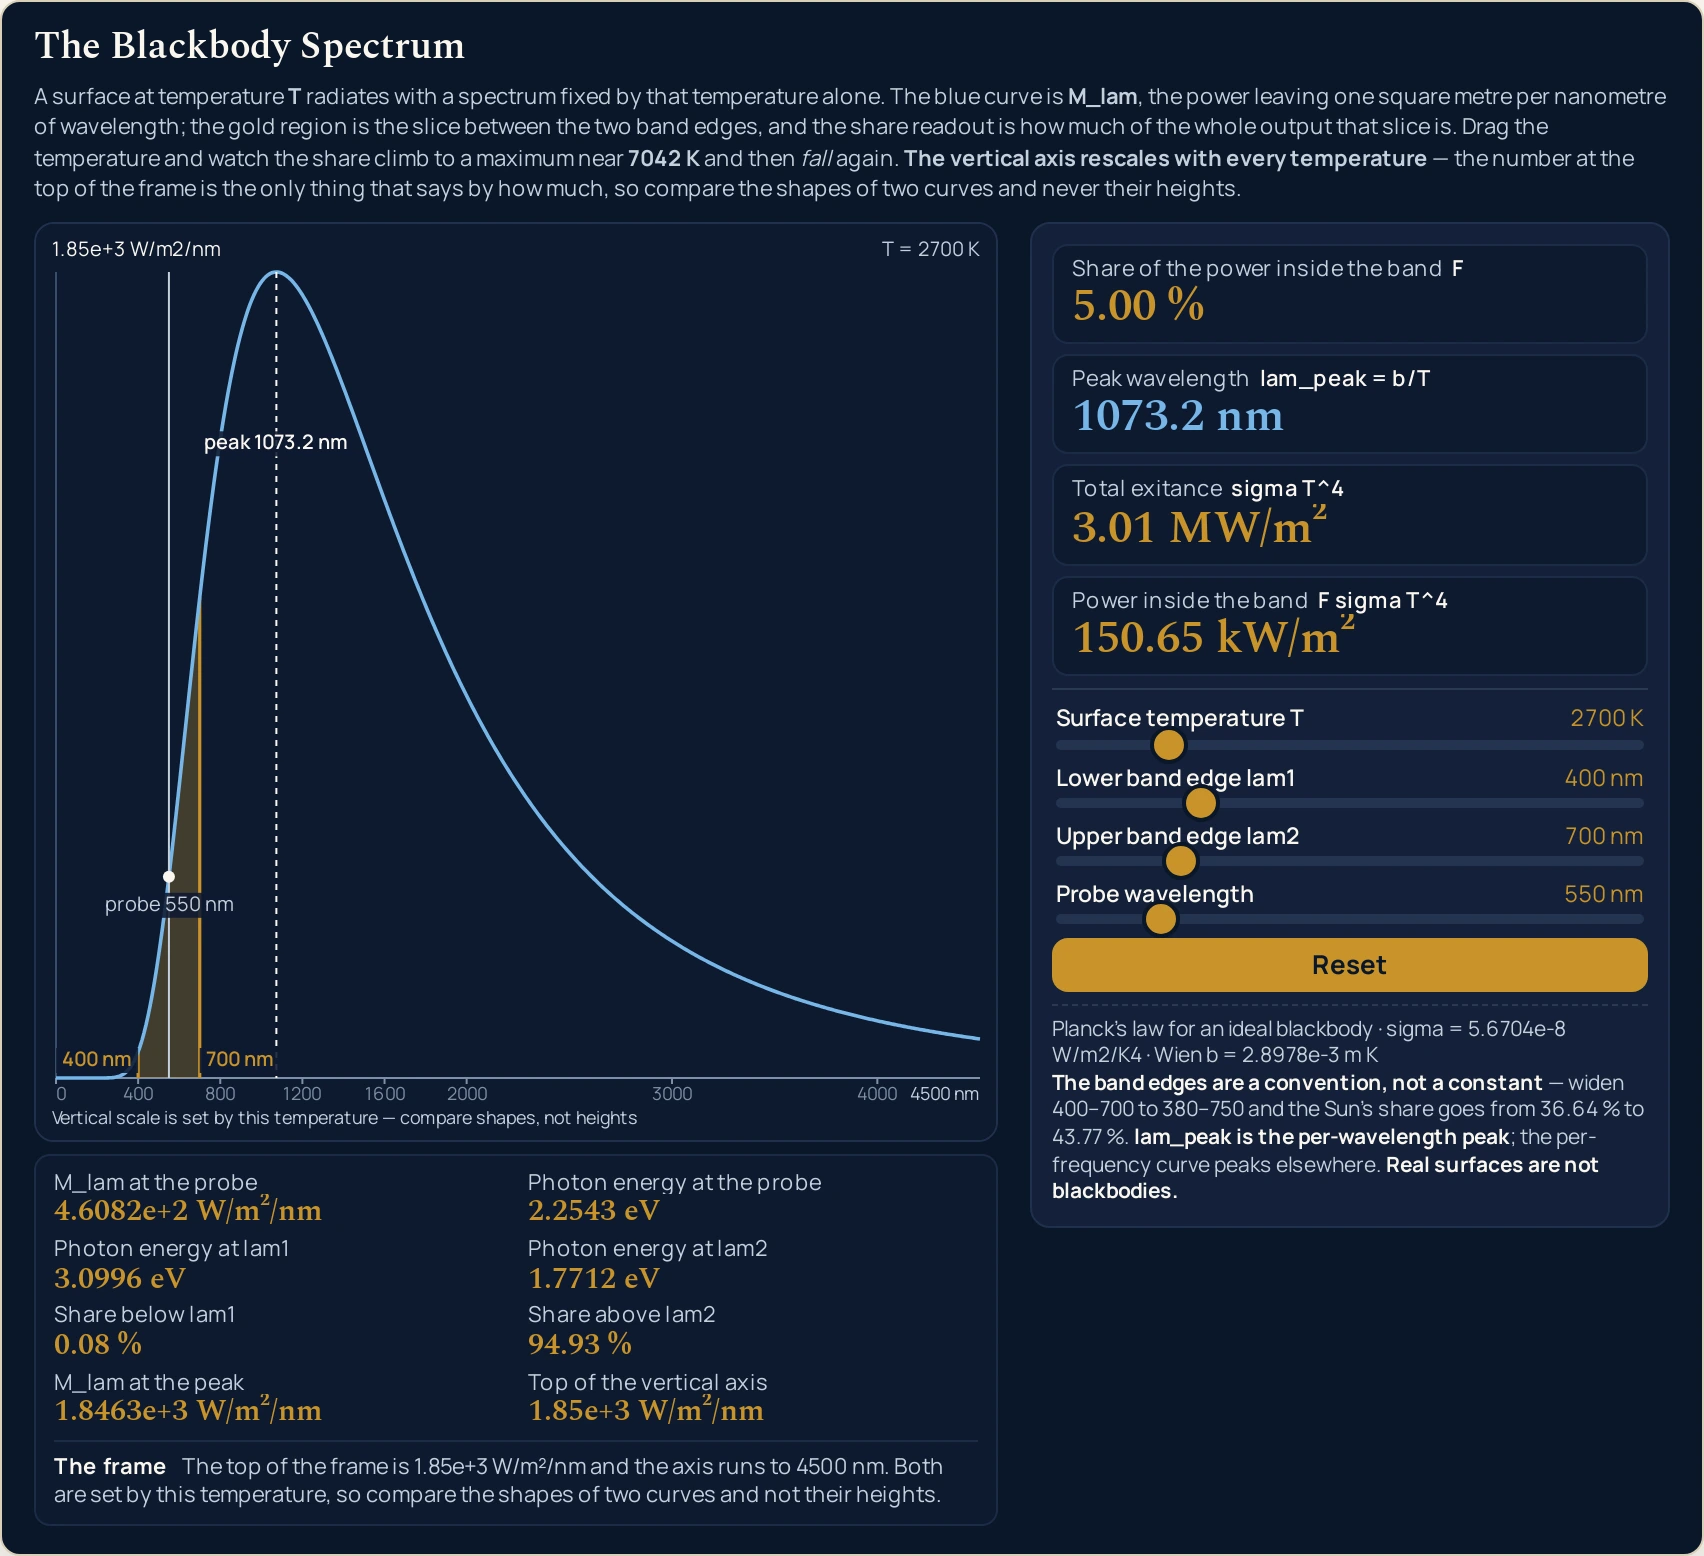
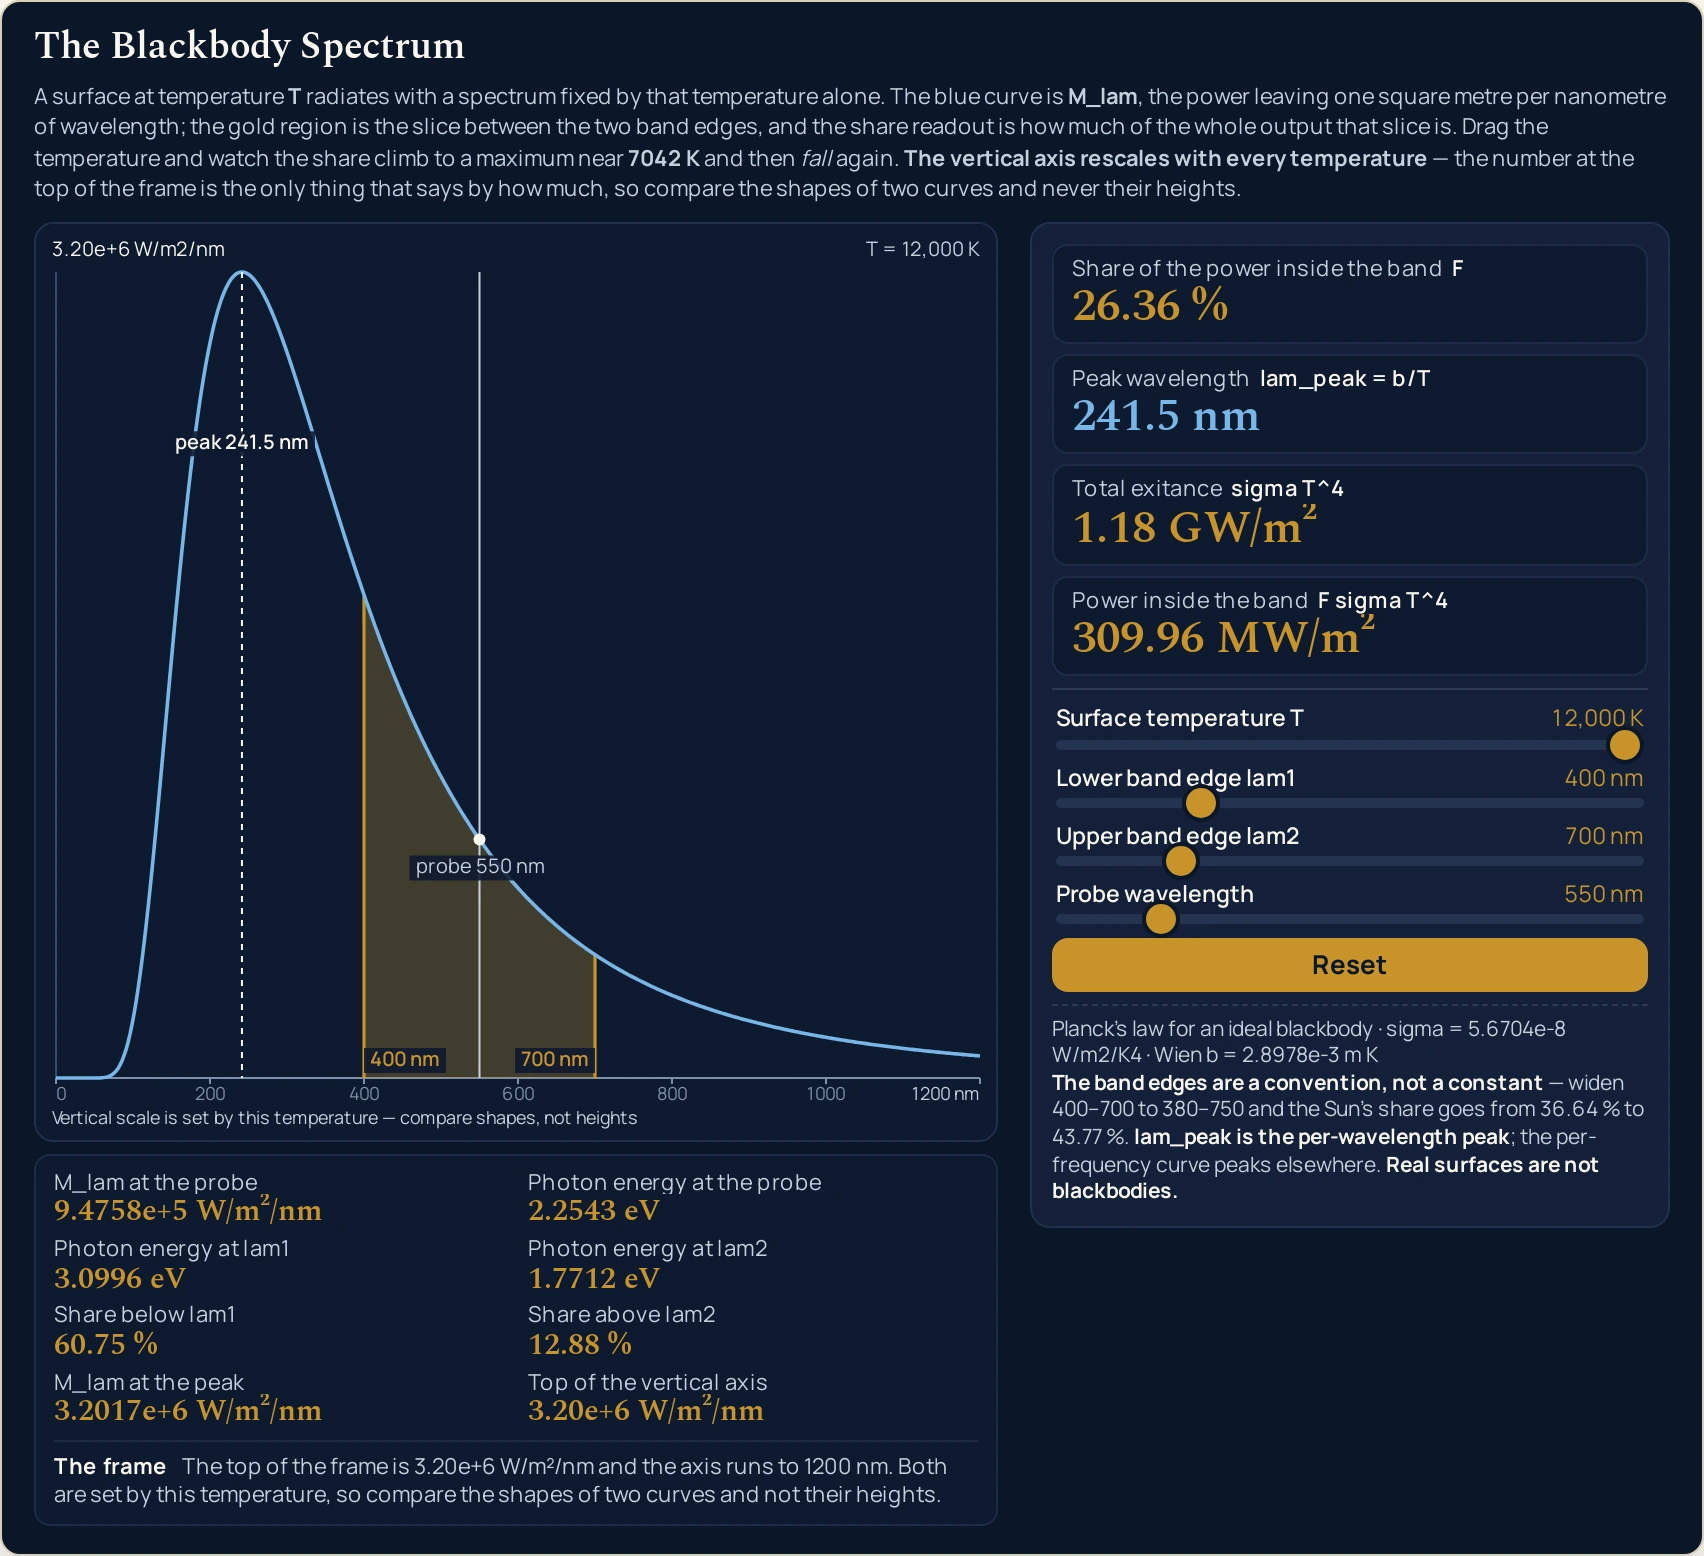
- Watch the frame move, not just the curve. Both axes are rebuilt from the temperature. At 2700 K the horizontal axis runs to 4500 nm and the top of the frame is 1.85e+3 W/m²/nm; at 12,000 K they are 1200 nm and 3.20e+6 W/m²/nm.
The share card and the total exitance card are the pair to watch together. One says where the power goes and the other says how much there is, and between 2700 K and 12,000 K they move in different directions: the share ends lower than it started while the total has climbed from 3.01 MW/m² to 1.18 GW/m². Neither of them is an efficiency, and multiplying one comparison by the other answers no question anybody asked.
Where the 400–700 nm figure comes from in the first place is a different question, and the guide to the electromagnetic spectrum sets out the bands and where the visible one sits among them. This lab starts one step later, from a surface at a temperature, and never asks what colour a wavelength looks.
Worked example: change one thing at a time
Every row below is one of the seven preset buttons, and every cell is a string the running lab printed there. Rows 1 to 6 hold the band at 400–700 nm and move only the temperature slider; row 7 puts the temperature back to 5772 K and moves the two edges instead. Where a cell and the lab ever part company, believe the lab.
| Preset | Sliders, as the panel reads them | Share inside the band | Peak wavelength | Total exitance | Power inside the band |
|---|---|---|---|---|---|
| Sunlight | 5772 K · 400 nm · 700 nm · 550 nm | 36.64 % | 502.0 nm | 62.94 MW/m² | 23.06 MW/m² |
| Filament bulb | 2700 K · 400 nm · 700 nm · 550 nm | 5.00 % | 1073.2 nm | 3.01 MW/m² | 150.65 kW/m² |
| Halogen lamp | 3000 K · 400 nm · 700 nm · 550 nm | 8.09 % | 965.9 nm | 4.59 MW/m² | 371.66 kW/m² |
| Daylight lamp | 6500 K · 400 nm · 700 nm · 550 nm | 38.87 % | 445.8 nm | 101.22 MW/m² | 39.35 MW/m² |
| The best temperature there is | 7042 K · 400 nm · 700 nm · 411 nm | 39.30 % | 411.5 nm | 139.44 MW/m² | 54.80 MW/m² |
| A very hot surface | 12,000 K · 400 nm · 700 nm · 550 nm | 26.36 % | 241.5 nm | 1.18 GW/m² | 309.96 MW/m² |
| The wider band | 5772 K · 380 nm · 750 nm · 550 nm | 43.77 % | 502.0 nm | 62.94 MW/m² | 27.55 MW/m² |
Read the share column down and then back up. It rises 5.00, 8.09, 36.64, 38.87, 39.30 and then drops to 26.36 %, which is the one result this lab exists to make visible. Nothing has gone wrong at the bottom: the total exitance column has climbed the whole way, from 3.01 MW/m² to 1.18 GW/m², while the share turned over near the top.
The peak wavelength column explains the turn. At 2700 K the cream tick stands at 1073.2 nm, far to the right of the gold region, and only the leading edge of the curve reaches it. By 12,000 K the tick has swept through the band and out the other side to 241.5 nm, and the region is now catching the curve’s steep left flank on the way down. Between those two the tick crosses the band, and that crossing is where the share peaks.
Row 7 is the one nobody expects. Neither the surface nor its temperature has changed — the peak, the total exitance and the axis maximum are identical to row 1 — and yet the headline moves from 36.64 % to 43.77 % because the gold region has been widened by 20 nm at one end and 50 nm at the other. A percentage quoted without its two edges is not a fact about anything.
| Preset | Share below the lower edge | Share above the upper edge | Photon energy, lower edge | Photon energy, upper edge | Top of the vertical axis |
|---|---|---|---|---|---|
| Sunlight | 12.18 % | 51.18 % | 3.0996 eV | 1.7712 eV | 8.24e+4 W/m²/nm |
| Filament bulb | 0.08 % | 94.93 % | 3.0996 eV | 1.7712 eV | 1.85e+3 W/m²/nm |
| Halogen lamp | 0.21 % | 91.69 % | 3.0996 eV | 1.7712 eV | 3.13e+3 W/m²/nm |
| Daylight lamp | 18.31 % | 42.81 % | 3.0996 eV | 1.7712 eV | 1.49e+5 W/m²/nm |
| The best temperature there is | 23.17 % | 37.53 % | 3.0996 eV | 1.7712 eV | 2.23e+5 W/m²/nm |
| A very hot surface | 60.75 % | 12.88 % | 3.0996 eV | 1.7712 eV | 3.20e+6 W/m²/nm |
| The wider band | 9.97 % | 46.26 % | 3.2627 eV | 1.6531 eV | 8.24e+4 W/m²/nm |
The first two columns say where the missing power went. On the filament case almost all of it, 94.93 %, is above 700 nm; on the hottest case 60.75 % has crossed to the other side and sits below 400 nm. Add either row to its headline share and you get 100 %, but that is a definition restated rather than a check on anything: the three cells are a partition of one spectrum by construction.
The two photon-energy columns move only on the last row, because they belong to the edges rather than to the surface. Widening the band to 380–750 nm takes them from 3.0996 and 1.7712 eV to 3.2627 and 1.6531 eV. If you would rather convert a wavelength on its own, the photon energy calculator does it in either direction, and the photon energy guide works through the relation.
The last column is the one this page keeps coming back to. Across those seven rows the top of the frame runs from 1.85e+3 to 3.20e+6 W/m²/nm, a spread of more than three decades, while every one of those curves is drawn to the same height on the canvas. That column, and not the picture, is where the magnitude lives.
Formula and symbol reference
The lab works from three relations and nothing else. The curve is M_lam(lam,T) = 2 pi h c^2 / lam^5 / (exp(hc/(lam k T)) - 1); its peak is at lam_peak = b/T; and its area over all wavelengths is M_total = sigma T^4. The headline share is the area between the two edges divided by that total, and the two share cells are the same quantity taken outside the edges.
One thing in that list is easy to misread. M_lam here is the hemispherical spectral exitance, the power leaving one square metre per nanometre of wavelength, and not the radiance per unit solid angle; the two differ by a factor of pi. The form used is the one whose integral over all wavelengths is exactly the total exitance card, which is what lets the share be a share.
| Symbol | Meaning | SI unit | In this lab |
|---|---|---|---|
| T | Absolute temperature of the radiating surface, set by Surface temperature T. It is the only thing about an ideal radiator that the spectrum depends on | kelvin, K | 800 to 12000 in steps of 1, printed with a separator from five digits up: “5772 K” after Reset, “12,000 K” at the top stop. |
| lam1 | Lower edge of the band being counted, set by Lower band edge lam1. It is a choice you make, never a constant of nature | nanometre, nm | 100 to 1400 in steps of 1: “400 nm” after Reset and “380 nm” on The wider band. Dragged past the upper edge it is pushed back to 1 nm below it. |
| lam2 | Upper edge of the band, set by Upper band edge lam2. Moving this one alone is the cheapest way to change the headline share | nanometre, nm | 150 to 3000 in steps of 1: “700 nm” after Reset, “750 nm” on The wider band, and 3000 nm at the top stop. |
| probe | Wavelength at which the thin cream line reads the curve, set by Probe wavelength. It changes two cells and touches nothing else | nanometre, nm | 100 to 3000 in steps of 1: “550 nm” after Reset and “411 nm” on The best temperature there is. |
| F | Share of the surface’s whole radiated power that falls between the two edges, printed by the Share of the power inside the band card | dimensionless, shown as a percentage | two decimals throughout: “36.64 %” at the default, “39.30 %” at its highest, and “0.00 %” at 1000 K where the value is real but smaller than the format can show. |
| lam_peak | Wavelength at which the per-wavelength curve is highest, printed by the Peak wavelength card and marked on the canvas by the cream tick | nanometre, nm | one decimal: “502.0 nm” at 5772 K, “1073.2 nm” at 2700 K, “241.5 nm” at 12,000 K and “3622.2 nm” at the bottom stop of the temperature slider. |
| M_total | Everything the surface radiates, over every wavelength, printed by the Total exitance card | watt per square metre, W/m² | two decimals with an engineering prefix chosen after rounding: “23.23 kW/m²” at 800 K, “62.94 MW/m²” at 5772 K, “1.18 GW/m²” at 12,000 K. |
| band power | The part of that total lying inside the band, printed by the Power inside the band card | watt per square metre, W/m² | “23.06 MW/m²” at the default and “150.65 kW/m²” on the filament case. Below one watt the prefix ladder stops rather than inventing a smaller one: “4.75e-4 W/m²” at 800 K. |
| M_lam | Height of the curve itself — power per square metre per nanometre of wavelength — printed by the M_lam at the probe and M_lam at the peak cells | watt per square metre per nanometre | four significant figures in exponential form: “8.0849e+4 W/m²/nm” at 550 nm and “8.2434e+4 W/m²/nm” at the peak, both at 5772 K. |
| E | Photon energy at one wavelength, printed by the Photon energy at the probe, Photon energy at lam1 and Photon energy at lam2 cells | electronvolt, eV | four significant figures: “3.0996 eV” at 400 nm and “1.7712 eV” at 700 nm. The slider ends reach “12.3984 eV” at 100 nm and “0.4133 eV” at 3000 nm. |
| axis maximum | The number at the top of the drawn frame, printed by the Top of the vertical axis cell and repeated on the canvas itself | watt per square metre per nanometre | two decimals in exponential form, and it is always the peak curve height: from “4.22e+0 W/m²/nm” at 800 K to “3.20e+6 W/m²/nm” at 12,000 K. |
Two rows there carry a formatting rule rather than a physical one. The two power cards switch prefix at a rounded thousand, so 999.996 W/m² prints as 1.00 kW/m² and never as 1000.00 W/m²; below one watt the ladder simply stops, which is why 800 K gives 4.75e-4 W/m² rather than a milliwatt prefix. Every other quantity has one fixed decimal count and no branch at all, so a screenshot taken today reproduces exactly.
The physics: a lopsided curve inside a frame that keeps moving
Two things on this canvas are doing the work, and only one of them is the curve. The curve is lopsided: it climbs almost vertically on the short-wavelength side and falls away over thousands of nanometres on the long side, which you can see at a glance on the filament case where the gold region is a sliver on the steep flank and the whole tail lies to the right of it. The frame around it is rebuilt from the temperature on every update, which is the part that can mislead.
The asymmetry is why the obvious guess about the best temperature is wrong. Set the temperature to 5269 K and the Peak wavelength card reads 550.0 nm, exactly halfway between the two edges, with the cream tick standing in the middle of the gold region — and the share reads only 33.71 %. Load The best temperature there is instead and the tick jumps to 411.5 nm, hard against the left-hand edge, while the share climbs to 39.30 %.
Centring the peak looks fair and is not, because the two sides of the curve are not the same shape. A peak in the middle throws the long slow tail out past the upper edge where it is not counted, while pushing the peak towards the lower edge loses only a little off the steep side and drags that tail inside the band. the full guide to blackbody radiation works that trade through with the arithmetic beside it.
Now the frame. The vertical axis is set to the peak curve height at whatever temperature is loaded, so the apex always touches the top and the number printed there is a value the drawing genuinely reaches. That is honest about the shape and silent about the size: at 2700 K the top of the frame is 1.85e+3 W/m²/nm and at 12,000 K it is 3.20e+6, yet both curves are drawn the same 403.0 px tall. That peak height goes as the fifth power of the temperature, so the ratio between those two frames is (12000/2700)^5 = 1,734, which is not what dividing the two rounded figures above would give you.
The horizontal axis moves too, and rather more visibly. It runs to four times the peak wavelength, clamped between 1200 and 6000 nm and rounded to a tidy tick, and it is raised further if it would otherwise clip the gold region — so the shaded band is never cut off at the right-hand edge. Across the seven presets it takes six different values, from 1200 nm on the hottest to 4500 nm on the filament.
That is why the caption along the bottom of the canvas says what it says. It reads Vertical scale is set by this temperature — compare shapes, not heights, and it is assembled from the lines actually painted rather than stored as a constant, so a caption that failed to fit cannot be reported as though it were on the screen. The strip headed The frame under the canvas repeats both live numbers in prose.
Where the blackbody radiation simulator breaks down
The lab solves its own model exactly, so nothing on the screen ever fails. Everything below is a limit of that model, of the figures you feed it, or of what the drawing can carry, and each item says what this lab does about it.
- Curve heights cannot be compared between two temperatures
- The vertical axis is rebuilt at every update, so the apex always touches the top of the frame whatever the temperature. That keeps a 2700 K curve visible beside a 12,000 K one and makes their drawn heights meaningless against each other. Take the magnitude from the Top of the vertical axis cell or from the two power cards; take the shape from the canvas.
- The horizontal axis moves as well, and by more than it looks
- The frame runs to four times the peak wavelength rather than to a fixed wavelength, so the gold region occupies a different fraction of the picture at every temperature even when its two edges have not moved. On the filament case the band covers a narrow strip of a 4500 nm axis; on the hottest case the same band covers a quarter of a 1200 nm one. Read the tick labels before reading the width.
- A card reading 0.00 % is not a card reading zero
- The three share readouts carry two decimals, so anything under half a hundredth prints as 0.00 %. At 1000 K the share between 400 and 700 nm does exactly that, while the Power inside the band card beside it reads 1.04e-1 W/m² — a small number with real power behind it. The right sentence is that the share is under a thousandth of one per cent, never that it is nothing.
- Below one watt the prefix ladder stops rather than inventing a smaller one
- The two power cards step through kilowatts, megawatts and gigawatts, and the prefix is chosen from the figure after it has been rounded, so 999.996 W/m² prints as 1.00 kW/m². Going the other way there is no milli or micro rung: at 800 K the band card prints 4.75e-4 W/m² in exponential form. That is a display decision, not a limit on the model.
- The peak marker and the probe line are dropped by a pixel test
- The peak tick and its label are skipped whenever the canvas is narrower than 380 CSS pixels, and whenever the label would come within 14 pixels of a band edge label; the probe goes when its own label cannot be placed or when it falls outside the frame. Both cards go on printing their figures regardless. A dropped label always takes its line with it, so the canvas never carries a guide nobody can name.
- Both edges are sliders because neither of them is fixed
- Where the visible slice starts and stops is a stated convention, and 400–700 nm is what this site states. Nothing measures it, which is why the lab hands you both edges instead of printing them as furniture: drag them out to 380 and 750 nm and the 5772 K surface goes from 36.64 % to 43.77 % without the surface changing at all. No percentage read off this page means anything without the pair of edges beside it.
- The cream tick belongs to the curve on screen and to no other
- What it marks is the highest point of power per unit wavelength, which is the only quantity this canvas plots. Redraw the identical physics against frequency and the highest point lands somewhere else on the spectrum, and no conversion between the two variables will carry one onto the other, because the change of variable does not stretch the axis evenly. Read the tick as the peak of the per-wavelength curve, then, and never as the place where a 5772 K surface simply peaks.
- There is no emissivity slider, and that is deliberate
- Every curve on this canvas is an ideal radiator’s. Put a real material in its place and each wavelength comes out weakened by a factor of its own, so the measured curve is a different shape rather than a shorter copy of this one. A single flat factor across the whole spectrum would divide straight out of the share and leave the drawing untouched, which would hide the one thing worth knowing about a real emitter. Where the total is the question, the Stefan-Boltzmann calculator carries that term and the Stefan-Boltzmann lab draws the fourth-power law.
- The three shares add to 100 % because they are defined that way
- The headline share and the two cells either side of it are a partition of one spectrum, so watching them total 100.00 % confirms nothing about the lab. The same goes for the power inside the band being the share times the total, which is the definition of the share rearranged. Nothing on this page is checked by any other number on this page.
- The two edges cannot cross, and the lab moves one rather than refusing
- If a drag would leave the two edges level or the wrong way round, the edge you are not dragging is pushed 1 nm clear and written back into both its slider and its label, so no impossible band ever reaches a readout. Drag the upper edge down to its 150 nm minimum and the lower edge is carried down to 149 nm with it, where the share is 0.00 % and the band card reads 287.58 W/m². That is a real 1 nm band, not an error state.
- Nothing under the gold region is coloured
- Mapping a wavelength onto a screen colour needs conventions this lab has not adopted, and a rainbow there would say the page is about colour when it is about power. The shading marks which slice is being counted and claims nothing else. What a prism does with that slice is the dispersion of light lab, and the bands either side of it are the electromagnetic spectrum lab.
- Nothing here has been measured
- The temperature and both band edges are figures you choose, and no reading describes a particular lamp, star, filament or instrument; the preset names are shorthand for the temperatures beside them. 5772 K is the IAU nominal solar effective temperature rather than a reading taken from the Sun, and every solar figure here is top-of-atmosphere — sunlight at the ground has already lost most of its ultraviolet. Verify anything you intend to rely on against your own data first.
Where the blackbody spectrum is actually used
- Separating a share from a quantity, on one screen
- The commonest error with thermal radiation is treating “more of it is visible” and “more of it comes out” as one statement. Here they are two cards that plainly disagree: between the filament case and the hottest case the share ends lower than it started while the total exitance has gone from 3.01 MW/m² to 1.18 GW/m². Neither figure is lumens per watt and neither is an efficiency.
- Choosing the window a non-contact thermometer looks through
- An instrument that infers temperature from brightness sees only a slice of the spectrum, and how steeply that slice brightens with temperature is what sets its sensitivity. Set the two edges to the instrument’s window, step the temperature through the range you care about and watch the Power inside the band card rather than the share. The ratio of two of those readings is the signal you would actually get.
- Finding where a threshold device stops responding
- Anything with an energy threshold responds only to wavelengths below some edge. Park the probe on that wavelength and the Photon energy at the probe cell gives it in electronvolts on the spot; set the upper band edge to the same place and the share card gives the fraction of the incoming power that is usable at all. Both readings come from one setting of the sliders.
- Seeing why two surfaces at different temperatures barely overlap
- Load a surface near 5772 K, note where the frame puts the curve, then drop the temperature to a few hundred kelvin above room temperature and watch the whole picture slide right while the axis maximum collapses. Absorbing across one of those bands and re-radiating across the other is the whole idea behind a wavelength-selective coating, and the separation is visible before any arithmetic is done.
- Reading somebody else’s spectrum plot without being fooled
- Published Planck curves are very often normalised, and two of them side by side can be drawn to the same height on purpose. This lab does the same thing and says so in three places, which makes it a fair demonstration of the habit. Once you have watched the frame move here, the first question to ask of any such plot is what its vertical axis was set from.
- Setting a question that cannot be answered by guessing
- “Which temperature puts the most visible light into 400 to 700 nm?” has a wrong answer that almost everyone reaches first, and the sliders settle it in about ten seconds. The follow-up is better still: ask for two different temperatures that give the same share, and the shape of the temperature sweep does the explaining. The blackbody radiation calculator will not solve backwards for temperature for exactly that reason.
Where to go next
For the argument in full, with the worked problems, the three-way split table and the diagrams that go with them, read Blackbody Radiation: Why 39% Is the Best Light You Get. If you would rather type figures than drag them, the blackbody radiation calculator takes the same three inputs and also runs the question backwards, returning the band edge that captures a share you name; it prints six significant figures where this lab prints two decimals, so its 36.6383 % and this lab’s 36.64 % are the same number.
The two ends of this calculation have tools of their own. The Stefan-Boltzmann law owns the total exitance card, with its calculator and its simulator beside it, and the Wien law calculator returns the peak wavelength card on its own for any temperature.
Nearby, the electromagnetic spectrum guide places the visible slice among the other bands with its lab, the guide to dispersion of light and the dispersion lab take that slice apart, and the wavelength formula and units guide covers nanometres and the rest of the scale. The photon energy guide and its calculator handle the edge cells, and the guide to absolute zero with its lab and its calculator covers the other end of the temperature slider. The rest is in the library of physics simulations and on the blog, and the site search will find a topic by name.
Frequently asked questions
What does the blackbody radiation simulator draw?
It draws one curve: the power an ideal radiator sends out per square metre per nanometre of wavelength, at the temperature you set. The slice between the two band edges is shaded gold, a cream tick marks the Wien peak, and a thin cream line reads the curve at a probe wavelength you choose. Four cards and eight cells put that drawing into figures.
Where does the peak wavelength card go as the temperature rises?
Steadily to shorter wavelengths, because the peak of the per-wavelength curve sits at lam_peak = b/T. At 800 K, the bottom stop of the temperature slider, the Peak wavelength card reads 3622.2 nm; at 2700 K it reads 1073.2 nm, at 5772 K 502.0 nm, and at 12,000 K 241.5 nm. The cream tick follows that card across the canvas, entering the gold region and leaving it again.
Does moving the probe change the share inside the band?
No. The probe reads the curve and nothing else. Take it from 550 nm to 1000 nm at 5772 K and M_lam at the probe falls from 8.0849e+4 to 3.3729e+4 W/m²/nm, while the share stays 36.64 %, the peak stays 502.0 nm and neither power card moves. Only the temperature and the two band edges touch those four.
Can I park the probe on the peak wavelength?
Yes, and the preset called The best temperature there is does it for you: the probe sits at 411 nm against a Peak wavelength card of 411.5 nm. There M_lam at the probe and M_lam at the peak both read 2.2282e+5 W/m²/nm, because half a nanometre from the apex the curve has not dropped by enough to show in the four figures those cells carry. Photon energy at the probe reads 3.0166 eV.
Can I shade a band that is not visible light?
Yes, anywhere within the ranges of the two edge sliders. Lower band edge lam1 runs from 100 to 1400 nm and Upper band edge lam2 from 150 to 3000 nm, so any window with its ends inside those can be shaded and the share card reports that window instead. The two photon-energy cells belong to the edges rather than the surface, reaching 12.3984 eV at 100 nm and 0.4133 eV at 3000 nm.
How high can the share inside the visible band go?
For a 400 to 700 nm band it reaches 39.30 % and the temperature slider gets there at 7042 K. Step past that and the share falls back: 9000 K reads 35.82 % and 12,000 K reads 26.36 %, because by then most of the curve has slid left of the lower edge, where the Share below the lower edge cell climbs to 60.75 %.
Is the Top of the vertical axis cell the same number as M_lam at the peak?
Yes, at two precisions. The top of the frame is set to the peak curve height, so the two cells carry one quantity: M_lam at the peak prints four significant figures and Top of the vertical axis two decimals in exponential form. The opening state reads 8.2434e+4 beside 8.24e+4 W/m²/nm, and the hottest preset 3.2017e+6 beside 3.20e+6. Neither cell confirms the other.
References & formula source
- Planck's law in the hemispherical spectral exitance form, the power leaving unit area per unit wavelength, rather than the radiance form per unit solid angle. The two differ by a factor of pi, and it is the form whose integral over all wavelengths is the Stefan-Boltzmann total. Halliday, Resnick and Walker, Fundamentals of Physics, the chapter on photons and blackbody radiation, sets out the same curve.
- The band fraction is evaluated as the blackbody fractional function, the share of the total lying below one wavelength, taken at each edge and subtracted. Siegel and Howell, Thermal Radiation Heat Transfer, is the standard treatment of that function and of the series behind it.
- Only four constants are typed into the simulation: the Planck constant, the speed of light, the Boltzmann constant and the electronvolt, all exact by the 2019 SI definitions. The Stefan-Boltzmann constant, the Wien displacement constant and the product hc are derived from those four rather than remembered, and the panel prints the two it uses.
- 5772 K is the IAU 2015 nominal solar effective temperature, a defined value rather than a reading taken from the Sun, and every solar figure in this lab is top-of-atmosphere. Sunlight at the ground is a different spectrum, because the atmosphere has already removed most of the ultraviolet and cut chunks out of the infrared.
- Every figure quoted on this page is a string this simulation printed for the slider positions named beside it, read back out of the running lab rather than worked out by hand. Where a figure here and the lab ever part company, believe the lab.
- Nothing here has been measured. The temperature and both band edges are figures you choose, the surface is an ideal radiator rather than any real material, and no reading describes a particular lamp, star or instrument. Verify anything you intend to rely on against your own data, with the two band edges stated, before you quote it.
- Further reading: Black-body radiation — Wikipedia