A blackbody is a surface whose radiated spectrum is fixed by its temperature alone, and Planck’s law Mλ = 2πhc2 / λ5 / (exp(hc/λkT) - 1) is the shape of that spectrum. This free blackbody radiation calculator returns the part no other tool here can: the share of the total power that lands between two wavelengths. Point the Solve for menu the other way and it finds the band edge that captures a share you name. Beside the answer it prints the Wien peak, the total exitance, the power inside the band, the photon energy at each edge and the shares lying below and above it.
Load a real case
Each button puts the Solve for menu on the unknown that case is asking about, sets every unit menu it names, and fills the remaining boxes. Whatever the widget then works out is read back into the line underneath, so nothing there is stored text. Run Sunlight and then The best there is to see how little room there is above the Sun, then run Filament bulb to see how far below it a lamp sits.
Pick a case above, or type your own numbers.
What Is the Blackbody Radiation Calculator?
The blackbody radiation calculator is a free online tool for the share of a hot surface total radiated power that lands between two wavelengths. Type the temperature and the two band edges and it integrates Planck law across the band and divides by σT4, returning that share as a percentage together with the Wien peak wavelength, the total exitance, the power inside the band, the photon energy at each edge and the shares lying below and above. Point the Solve for menu at either edge instead and it runs the same relation backwards to find the edge that captures a share you name, declining rather than inventing an answer when the share you asked for is out of reach.
| Symbol | Quantity | Default unit | Also accepts | Example value |
|---|---|---|---|---|
| T | Temperature | K | °C, °F | 5772 |
| lam1 | Lower band edge | nm | µm, m | 400 |
| lam2 | Upper band edge | nm | µm, m | 700 |
| F | Share of total power | % | fraction | 36.64 |
How to use the blackbody radiation calculator
- Choose the unknown. The Solve for menu opens on Share of total power. The other two choices are Lower band edge and Upper band edge, and whichever you pick vanishes from the boxes below.
- Type the temperature. Temperature is the absolute temperature of the radiating surface, in K, °C or °F. It is an input in every mode rather than an occasional answer, and the reason is explained further down.
- Type the two band edges. Lower band edge and Upper band edge mark off the slice you care about, in nm, µm or m. The upper edge has to be larger than the lower one, and the calculator declines rather than swapping them for you.
- Or type the share instead. Point the menu at either edge and a Share of total power box appears, taking % or a plain fraction. The calculator then moves that edge until the band holds exactly what you asked for.
- Read the answer and the chips. The headline carries six significant figures. The chips give the peak wavelength, the total exitance, the power inside the band, the photon energy at each edge and the shares below and above the band.
- Compare the share with the total exitance. The total is everything the surface radiates and the share says how much of it lands where you are looking. On the opening case that is 36.6383 % of 6.2939e+7 W/m2, or 2.3060e+7 W/m2 inside 400 to 700 nm.
- Move the temperature and watch the share turn over. Load Filament bulb, then Sunlight, then The best there is, and the share climbs. Carry on to 12000 K and it falls back to 26.3616 %, which is the single most surprising thing on this page.
- Open Show working. The steps restate the relation, list your figures in the units the arithmetic uses, print the dimensionless variable at each edge and subtract the two fractional functions. In the reverse modes the third line names the ceiling that was checked before any bisection started.
Two tools on this site already own the ends of this calculation and neither can do the middle. The Wien law calculator returns the peak wavelength alone, and the Stefan-Boltzmann calculator returns the total radiated power alone, complete with an emissivity box this page deliberately does not have. The share between two wavelengths needs the shape of the curve as well as its peak and its area, which is what the fractional function on this page supplies.
Where the 400 to 700 nm figure itself comes from is a separate question, and the guide to the electromagnetic spectrum sets out the bands and where the visible one sits among them. This page starts one step later, from a surface at a temperature, and never asks which colour a wavelength looks — that belongs to the guide to dispersion of light, which is also where the prism that separates them out is explained.
Two mistakes account for most wrong answers. The first is entering the band edges the wrong way round, which the calculator declines rather than quietly swapping; the second is reading a share as though it were an efficiency, when the total exitance chip beside it has moved by a far larger factor. A 7042 K surface radiates 46.3 times as much power in total as a 2700 K one while its visible share is only 7.86 times larger, so the two figures are answering different questions.
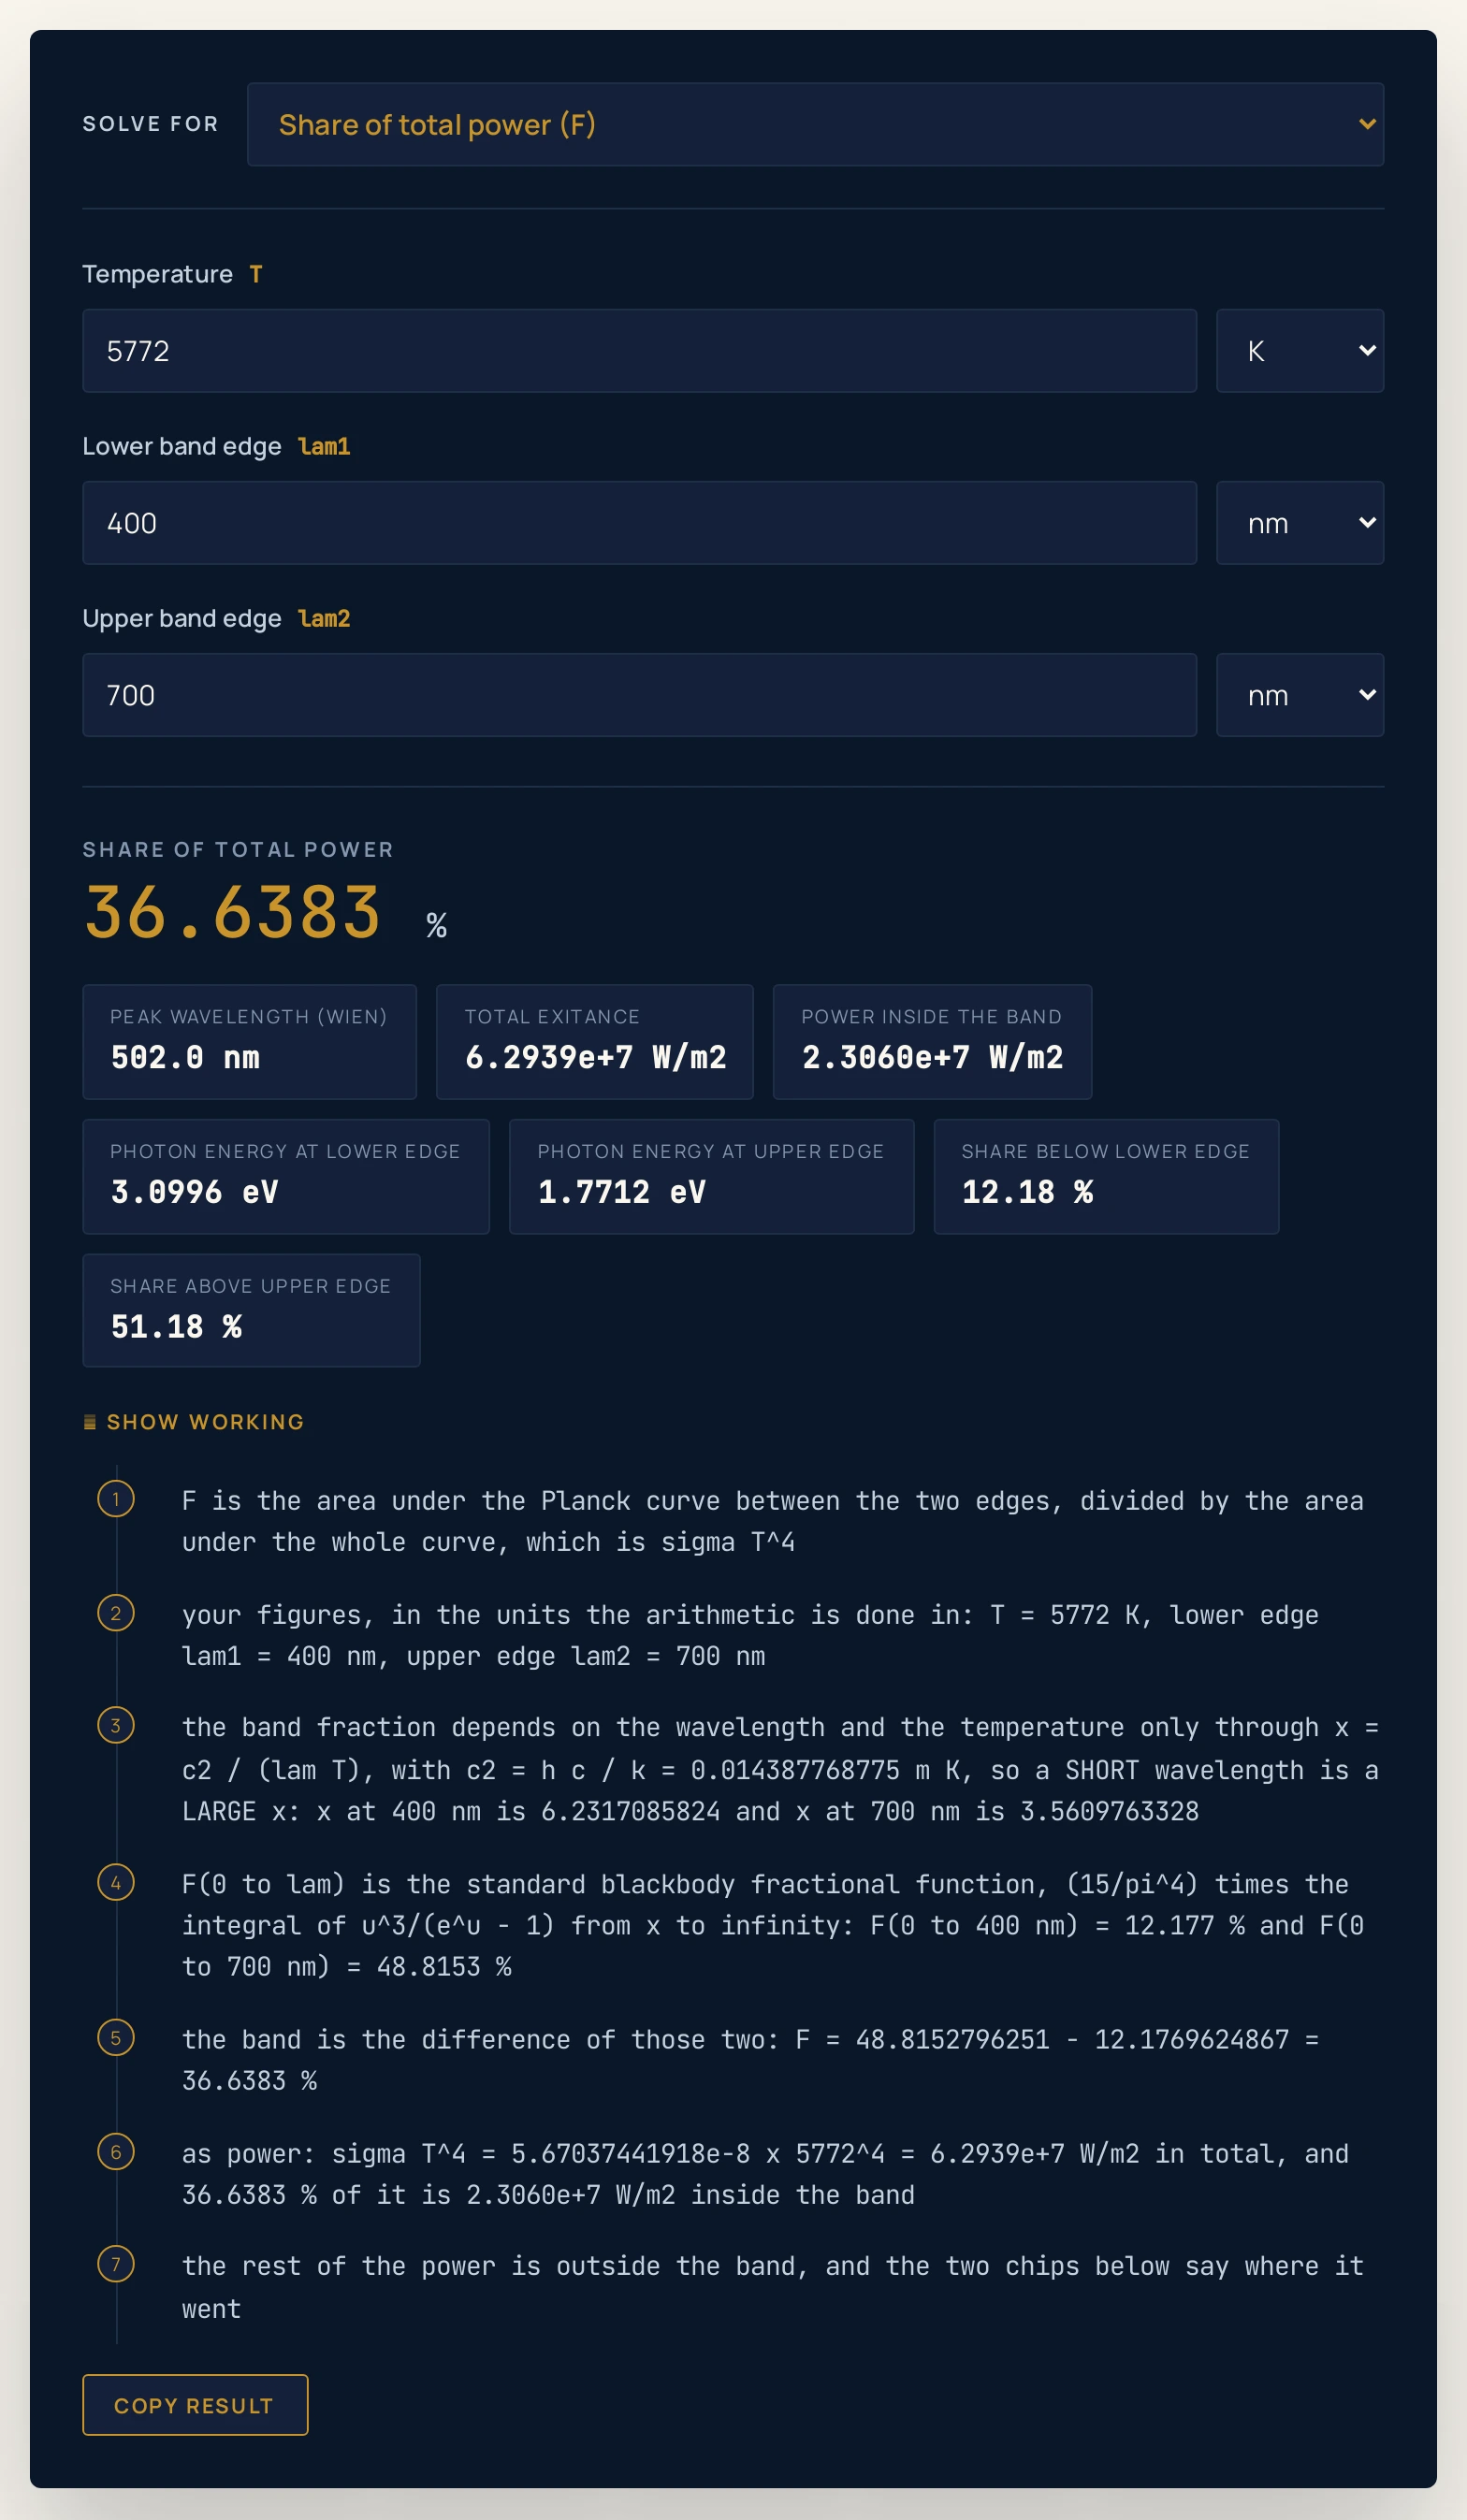
6.2939e+7 W/m2 chip is everything the surface radiates and the 36.6383 % headline is how much of it lands in the visible band — 2.3060e+7 W/m2, with the remaining 12.18 % and 51.18 % falling either side of it.Worked example: change one thing at a time
The table starts at the defaults and moves one thing at a time: the temperature, then the band edges, then which quantity is the unknown, then the unit the figures are typed in, and finally the entries the calculator declines. Every Result, Peak wavelength and Power inside the band cell was read out of the running widget rather than worked out by hand, so where a cell and the tool ever part company, believe the tool.
| Step | Solving for | What you type | Result | Peak wavelength | Power inside the band |
|---|---|---|---|---|---|
| The page as it opens | Share of total power | 5772 K, 400-700 nm | 36.6383 % | 502.0 nm | 2.3060e+7 W/m2 |
| Cool it to a filament lamp | Share of total power | 2700 K, 400-700 nm | 4.99936 % | 1073.2 nm | 1.5065e+5 W/m2 |
| A halogen lamp instead | Share of total power | 3000 K, 400-700 nm | 8.09192 % | 965.9 nm | 3.7166e+5 W/m2 |
| The best temperature there is | Share of total power | 7042 K, 400-700 nm | 39.3021 % | 411.5 nm | 5.4804e+7 W/m2 |
| Hotter still, and it falls back | Share of total power | 12000 K, 400-700 nm | 26.3616 % | 241.5 nm | 3.0996e+8 W/m2 |
| Widen the band instead | Share of total power | 5772 K, 380-750 nm | 43.7747 % | 502.0 nm | 2.7551e+7 W/m2 |
| Half the power | Upper band edge | 5772 K, 400 nm, 50 % | 850.096 nm | 502.0 nm | 3.1469e+7 W/m2 |
| A quarter of a daylight lamp | Upper band edge | 6500 K, 400 nm, 25 % | 576.518 nm | 445.8 nm | 2.5305e+7 W/m2 |
| Reach 45 per cent downwards | Lower band edge | 5772 K, 700 nm, 45 % | 310.089 nm | 502.0 nm | 2.8322e+7 W/m2 |
| Eight per cent of a halogen | Lower band edge | 3000 K, 700 nm, 8 % | 416.191 nm | 965.9 nm | 3.6744e+5 W/m2 |
| Ask for half below 700 nm | Lower band edge | 5772 K, 700 nm, 50 % | no answer | — | — |
| Temperature typed in Celsius | Share of total power | 5498.85 °C, 400-700 nm | 36.6383 % | 502.0 nm | 2.3060e+7 W/m2 |
| Edges typed in micrometres | Share of total power | 5772 K, 0.4-0.7 µm | 36.6383 % | 502.0 nm | 2.3060e+7 W/m2 |
| Share typed as a fraction | Upper band edge | 5772 K, 400 nm, 0.5 fraction | 850.096 nm | 502.0 nm | 3.1469e+7 W/m2 |
| Edges the wrong way round | Share of total power | 5772 K, 700-400 nm | no answer | — | — |
| A dull red glow | Share of total power | 1000 K, 400-700 nm | 0.000183859 % | 2897.8 nm | 1.0425e-1 W/m2 |
Rows 1 to 5 are one band and five temperatures, and they do not go the way the eye expects. From 2700 K to 5772 K the visible share climbs from 4.99936 % to 36.6383 %, and at 7042 K it reaches 39.3021 %, which is the largest figure any temperature can produce for these two edges. Push on to 12000 K and it falls back to 26.3616 %, because by then most of the curve has slid past 400 nm into the ultraviolet.
That turn is the whole reason the Solve for menu has no temperature option. A target such as 30 % sits on both sides of the hump, and the physics contract behind this page locates the two temperatures that produce it: 4818.7 K and 10839.0 K. An inverse solve would have to pick one of them without being told which.
Row 6 changes nothing about the surface and still moves the answer by seven points. The same 5772 K spectrum holds 36.6383 % between 400 and 700 nm and 43.7747 % between 380 and 750 nm, so a percentage quoted without its two edges is not a fact about anything.
Rows 7 to 10 run the same relation backwards. Starting at 400 nm, half of the Sun’s power is captured once the upper edge reaches 850.096 nm, which is well into the infrared; a quarter of a 6500 K daylight lamp needs only 576.518 nm. Rows 9 and 10 move the lower edge instead, and the peak wavelength chip does not budge in either case, because the peak belongs to the temperature and not to the band.
Row 11 is the refusal that matters most, and it is not an input error. At 5772 K everything below 700 nm adds up to 48.8153 % of the power, so no lower edge at all can leave 50 % inside the band. The calculator declines and the third working line prints the ceiling it checked, rather than pinning the edge to zero and returning a plausible number.
Rows 12 to 14 are the unit menus. 5498.85 °C is 5772 K, 0.4 and 0.7 µm are 400 and 700 nm, and a share typed as the fraction 0.5 is the same request as 50 %, so all three reproduce their SI rows exactly.
Rows 15 and 16 are the edges of the domain. Edges typed the wrong way round are declined rather than silently swapped, and a 1000 K surface answers 0.000183859 % — a very small number, but emphatically not zero, which is why the chips there read 0.00 % and the prose does not.
Formula and symbol reference
The calculator uses one spectrum in three arrangements. The curve is Mλ(λ,T) = 2πhc2 / λ5 / (exp(hc/λkT) - 1), its area is σT4, and the share inside a band is the area between the two edges divided by that total. Written as a fractional function it is F(λ1–λ2) = F(0–λ2) - F(0–λ1), where F(0–λ) depends on the wavelength and the temperature only through the product of the two.
That single dependence is worth pausing on, because it is what makes the calculation tractable. Substituting x = c2/(λT) turns the band share into a dimensionless integral in which a short wavelength is a large x, so one curve serves every temperature. The calculator evaluates that integral by its closed-form series when x is at least 2 and by quadrature on the head integral when it is smaller, because the series converges too slowly down there to be trusted.
Only four constants are typed into this page: the Planck constant, the speed of light, the Boltzmann constant and the electronvolt, all of them exact by the 2019 SI definitions. The Stefan-Boltzmann constant, the second radiation constant, the Wien displacement constant and the product hc are derived from those four rather than remembered, so a mistyped digit cannot survive into a readout.
| Symbol | Meaning | SI unit | Values used on this page |
|---|---|---|---|
| T | Absolute temperature of the radiating surface. It fixes the entire spectrum on its own, which is why it is an input in every mode of this calculator and never an answer | kelvin, K | Boxes take K, degrees Celsius or degrees Fahrenheit: 5772 on the opening case, 2700 for a filament lamp, 7042 at the best possible value, 12000 for a very hot surface. |
| lam1 | Lower band edge, the short-wavelength end of the slice you are asking about. Raising it throws away the blue end of the band, so the share falls | nanometre, nm | Boxes take nm, micrometres or metres: 400 throughout the visible cases, 380 on the wider band, 0.4 micrometres in the unit row. |
| lam2 | Upper band edge, the long-wavelength end of the slice. Raising it takes in more of the infrared tail, so the share rises | nanometre, nm | Boxes take nm, micrometres or metres: 700 throughout the visible cases, 750 on the wider band, 0.7 micrometres in the unit row. |
| F | Share of the total radiated power that falls inside the band, between 0 and 1. It is the headline in the forward mode and an input in both reverse modes | dimensionless, shown as a percentage | Boxes take per cent or a plain fraction: 50 to halve the power, 25 on the daylight lamp, 45 reaching downwards, 8 on the halogen case. |
| M_lam | Spectral exitance: the power radiated per unit area per unit wavelength, at one wavelength. It is the curve whose area this page slices, and it is never typed | watt per square metre per nanometre | Computed, never typed. Its integral across the band divided by sigma T^4 is the headline share. |
| lam_peak | Wien peak wavelength, b divided by T, where the per-wavelength curve is tallest. Printed as a chip rather than typed | nanometre, nm | Computed, never typed: 502.0 nm at 5772 K, 1073.2 nm at 2700 K, 965.9 nm at 3000 K, 241.5 nm at 12000 K. |
| sigma | Stefan-Boltzmann constant, derived here from h, c and k rather than typed. Multiplied by T to the fourth it gives the total exitance chip | watt per square metre per kelvin to the fourth | Derived: 5.670374419e-8, which agrees with the published CODATA value. |
The physics: why the best band share is not where you would guess
A blackbody has one property that decides everything it radiates, and that property is its temperature. Raise it and the whole curve grows and slides towards shorter wavelengths at once: the area grows as the fourth power of the temperature and the peak moves as one over it. Those two facts are the Stefan-Boltzmann calculator and the Wien law calculator respectively, and between them they still do not tell you how much power lands in any particular band.
The obvious way to fill a band is to put the peak in the middle of it. For 400 to 700 nm that means a peak at 550 nm, which Wien’s law puts at 5268.7 K, and this calculator says that surface delivers 33.7051 % of its power into the band. It is a reasonable guess and it is beaten by almost six points.
The best temperature is 7042 K, delivering 39.3021 %, and its own peak sits at 411.5 nm — hard against the violet edge rather than in the middle. The reason is that the Planck curve is lopsided. It rises very steeply on the short-wavelength side and falls away slowly on the long side, so a peak in the middle of the band throws the long tail out past 700 nm where it is wasted.
Push the peak towards the violet edge instead and that long tail lands inside the band rather than beyond it. You lose a little off the short end, because the short side is steep and there is not much out there to lose, and you gain a great deal off the long end. That trade is worth 5.6 points, and it is the single result the full article on blackbody radiation is built around.
The Sun lands at 36.6383 % for the same band, which is within 2.7 points of the theoretical best. Nothing is optimising anything here: a star’s effective temperature is set by its mass and its structure, and 5772 K is simply where this one sits. The interesting fact is how flat the top of the curve is, so that a surface 1270 K cooler than the optimum gives up so little.
The same asymmetry explains the filament lamp. At 2700 K the peak is at 1073.2 nm, deep in the infrared, and only the leading edge of the curve reaches into the visible at all, which is why the share collapses to 4.99936 %. That is a statement about temperature rather than about engineering, and no change of material moves it.
Two cautions belong here rather than further down. The share and the total are different quantities that move together: the 7042 K surface has 7.86 times the visible share of the 2700 K one but radiates 46.3 times as much power in total, so neither ratio is a lumens-per-watt claim and nothing here is one. And the peak chip is the peak of the per-wavelength curve specifically, which is not where the per-frequency form of the same spectrum peaks.
The photon-energy chips give the band a second reading. At the edges of the visible band the photons carry 3.0996 eV and 1.7712 eV, so the whole band spans less than a factor of two in photon energy, and the photon energy calculator works that conversion in either direction. It is a useful sanity check whenever a band is being chosen to drive a process with a threshold.
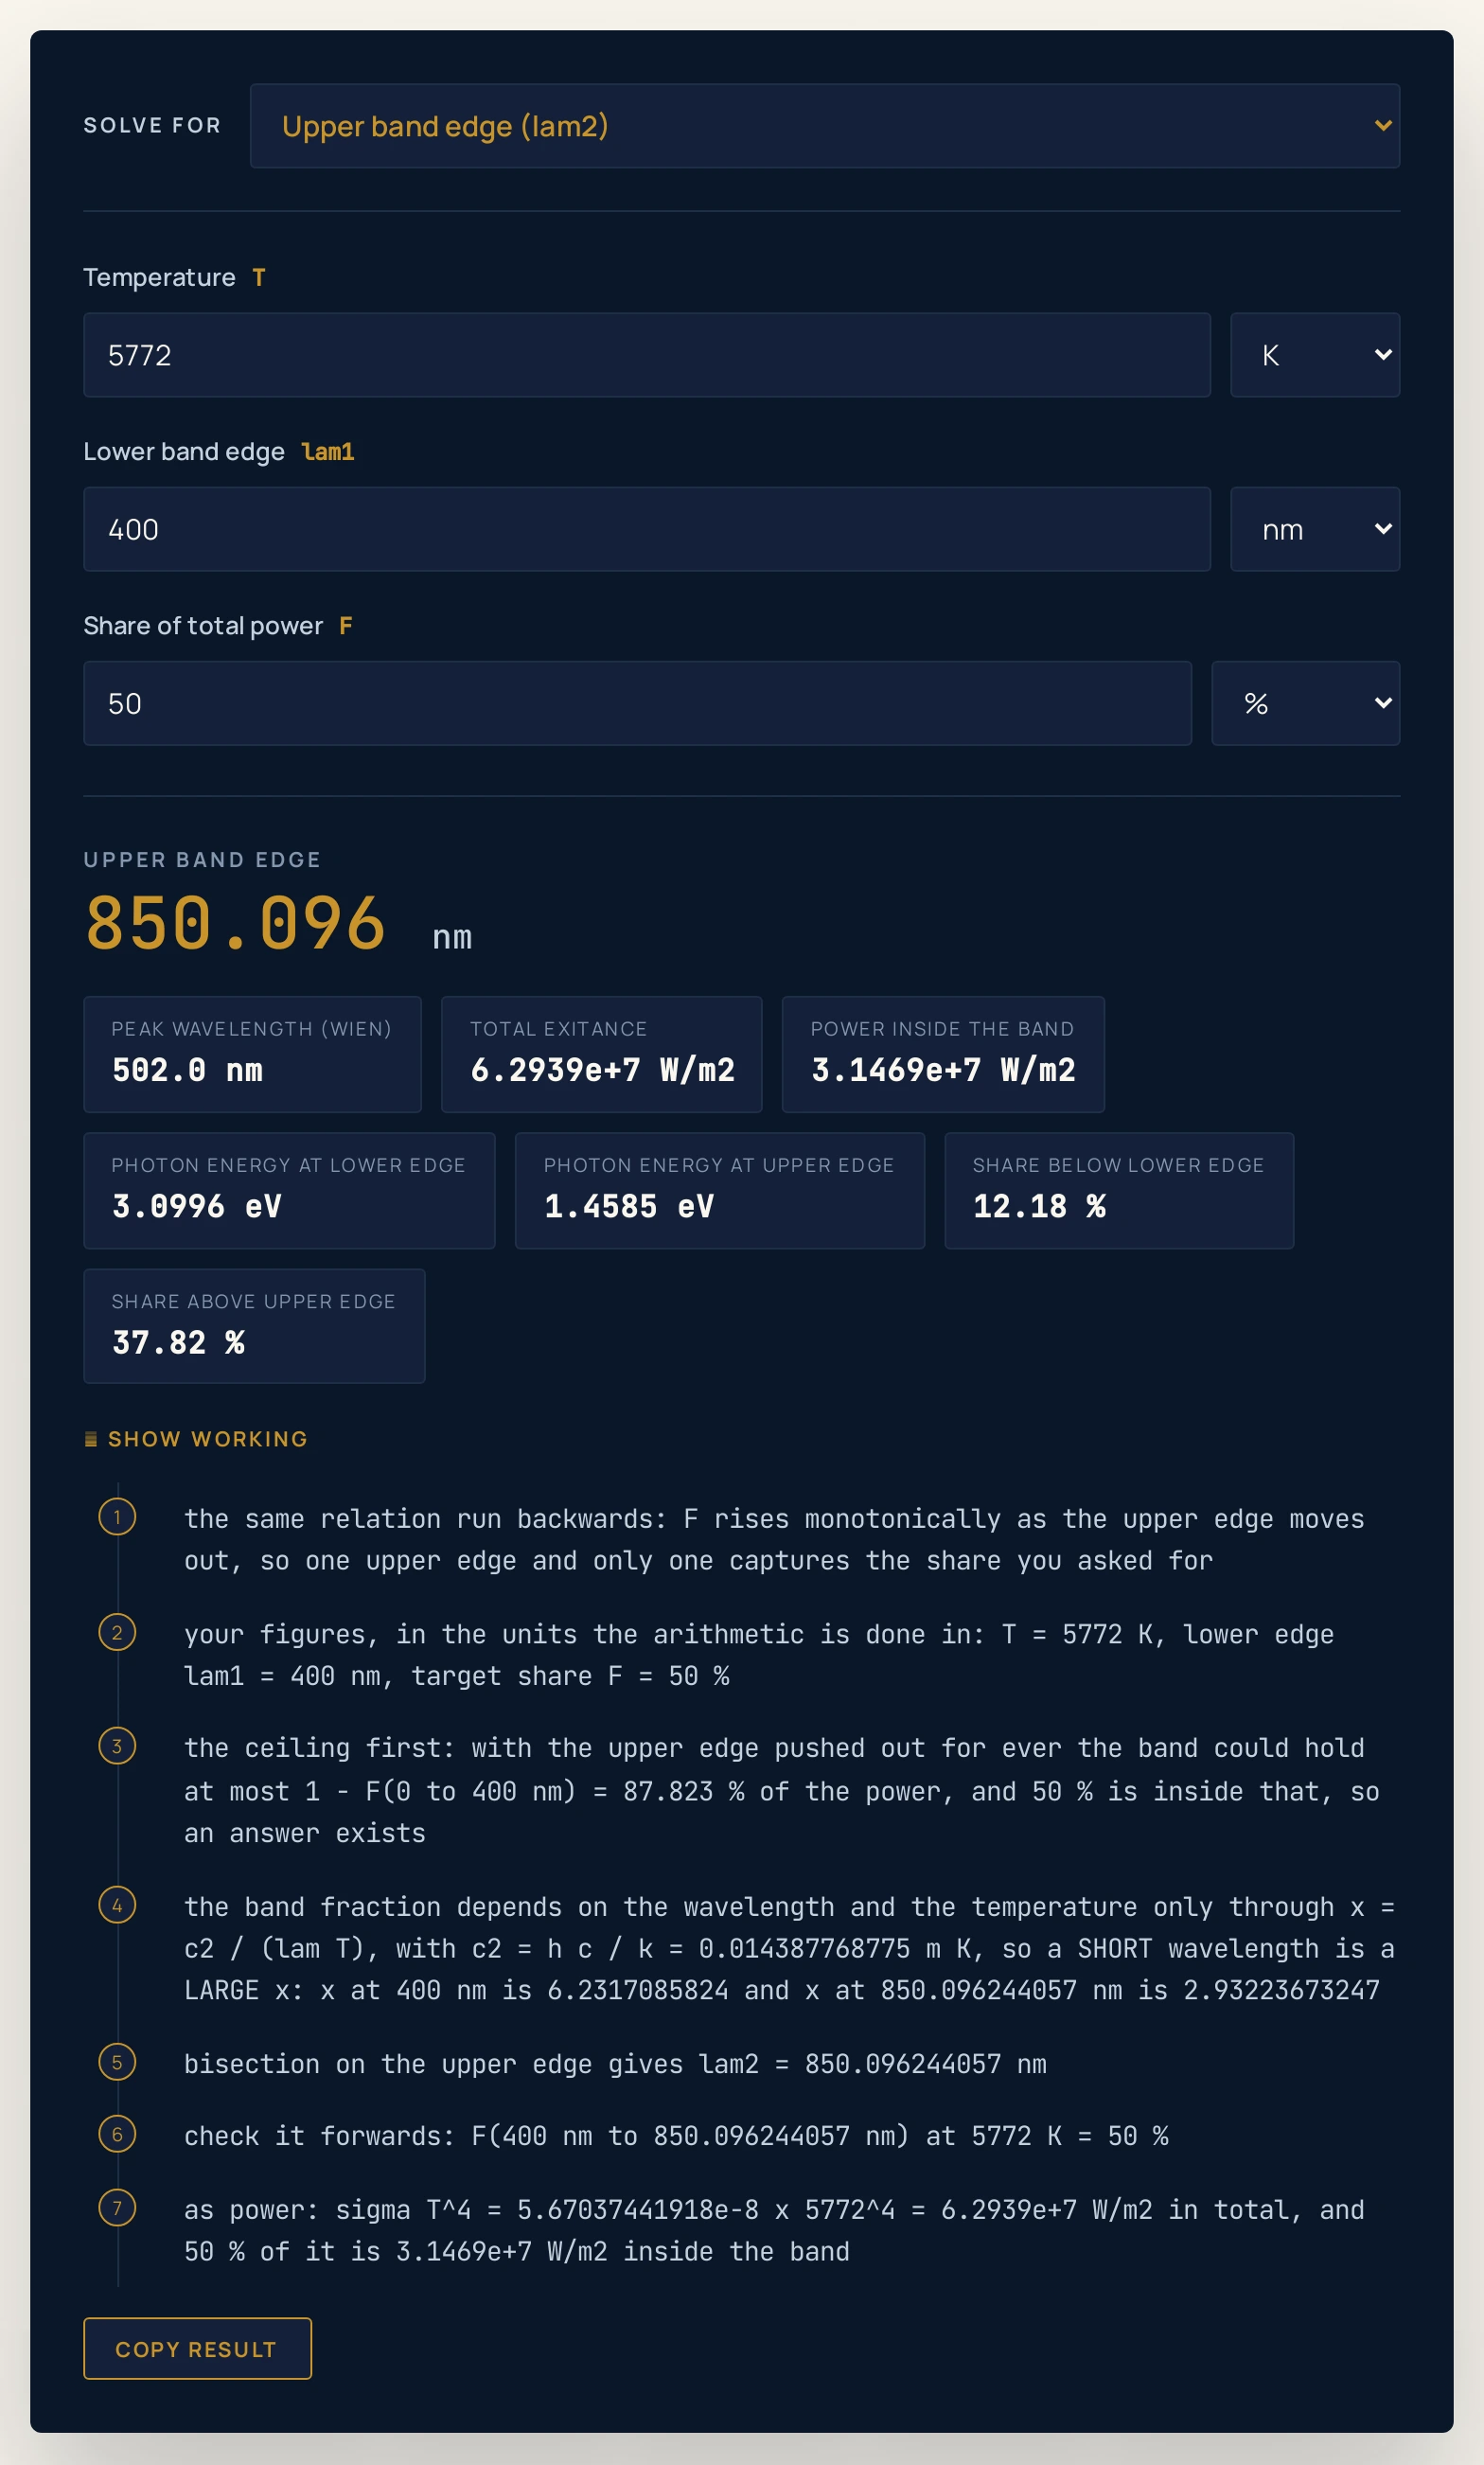
400 nm and 850.096 nm, which is 150 nm past the red end of the visible band — and the peak chip still reads 502.0 nm, because the peak belongs to the temperature rather than to the band.Where the blackbody radiation calculator breaks down
The arithmetic is exact to the last digit a double can hold. What fails is the ideal surface being mistaken for a real one, or a percentage being carried away from the band that produced it.
- There is no solve-for-temperature mode, and there never will be
- The share inside a fixed band is not monotonic in temperature. For 400 to 700 nm it climbs to 39.3021 % at 7042 K and then falls away, so most achievable shares are produced by two temperatures, one on each side of that hump. The physics contract behind this page pins a concrete example: 30 % of the power lands in the visible band at 4818.7 K and again at 10839.0 K. A solve-for-temperature mode would have to return one of the two, and roughly half the time it would return the one you did not mean, with nothing on screen to say so. Refusing to offer the mode is the honest response; if you need the temperature, sweep it through the forward mode and watch which branch you are on.
- A real surface is not a blackbody, and this page has no emissivity box
- Every figure here assumes an ideal emitter, absorbing and re-emitting perfectly at every wavelength. A real surface emits some fraction of that at each wavelength, and the fraction generally varies with wavelength, so a measured spectrum differs in shape as well as in area. A single grey emissivity would simply cancel out of the band share and would therefore hide exactly the wavelength dependence that matters, which is why there is no box for it. Where the total power is the question rather than the distribution, the Stefan-Boltzmann calculator carries the emissivity term and is the right tool.
- The band edges are a convention, not a constant
- 400 to 700 nm is the band this site states for the visible spectrum, and it is a choice rather than a measurement. Move it to 380 to 750 nm and the same 5772 K surface goes from 36.6383 % to 43.7747 %, a swing of about seven points from a definitional decision alone. Every percentage this page prints should travel with the two edges that produced it, and a figure quoted without them cannot be checked or compared.
- The peak chip is a per-wavelength peak
- The Wien displacement constant divided by the temperature locates the maximum of the spectral exitance per unit wavelength. Write the same spectrum per unit frequency and its maximum falls somewhere else entirely, and the two are not connected by the speed of light divided by the wavelength, because the change of variable stretches the axis unevenly. Saying that a 5772 K surface peaks at 502.0 nm without adding “per unit wavelength” is a classic exam trap rather than a rounding issue.
- A share is not an efficiency
- The visible share at 7042 K is 7.86 times the share at 2700 K, but the hotter surface also radiates 46.3 times as much power in total, so the two ratios are answering different questions. Neither of them is lumens per watt, neither accounts for how the eye weights wavelengths, and no filament survives 7042 K in any case. Read the share as a distribution and the total exitance chip as the quantity, and never multiply one comparison by the other.
- Solar figures here are top-of-atmosphere, and 5772 K is a nominal value
- 5772 K is the defined nominal solar effective temperature, not a reading taken from the Sun, and the Sun is not a blackbody in detail: its spectrum carries absorption lines and its effective temperature varies with wavelength and with position on the disc. What can be said is that the model reproduces the measured total solar irradiance to about 0.01 %, which is the reason the idealisation is worth teaching. Sunlight at the ground is a different spectrum again, because the atmosphere has already removed most of the ultraviolet and cut chunks out of the infrared.
- The two reverse modes refuse rather than clamp
- Lowering the lower edge all the way to zero captures only the power lying below the upper edge, and raising the upper edge for ever captures only the power lying above the lower one. When the share you ask for is at or beyond that ceiling there is no answer, and the calculator says so rather than pinning the edge to a limit and returning the number that goes with it. The working line above the refusal prints the ceiling it tested, so a declined case still tells you how close the request was.
- The three shares add to 100 % by definition, so their agreeing checks nothing
- The chips report the share below the lower edge and the share above the upper edge, and those two plus the headline are a partition of the same spectrum. Watching them total 100 % is arithmetic restated, not the tool verifying itself, and the same applies to the total exitance chip agreeing with the fourth-power law. The only genuinely external agreements behind this page are the derived constants against their published CODATA values and the derived solar constant against the measured irradiance.
- A chip reading 0.00 % is not a chip reading zero
- The shares in the chips carry two decimal places, so anything under 0.005 % prints as 0.00 %. At 1000 K the visible share is genuinely 0.000183859 % — small, but a real number with real power behind it, 1.0425e-1 W/m2 in this case. Read the headline rather than the chip whenever the answer is near the bottom of the range, and never write that a surface emits no visible light at all.
- Rounded figures in, rounded figures out
- The headline carries six significant figures; the chips carry a fixed number of decimals chosen per quantity, and the arithmetic behind both is unrounded. A chip therefore need not reproduce the headline in its last digit, and feeding a rounded share back in as an input shifts the answer slightly — asking for 36.64 % of a 5772 K spectrum returns an upper edge of 700.016 nm rather than exactly 700 nm. Show working prints every operand unrounded, so each line there can be checked exactly as it stands.
- Very high temperatures are declined, and the reason is the readout
- The peak wavelength chip is printed to one decimal place in nanometres, so by roughly 29 million kelvin it is down to a single significant figure, 0.1 nm, and it would not round to 0.0 nm until about 58 million. The calculator declines at the 29-million mark rather than print a peak with no precision left in it. Everything anyone brings to a Planck curve sits comfortably inside that bound, including a stellar interior, so in practice the limit is a guard on the display rather than on the physics.
- The calculator measures nothing — you supply every figure
- One temperature and two wavelengths go in, one idealised spectrum is integrated, and the answer describes that ideal surface and nothing else. It is not a measurement of a lamp, a star or a heater, and the preset names are shorthand for the temperatures beside them rather than claims about named products. Verify anything you mean to rely on against your own data, with the band edges stated, before you quote it.
Where the band fraction is actually used
- Radiation pyrometry and the choice of a measuring band
- A non-contact thermometer looks at a narrow slice of the spectrum and infers a temperature from how bright that slice is. How steeply the slice brightens with temperature, and therefore how sensitive the instrument is, follows directly from where that slice sits on the curve. Put the two edges of the instrument’s band into this calculator at two candidate temperatures and the ratio of the two answers is the sensitivity you would get.
- The ceiling on what a hot filament can do
- Before any question of materials or construction, a thermal emitter has a hard limit set by its temperature alone, and this page prints it. At 2700 K only 4.99936 % of the radiated power lands between 400 and 700 nm, and no filament, coating or envelope changes that number, because it is a property of the spectrum. Explaining why lighting moved away from hot wire altogether starts here rather than with any particular lamp.
- Spacecraft and building thermal design
- A surface in sunlight absorbs across a roughly 5772 K spectrum and re-radiates across one near its own temperature, and those two bands barely overlap. Running the calculator twice, once at each temperature, shows how far apart they sit and therefore how much a wavelength-selective coating can achieve. The whole idea of a selective surface depends on that separation, and the separation is a band-fraction calculation.
- Stellar classification and colour indices
- A star’s colour is a ratio of the power it emits in two standard bands, and to first order that ratio is exactly the quantity this page computes, taken twice. Setting the two edges to a photometric band and sweeping the temperature reproduces the shape of the relation between colour and temperature. The real thing needs the instrument response and interstellar reddening as well, so treat this as the first term rather than the answer.
- Sizing what a detector or a photovoltaic cell can see
- Any device with a threshold responds only to photons above a certain energy, which is to say only to wavelengths below a certain edge. Setting the upper edge to that cut-off and the lower edge to the shortest wavelength the source produces gives the fraction of the incoming power the device can use at all. The photon energy calculator converts the threshold energy into the wavelength to type in.
- Checking the blackbody idealisation against something measured
- A model that only agrees with itself is not worth much, so it is worth knowing the one place this one is checked from outside. Scaling the 5772 K surface exitance down to the Earth’s orbit gives about 1361 W/m2, which matches the measured total solar irradiance to roughly 0.01 %. That agreement, and the derived constants matching their published values, are the only external checks this page can offer — everything else here is one model being consistent with itself.
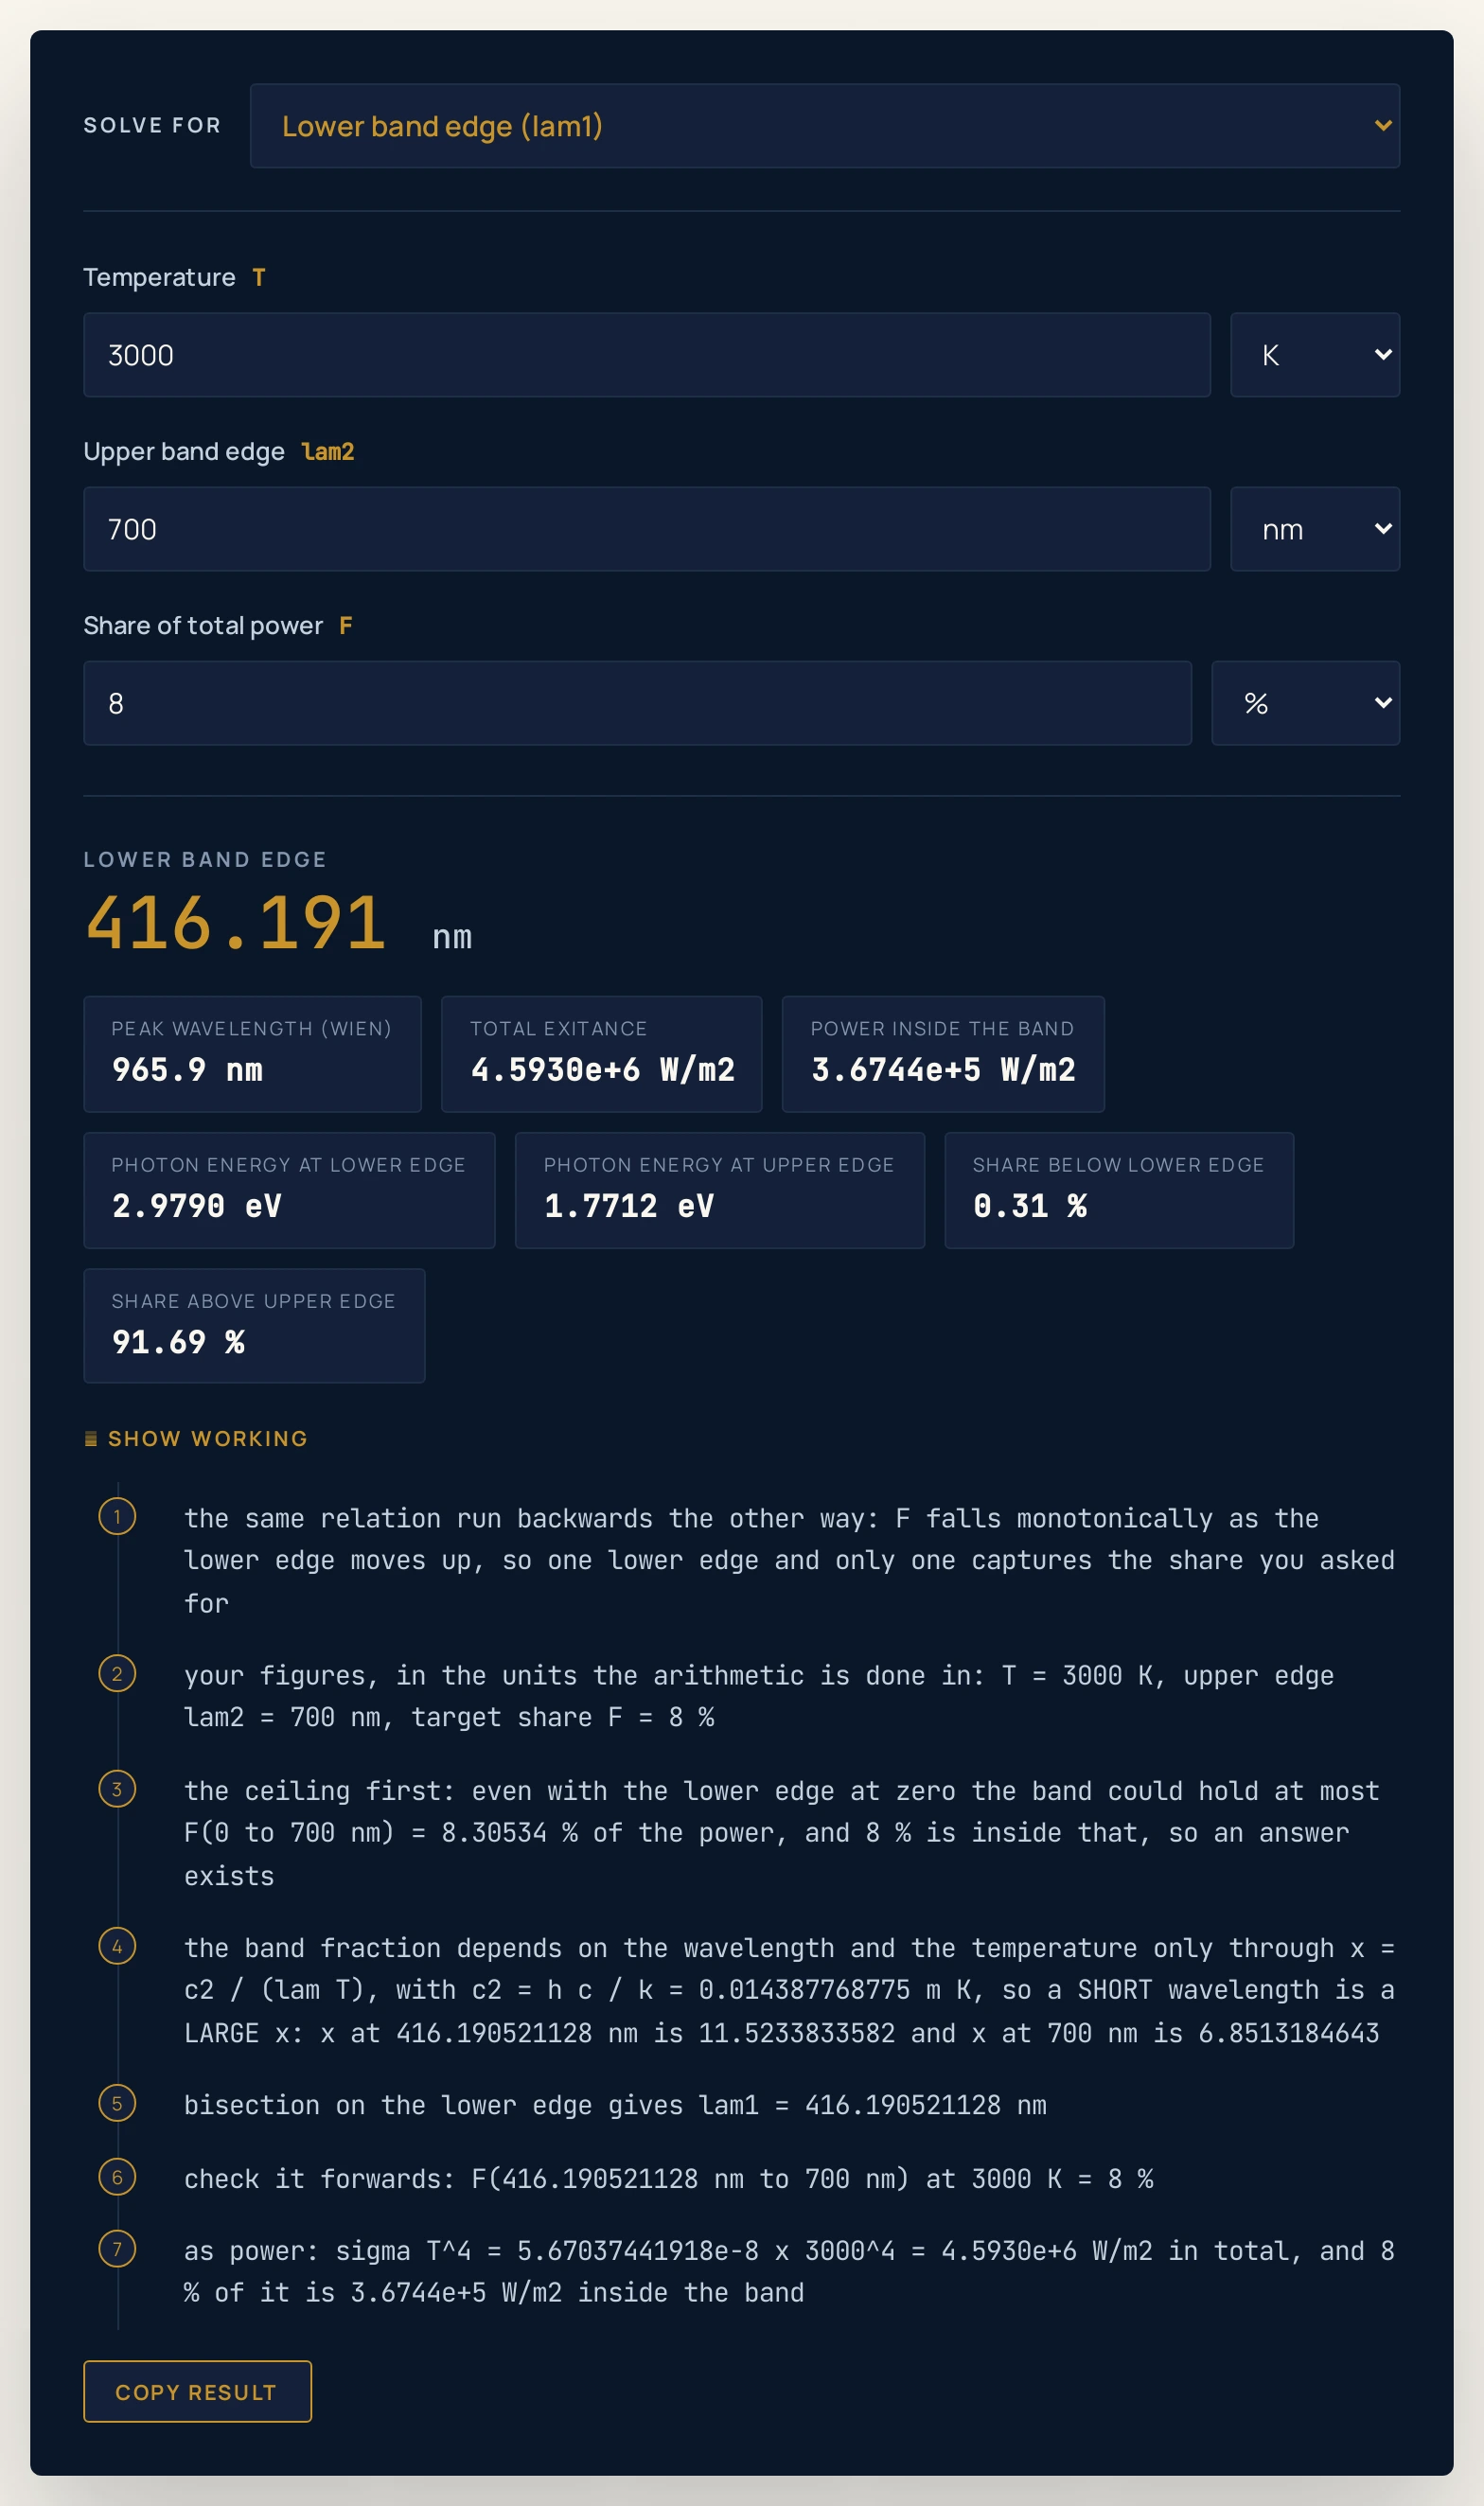
700 nm is only 8.30534 % of this lamp’s power, so asking for 8 % barely fits — the lower edge has to sit at 416.191 nm, and the 91.69 % chip says where the rest of it went.Where to go next
For the method in full, with the curve drawn, the worked problems and the diagrams that go with them, read Blackbody Radiation: Why 39% Is the Best Light You Get. For the total power this page slices up, the guide to the Stefan-Boltzmann law is the companion piece, with the Stefan-Boltzmann calculator and the Stefan-Boltzmann simulator beside it.
Three more are worth a bookmark. The guide to the wavelength formula and its units covers nanometres, angstroms and the rest of the scale; the photon energy formula turns the edge chips into electronvolts; and the Wien law calculator gives the peak on its own. The whole physics lab library is open too, and the site search will find anything this page has not.
Frequently asked questions
What does the blackbody radiation calculator work out?
It works out what share of a hot surface total radiated power falls between two wavelengths. Enter the temperature and the two band edges and it returns that share as a percentage, along with the Wien peak wavelength, the total exitance sigma T^4, the power inside the band, the photon energy at each edge and the shares lying below and above the band. Point the Solve for menu at either edge instead and it runs the same relation backwards, finding the edge that captures a share you name.
What is blackbody radiation?
Blackbody radiation is the thermal radiation given off by an idealised surface that absorbs every wavelength that falls on it and re-emits with an efficiency of one at every wavelength. Its spectrum is fixed entirely by its absolute temperature: no material property, no surface finish and no history enter into it. That is what makes it worth computing, because a single number then determines the whole curve.
What is Planck law?
Planck law gives the power a blackbody radiates per unit area per unit wavelength, as a function of wavelength and temperature. In the hemispherical form this page uses it is 2 pi h c squared divided by lambda to the fifth, divided by exp(hc over lambda k T) minus one. Integrating it over all wavelengths gives the Stefan-Boltzmann result sigma T to the fourth, and integrating it between two wavelengths is exactly what this calculator does.
What units does the calculator take?
Temperature takes kelvin, degrees Celsius or degrees Fahrenheit; both band edges take nanometres, micrometres or metres; and the share takes a percentage or a plain fraction. Everything is converted before any arithmetic happens, and the second line of Show working restates your figures in the units the calculation really uses, which for the two edges is nanometres.
Does it only work for visible light?
No. Nothing about 400 to 700 nm is built in; it is simply where the page opens, and the edge boxes accept micrometres and metres as readily as nanometres. Put a 300 K surface against an 8 to 14 micrometre band and the answer is 37.5742 per cent, with the total exitance chip reading 4.5930e+2 W/m2 and 1.7258e+2 W/m2 of that landing inside the band.
Can it give the power at a single wavelength?
Not at one exact wavelength, because every mode here integrates across a band and a band of no width encloses no power. Ask for a narrow slice instead: 549 to 551 nm on the 5772 K opening case returns 0.256912 per cent, or 1.6170e+5 W/m2 across those two nanometres. The quantity that survives at a single wavelength is the spectral exitance per unit wavelength, which is the height of the Planck curve rather than an area under it, and this calculator reports areas.
References & formula source
- Siegel & Howell, Thermal Radiation Heat Transfer, for the blackbody fractional function and the series used for its large-argument branch. The small-argument branch here is quadrature on the head integral rather than a truncated series, because that series converges too slowly to be trusted at the short-x end.
- Halliday, Resnick & Walker, Fundamentals of Physics, the chapter on photons and matter waves, for Planck law and the historical argument that produced it.
- The four SI defining constants are typed and everything else is derived from them: the Stefan-Boltzmann constant, the second radiation constant, the Wien displacement constant and the photon-energy product hc. Each derived value agrees with its published CODATA figure, and that agreement is the one genuinely external check this page makes on itself.
- Every figure quoted in the text above is a string this calculator printed for the inputs named beside it, or a constant the page states. Percentages are always given with the two band edges that produced them, because 400 to 700 nm is a convention rather than a constant.
- Further reading: Black-body radiation — Wikipedia