Drag force is the resistance a fluid — air, water, or any gas or liquid — exerts on an object moving through it, always acting opposite to the object’s motion. It is calculated with the drag equation: one half the fluid density, times the speed squared, times the drag coefficient, times the frontal area.
Stick your hand out of a car window at 30 km/h and the air barely nudges it. Do the same at 110 km/h and your arm is shoved backwards hard enough to hurt. Same hand, same air — the only thing that changed was speed.
That shove is drag, and it is the reason a lorry burns most of its diesel pushing air rather than moving cargo, the reason a cyclist tucks low, and the reason a bullet is pointed rather than blunt. Get the equation below and you can predict all three.
What Is Drag Force?
Drag force is the backward push a fluid exerts on any object moving through it. It acts along the line of motion, pointing the opposite way, and it exists whether the object is falling, driving, swimming, flying or being pedalled.
Here is the mental picture that makes it click. To move forwards, you have to shove fluid out of the way — and shoving anything takes force.
That fluid pushes back with an equal and opposite force. That is drag.
Two things follow immediately, and both surprise students.
- Drag does not care how heavy you are. Mass appears nowhere in the drag equation. A hollow plastic car and a lead-filled one of identical shape feel identical drag at the same speed.
- Drag does care enormously how fast you are. Double the speed and drag goes up four times, not two.
Physicists call drag a dissipative force: the work it does against you is not stored anywhere recoverable, it is dumped into the fluid as churned-up, warmed-up, swirling air or water. That is energy you paid for and will never get back.
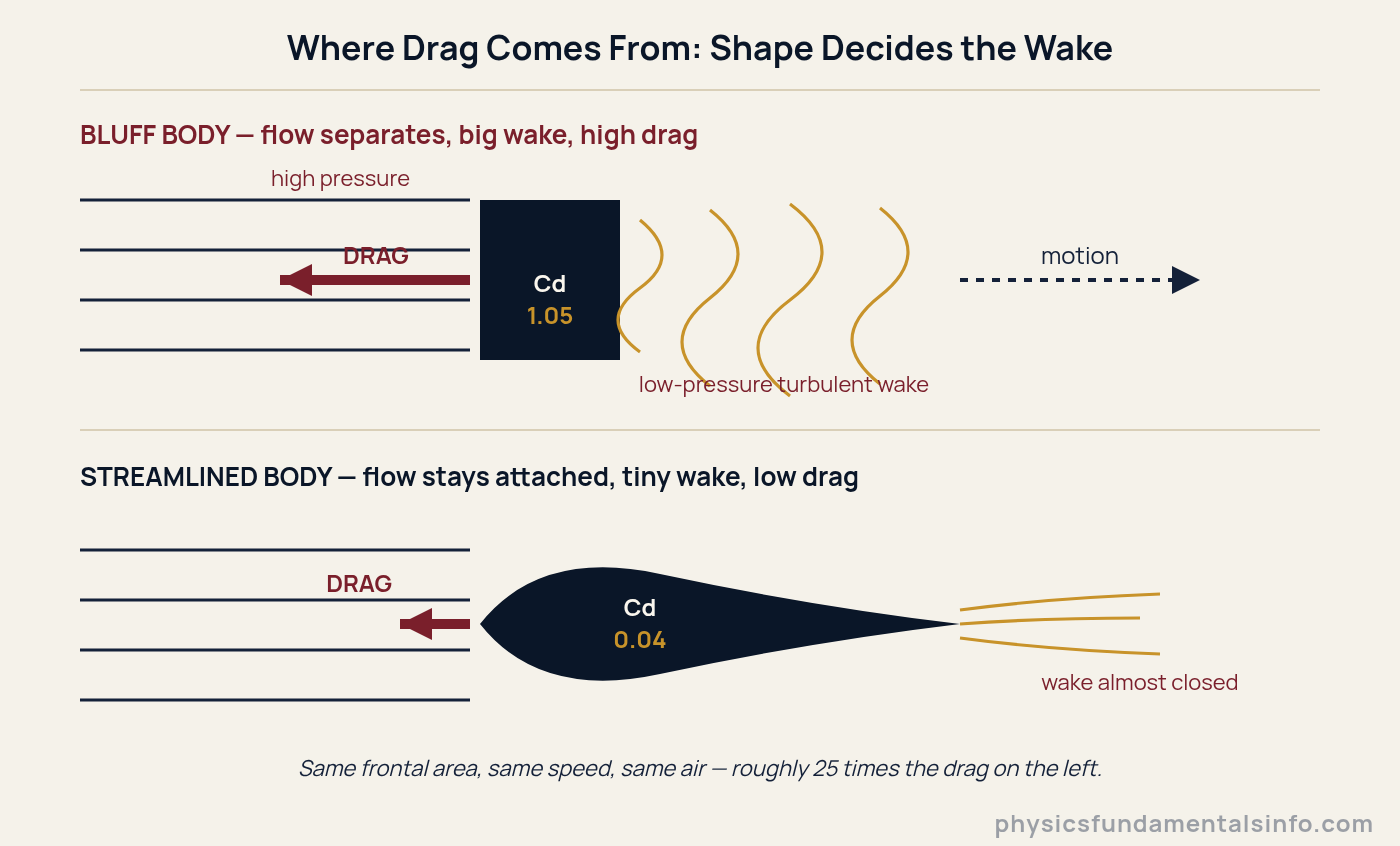
Drag is mostly about what happens behind an object, not in front of it. A wide separated wake is a low-pressure hole the object never stops falling into.
The Drag Force Formula
The drag force formula is F = ½ · ρ · v2 · Cd · A, where the drag force in newtons equals one half the fluid density times the square of the speed times the drag coefficient times the frontal area.
| Symbol | Quantity | SI unit | Notes |
|---|---|---|---|
| F | Drag force | newton (N) | Always directed opposite to motion through the fluid |
| ρ (rho) | Fluid density | kg/m3 | Air at sea level, 15 °C: 1.225 kg/m3. Fresh water: about 1000 kg/m3 |
| v | Speed relative to the fluid | m/s | Relative speed, not ground speed — a headwind counts |
| Cd | Drag coefficient | dimensionless | Measured, not derived. Depends on shape, surface and flow conditions |
| A | Reference area | m2 | Frontal (projected) area for cars, spheres and cyclists |
Where the ½ρv2 Comes From
The group ½ρv2 is not an arbitrary fudge — it is the dynamic pressure, the pressure a moving fluid brings with it. The same term sits at the heart of Bernoulli’s principle, which is why the two topics keep bumping into each other.
Read the equation as a sentence and it stops being intimidating: drag = dynamic pressure × area × a shape penalty. Dynamic pressure sets the scale, area sets how much of the flow you intercept, and Cd is the correction factor for how badly your particular shape handles it.
At 30 m/s in air, ½ρv2 comes to 551 Pa. Present one square metre of frontal area to that and a perfect flat plate would feel around 700 N — the weight of a heavy adult, made of nothing but air.
Once you have all four inputs in SI units, the arithmetic is quick, and you can check any answer in this article against our Drag Force Calculator, which solves the same equation for force or for speed and shows the substitution step by step.
How Drag Force Works: Pressure Drag and Skin Friction
Drag comes from two physically different mechanisms — pressure (form) drag from the difference in pressure between the front and back of an object, and skin-friction drag from the fluid shearing along its surface. Almost every real object experiences both, in wildly different proportions.
Pressure Drag — the Expensive One
Air piles up in front of a moving object, raising the pressure there. Behind it, the flow cannot follow the shape round a sharp corner, so it separates and leaves a churning low-pressure wake.
High pressure at the front, low pressure at the back — that pressure difference multiplied by the area is a backward force. For a blunt shape like a van, a cube or a cyclist sitting upright, this accounts for the overwhelming majority of the total drag.
Skin-Friction Drag — the Quiet One
Right at the surface, fluid sticks to the object and is dragged along with it. That thin sheared layer, the boundary layer, exerts a tangential force over the whole wetted surface.
On a well-streamlined body — an aerofoil, a submarine hull, a Tour de France skinsuit — the wake is tiny, so skin friction becomes the dominant contribution. This is why competitive swimsuits, aircraft skins and racing yacht hulls obsess over surface texture that would be irrelevant on a lorry.
Why Cd Is Not Really a Constant
Here is the part most textbooks skate over. Whether the boundary layer is smooth (laminar) or chaotic (turbulent) when it separates changes the wake size dramatically — and therefore changes Cd.
The governing quantity is the Reynolds number, Re = vL/ν, comparing inertial to viscous effects. For a smooth sphere, Cd sits near 0.5 for a wide band of everyday speeds, then drops abruptly to roughly 0.1 as Re passes about 3 × 10⁵.
That sudden fall is the drag crisis, and golf-ball dimples exist to trigger it early. Dimples deliberately trip the boundary layer turbulent, which makes it cling further round the back, shrinking the wake. A dimpled ball flies close to twice as far as a smooth one hit identically.
The practical takeaway: a quoted Cd is valid for the conditions it was measured in. Use it near those conditions and it is excellent. Use it four orders of magnitude away in Reynolds number and it is fiction.
Drag Coefficient Values for Common Shapes
Drag coefficients for common shapes range from about 0.04 for a fully streamlined body to about 1.3 for an open parachute — a spread of more than thirty times, all at the same speed and the same frontal area. Shape is the single biggest lever you have.
Every value below uses the frontal (projected) area as the reference area, at ordinary subsonic speeds. Values marked as NASA wind-tunnel figures come from NASA Glenn’s Shape Effects on Drag reference; the rest are standard textbook and industry figures, quoted as ranges because that is honestly how well they are known.
| Shape | Typical Cd | Why it lands there |
|---|---|---|
| Streamlined body / aerofoil section | 0.04 – 0.05 | Flow stays attached almost to the tail; almost no wake (NASA quotes 0.045 for a typical aerofoil) |
| Rifle bullet | 0.30 | Pointed nose, tapered boat-tail (NASA: 0.295) |
| Modern saloon car | 0.25 – 0.35 | Decades of tuning the rear; the slipperiest production cars now reach about 0.20 |
| Smooth sphere (everyday speeds) | 0.5, falling to ~0.1 | Strongly Reynolds-dependent; NASA gives the full range as 0.07 – 0.5 |
| Model rocket | 0.75 | Slim, but fins and a blunt tail add wake (NASA figure) |
| Articulated lorry (tractor-trailer) | 0.6 – 0.8 | Slab front, gap behind the cab, square rear; fairings pull it towards 0.6 |
| Cyclist, racing tuck | 0.85 – 0.9 | Lower torso angle cuts both Cd and frontal area at once |
| Cube, face-on to the flow | 1.05 | Sharp edges force separation immediately; turn it corner-on and it drops to about 0.8 |
| Cyclist, sitting upright | 1.0 – 1.1 | A person is essentially a bluff body wearing clothes |
| Flat plate, perpendicular to flow | 1.28 | The benchmark for “as bad as it gets” (NASA figure) |
| Open parachute (hemisphere, concave to flow) | 1.3 – 1.4 | Deliberately terrible — the whole point is maximum drag |
Why Engineers Quote CdA, Not Cd
Cd on its own is a trap when comparing real vehicles, because a low coefficient on a huge frontal area still means a lot of drag. Engineers therefore multiply the two together into a single number: the drag area, CdA, measured in m2.
- Saloon car, Cd 0.30 × 2.2 m2 → CdA ≈ 0.66 m2
- Large SUV, Cd 0.35 × 2.8 m2 → CdA ≈ 0.98 m2
- Cyclist upright, Cd 1.1 × 0.50 m2 → CdA ≈ 0.55 m2
- Cyclist in a tuck, Cd 0.88 × 0.36 m2 → CdA ≈ 0.32 m2
Read that list again and notice something: an upright cyclist has a drag area close to a car’s. The bike is not what makes you slow — you are.
Why Drag Grows with Speed Squared — and Power with Speed Cubed
Drag grows with the square of speed because the term v2 sits in the equation, so doubling your speed multiplies drag by four. The power needed to overcome that drag grows with the cube of speed, so the same doubling multiplies your power requirement by eight.
The second half of that sentence is the one that actually runs the world, and almost nobody is taught it.
Power is force times velocity. Substitute the drag equation and you get:
Two factors of v come from the drag itself; the third comes from having to deliver that force over more metres per second. The result is a wall that gets steeper the harder you push at it — and it explains why power in physics is the honest currency for anything that has to cruise.

The power curve is flat where you do not care and vertical where you do. That is the whole story of top speed.
Put real numbers on it. Take a car with Cd = 0.30 and A = 2.2 m2 in ordinary air:
- At 100 km/h (27.8 m/s): drag ≈ 312 N, needing about 8.7 kW just to push air aside.
- At 120 km/h (33.3 m/s): drag ≈ 449 N, needing about 15.0 kW.
A 20 % speed increase raised drag by 44 % and aerodynamic power by 73 %. In practice this is exactly why fuel economy falls off a cliff above roughly 90 km/h, and why the single most effective fuel-saving action available to any driver is easing off by 10 km/h.
Real-World Examples of Drag Force
Drag force shows up wherever something moves through air or water — and in most of those cases it is the dominant force the machine or athlete is fighting. Five examples, each with its own lesson.
1. Cars at Motorway Speed
At 108 km/h, a typical saloon (Cd 0.30, A 2.2 m2) faces about 364 N of drag and burns roughly 11 kW overcoming it. That is why manufacturers fight over the second decimal place of Cd — and why a roof box, which barely changes the car’s weight, can wreck its economy.
2. Cyclists
Air resistance dominates cycling above about 15 km/h, and by racing speeds it is nearly the whole battle. A rider in a tuck (CdA ≈ 0.32 m2) at 36 km/h faces around 19 N of drag, needing about 194 W of aerodynamic power.
Sit up straight and the drag area jumps to roughly 0.55 m2. Same legs, same bike, nearly 70 % more air to shift — which is the entire reason a peloton exists.
3. Articulated Lorries
A tractor-trailer presents around 10 m2 of frontal area at Cd ≈ 0.8. At 90 km/h that is roughly 3.1 kN of drag and about 77 kW of engine power spent on air alone.
Fit cab fairings and side skirts to bring Cd down to 0.65 and you save about 14 kW — nearly 19 % — without touching the engine. Over a fleet’s annual mileage, that is the difference between profit and loss.
4. Footballs and Cricket Balls
Here is the number that surprises everyone. A struck football (0.43 kg, 22 cm across) travelling at 30 m/s meets roughly 5.2 N of drag, while its own weight is only about 4.2 N.
The air pushes back on that ball harder than gravity pulls it down. Any trajectory you calculate for it using clean projectile motion and no drag will be badly wrong — the real ball lands much shorter and much steeper.
5. Swimmers, Hulls and Anything in Water
Water is about 816 times denser than air. Swap the fluid and hold everything else fixed, and the drag equation says the force multiplies by that same factor.
That single ratio explains why a swimmer moving at 2 m/s is working harder against the water than a cyclist at 2 m/s is against the air, by a margin no amount of technique closes. It also explains why hull design has obsessed shipbuilders for three thousand years, and it depends directly on fluid density.

Common Misconceptions About Drag Force
Four specific beliefs cause most of the wrong answers in exams and most of the bad intuition outside them. Each one is worth correcting properly.
Misconception 1: “Heavier objects experience more drag”
Mass does not appear in the drag equation at all. Two objects of identical shape and size feel identical drag at identical speed, whether one is polystyrene and the other is lead.
What mass changes is the consequence of that drag — the acceleration it produces, via Newton’s second law. The heavier object shrugs the same force off more easily. That is a different statement, and mixing the two up is the most common slip we see.
Misconception 2: “The drag coefficient is a fixed property of a shape”
Cd is a measured summary of complicated physics, not a material constant. It shifts with Reynolds number, with surface roughness, with the object’s angle to the flow, and near the speed of sound it changes character entirely.
The sphere is the cautionary tale: the same smooth ball can have a Cd of 0.5 or 0.1 depending only on how fast it is going.
Misconception 3: “You can compare any two Cd values directly”
Only if both were measured against the same reference area — and often they are not. Car figures use frontal area, but aircraft figures conventionally use wing planform area, which is far larger.
This is why an airliner’s quoted Cd of around 0.03 does not mean it is ten times slipperier than a good car. NASA’s own drag coefficient reference makes the point explicitly: when you report a Cd, you must state the reference area, or the number means nothing.
Misconception 4: “Drag is just friction with the air”
Only a slice of it is. Surface friction — the skin-friction part — is real, but for the blunt objects most of us care about, the majority of drag is pressure drag from the wake, which has nothing to do with rubbing.
Streamline the tail of a shape without changing its front or its surface at all and drag can fall by a factor of ten. Nothing about the “friction” has changed. The wake has.
How Drag Force Relates to Friction, Terminal Velocity and Fluid Pressure
Drag is one member of a family of resistive forces, and it behaves quite differently from its relatives. Lining them up side by side is the fastest way to stop confusing them.
- Versus dry friction. Surface friction follows F = μN — independent of speed and dependent on the normal force. Drag is the opposite on both counts: fiercely speed-dependent, and completely indifferent to how hard surfaces press together. They sit in different branches of the types of forces taxonomy for good reason.
- Versus terminal velocity. When an object falls, drag grows until it exactly balances weight and the object stops accelerating. That special case has its own full treatment in our guide to terminal velocity, including the rearranged formula and worked skydiver problems.
- Versus fluid pressure. The ½ρv2 in the drag equation is dynamic pressure, the same quantity that trades against static pressure in Bernoulli’s principle. Drag and lift are two faces of one pressure field.
One boundary worth knowing: everything above assumes the fast, wake-dominated regime where drag goes as v2. For very small or very slow objects — fog droplets, bacteria, a ball bearing sinking through oil — viscosity rules instead and drag becomes proportional to v, described by Stokes’ law rather than the drag equation.
Worked Problems
Show Solution
Solution:
Step 1: Use the drag equation, F = ½ · ρ · v2 · Cd · A.
Step 2: Substitute with units. F = ½ × 1.225 kg/m3 × (10 m/s)2 × 0.88 × 0.36 m2.
Step 3: Work through it. ½ × 1.225 = 0.6125; (10)2 = 100; 0.6125 × 100 = 61.25; 61.25 × 0.88 = 53.9; 53.9 × 0.36 = 19.4.
Answer: F ≈ 19.4 N
Sanity check: about the weight of a 2 kg bag of flour, held against you constantly. That is why cycling into a headwind is exhausting.
Show Solution
Solution:
Step 1: Drag depends on v2, so doubling v multiplies F by 22 = 4.
Step 2: F = 4 × 19.4 N = 77.6 N.
Step 3: Power is P = F · v, so P = 77.6 N × 20 m/s = 1552 W. Compare with 19.4 × 10 = 194 W before — a factor of 23 = 8.
Answer: F ≈ 77.6 N and P ≈ 1552 W (about 1.55 kW)
Sanity check: 1.55 kW is roughly double what a world-class sprinter can produce for even a few seconds. Nobody holds 72 km/h on the flat, and this is exactly why.
Show Solution
Solution:
Step 1: F = ½ · ρ · v2 · Cd · A.
Step 2: F = 0.6125 × (25)2 × 0.32 × 2.1 = 0.6125 × 625 × 0.32 × 2.1.
Step 3: 0.6125 × 625 = 382.8; 382.8 × 0.32 = 122.5; 122.5 × 2.1 = 257.25.
Step 4: P = F · v = 257.25 N × 25 m/s = 6431 W.
Answer: F ≈ 257 N and P ≈ 6.4 kW
Sanity check: about 8.6 horsepower to hold 90 km/h against the air alone — tyres, drivetrain and engine losses come on top.
Show Solution
Solution:
Step 1: Rearrange the drag equation for Cd. Since F = ½ρv2Cd·A, then Cd = 2F / (ρ · v2 · A).
Step 2: Substitute. Cd = (2 × 300) / (1.225 × 282 × 2.2).
Step 3: Denominator: 282 = 784; 1.225 × 784 = 960.4; 960.4 × 2.2 = 2112.9. Numerator: 600.
Step 4: Cd = 600 / 2112.9 = 0.284.
Answer: Cd ≈ 0.28
Sanity check: that sits inside the 0.25–0.35 band for modern saloons, so the measurement is plausible.
Show Solution
Solution:
Step 1: In air, F = ½ × 1.225 × (2)2 × 0.9 × 0.09 = 0.6125 × 4 × 0.9 × 0.09 = 0.198 N.
Step 2: In water, F = ½ × 1000 × (2)2 × 0.9 × 0.09 = 500 × 4 × 0.9 × 0.09 = 162 N.
Step 3: Ratio = 162 / 0.198 = 816, which is exactly the density ratio 1000 / 1.225.
Answer: about 0.20 N in air and 162 N in water — a factor of 816
Sanity check: drag is directly proportional to ρ, so the force ratio must equal the density ratio. It does.
Show Solution
Solution:
Step 1: Before fairings, F = 0.6125 × 625 × 0.80 × 10 = 3062.5 N.
Step 2: After fairings, F = 0.6125 × 625 × 0.65 × 10 = 2488.3 N.
Step 3: Power before, P = 3062.5 × 25 = 76 563 W. Power after, P = 2488.3 × 25 = 62 207 W.
Step 4: Saving = 76 563 − 62 207 = 14 356 W.
Answer: about 14.4 kW saved, a reduction of 18.75 %
Sanity check: Cd fell by 18.75 % and everything else is unchanged, so the power must fall by exactly the same percentage. It does — a useful check that no arithmetic slipped.
Show Solution
Solution:
Step 1: Frontal area of a sphere is A = πr2, with r = 0.11 m. A = π × (0.11)2 = 0.0380 m2.
Step 2: F = ½ × 1.225 × (30)2 × 0.25 × 0.0380 = 0.6125 × 900 × 0.25 × 0.0380.
Step 3: 0.6125 × 900 = 551.25; 551.25 × 0.25 = 137.8; 137.8 × 0.0380 = 5.24.
Step 4: Weight = mg = 0.43 × 9.81 = 4.22 N.
Answer: drag ≈ 5.24 N versus a weight of 4.22 N — drag is about 1.24 times the weight
Sanity check: at the moment it leaves the boot, the air decelerates the ball harder than gravity does. Any no-drag projectile calculation will overestimate the range badly.