Absolute zero is the floor of the kelvin scale, 0 K, and this lab is a way of walking a gas down to it and watching what goes with the heat. One slider carries you from 600 K to the bottom of the scale; four buttons choose the gas. The panel answers with the reading on three scales, the rms molecular speed, the energy per molecule, the Charles volume ratio and a phase note, while eight landmarks on the drawn scale — boiling water down to absolute zero — tell you where you have arrived.
Absolute Zero: Temperature and Molecular Motion
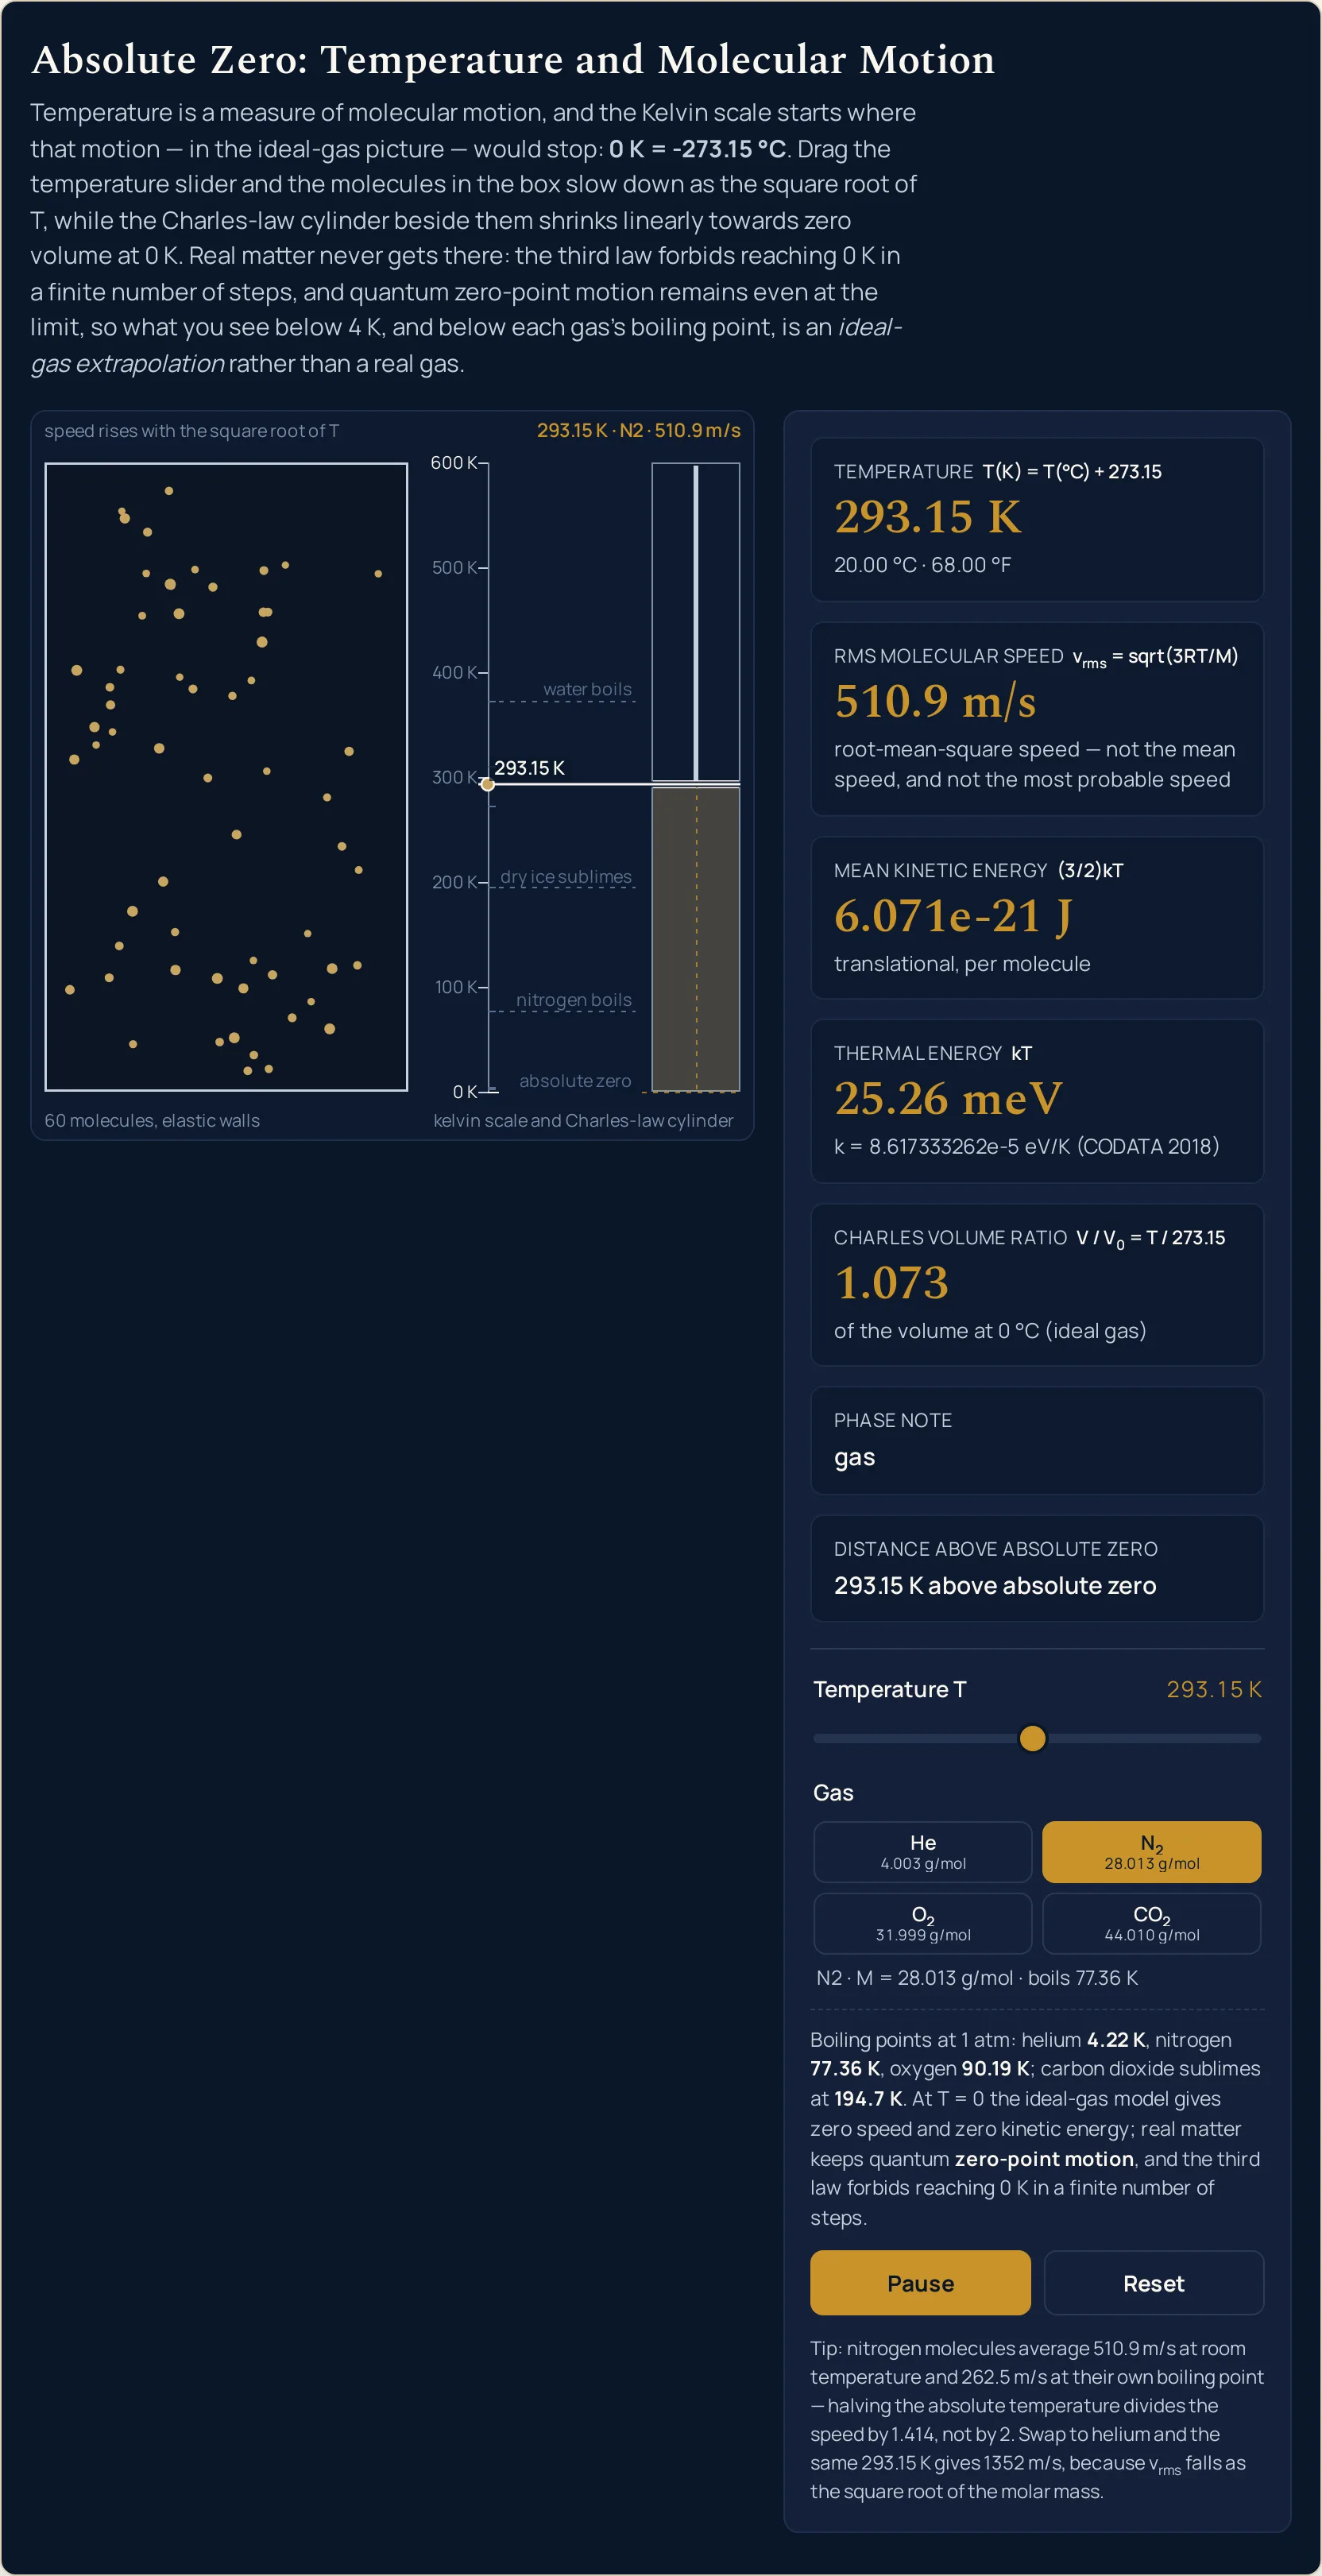
Temperature is a measure of molecular motion, and the Kelvin scale starts where that motion — in the ideal-gas picture — would stop: 0 K = -273.15 °C. Drag the temperature slider and the molecules in the box slow down as the square root of T, while the Charles-law cylinder beside them shrinks linearly towards zero volume at 0 K. Real matter never gets there: the third law forbids reaching 0 K in a finite number of steps, and quantum zero-point motion remains even at the limit, so what you see below 4 K, and below each gas's boiling point, is an ideal-gas extrapolation rather than a real gas.
Load a real temperature
Each button presses one of the four gas buttons and moves the temperature slider to a landmark on the scale. The line underneath is read back out of the running simulation once it has updated, so it can only ever quote the lab's own readouts.
Pick a temperature above, or drag the slider yourself.
What Is the Absolute Zero Simulator?
The absolute zero simulator is a free interactive physics lab that runs in your browser — nothing to install and no sign-up. Drag one temperature slider anywhere between 600 K and 0 K, choose helium, nitrogen, oxygen or carbon dioxide, and watch sixty molecules slow as the square root of the temperature while a Charles-law cylinder shrinks in proportion to it. It reports the temperature in kelvin, Celsius and Fahrenheit, the root-mean-square molecular speed, the mean kinetic energy per molecule, the thermal energy kT, the volume ratio against 0 °C and a phase note that says when the gas would already have condensed.
| Control | Range | Step |
|---|---|---|
| Temperature | 0 – 600 K | 0.01 |
| Gas | helium, nitrogen, oxygen, carbon dioxide | buttons |
How to use the absolute zero simulator
- Set the temperature. Drag Temperature T anywhere from 0 to 600 K. It moves in hundredths of a kelvin, which is also the precision the readouts print at, so landmarks such as 77.36 K and 4.22 K land exactly rather than being rounded to something near them.
- Read it on three scales. The Temperature readout gives kelvin, with Celsius and Fahrenheit on the line beneath: 293.15 K is 20.00 °C and 68.00 °F. Distance above absolute zero repeats the kelvin figure, which is the whole point of a scale whose zero is the real one.
- Choose the gas. The four buttons, He, N2, O2 and CO2, carry their molar masses, and the line below them prints what the lab will use, for instance N2 · M = 28.013 g/mol · boils 77.36 K. Only the speed readout and the phase threshold respond to a change of gas.
- Read the speed and the energies. RMS molecular speed is the main readout, to four significant figures at and above 100 m/s and three below it; Mean kinetic energy gives the translational energy of one molecule and Thermal energy the same quantity as kT in millielectronvolts. Neither energy depends on which gas is pressed.
- Watch the cylinder. Charles volume ratio compares the gas volume with its volume at 0 °C, and the piston in the picture sits at the same height as the temperature marker on the scale beside it. Below the gas's boiling point the column turns hatched and the Phase note says why.
- Pause and start again. Pause freezes the molecules where they are and the readouts keep working; Play sets them going. Reset restores nitrogen at 293.15 K with the animation running, and the six presets above are the quicker route to a particular temperature.
Worked example: change one thing at a time
Begin from the Reset state and move one control per step. Every cell below is a string the running lab printed at those control positions, the gas column being its own button label, so the lab is the authority if the table and the screen ever disagree.
| Step | Gas | Temperature | Celsius | RMS speed | Mean kinetic energy | Thermal energy | Volume ratio |
|---|---|---|---|---|---|---|---|
| Start (Reset) | N2 | 293.15 K | 20.00 °C | 510.9 m/s | 6.071e-21 J | 25.26 meV | 1.073 |
| Cool to where nitrogen boils | N2 | 77.36 K | -195.79 °C | 262.5 m/s | 1.602e-21 J | 6.67 meV | 0.283 |
| Cool to where helium boils | N2 | 4.22 K | -268.93 °C | 61.3 m/s | 8.740e-23 J | 0.36 meV | 0.015 |
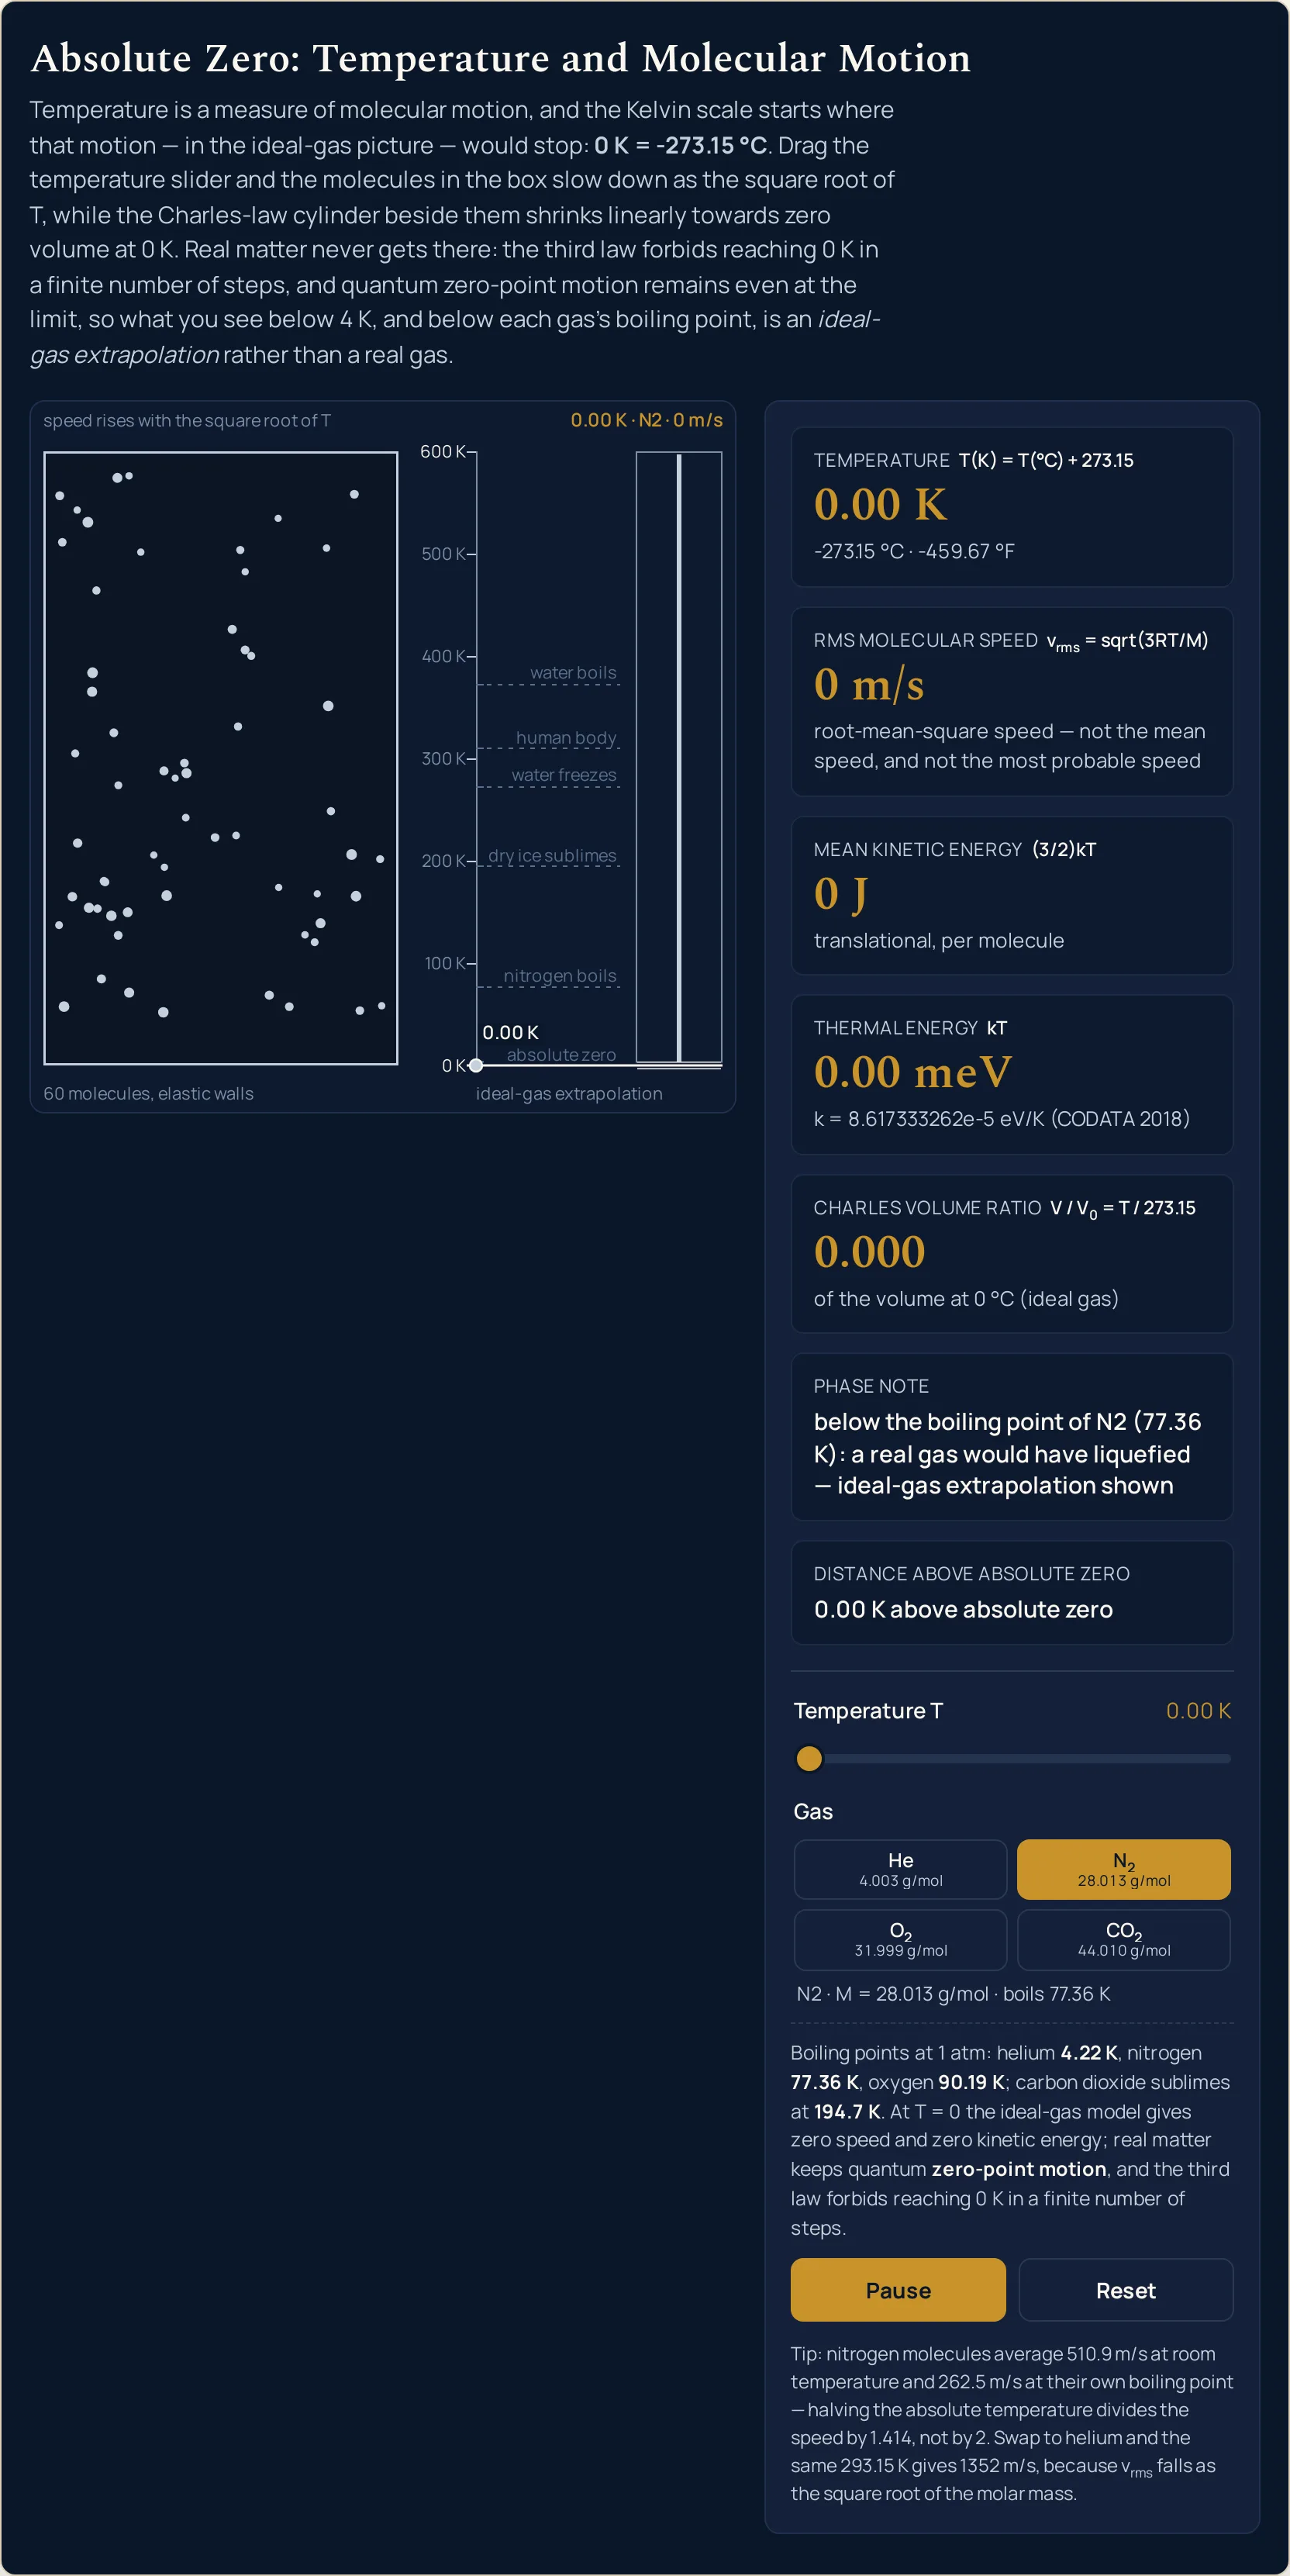
| Slide to the bottom of the scale | N2 | 0.00 K | -273.15 °C | 0 m/s | 0 J | 0.00 meV | 0.000 |
| Press helium, back to 293.15 K | He | 293.15 K | 20.00 °C | 1352 m/s | 6.071e-21 J | 25.26 meV | 1.073 |
| Heat the helium to 600 K | He | 600.00 K | 326.85 °C | 1934 m/s | 1.243e-20 J | 51.70 meV | 2.197 |
Rows 1 to 4 keep nitrogen in the box and move only the slider. Row 1 to row 2 is the drop to 77.36 K, where nitrogen boils: the energies fall by the same factor as the kelvin reading, 25.26 meV becoming 6.67 meV, while the speed falls by less, 510.9 m/s to 262.5 m/s. The cylinder loses nearly three quarters of its height, from 1.073 to 0.283, and the molecules dim from gold towards grey.
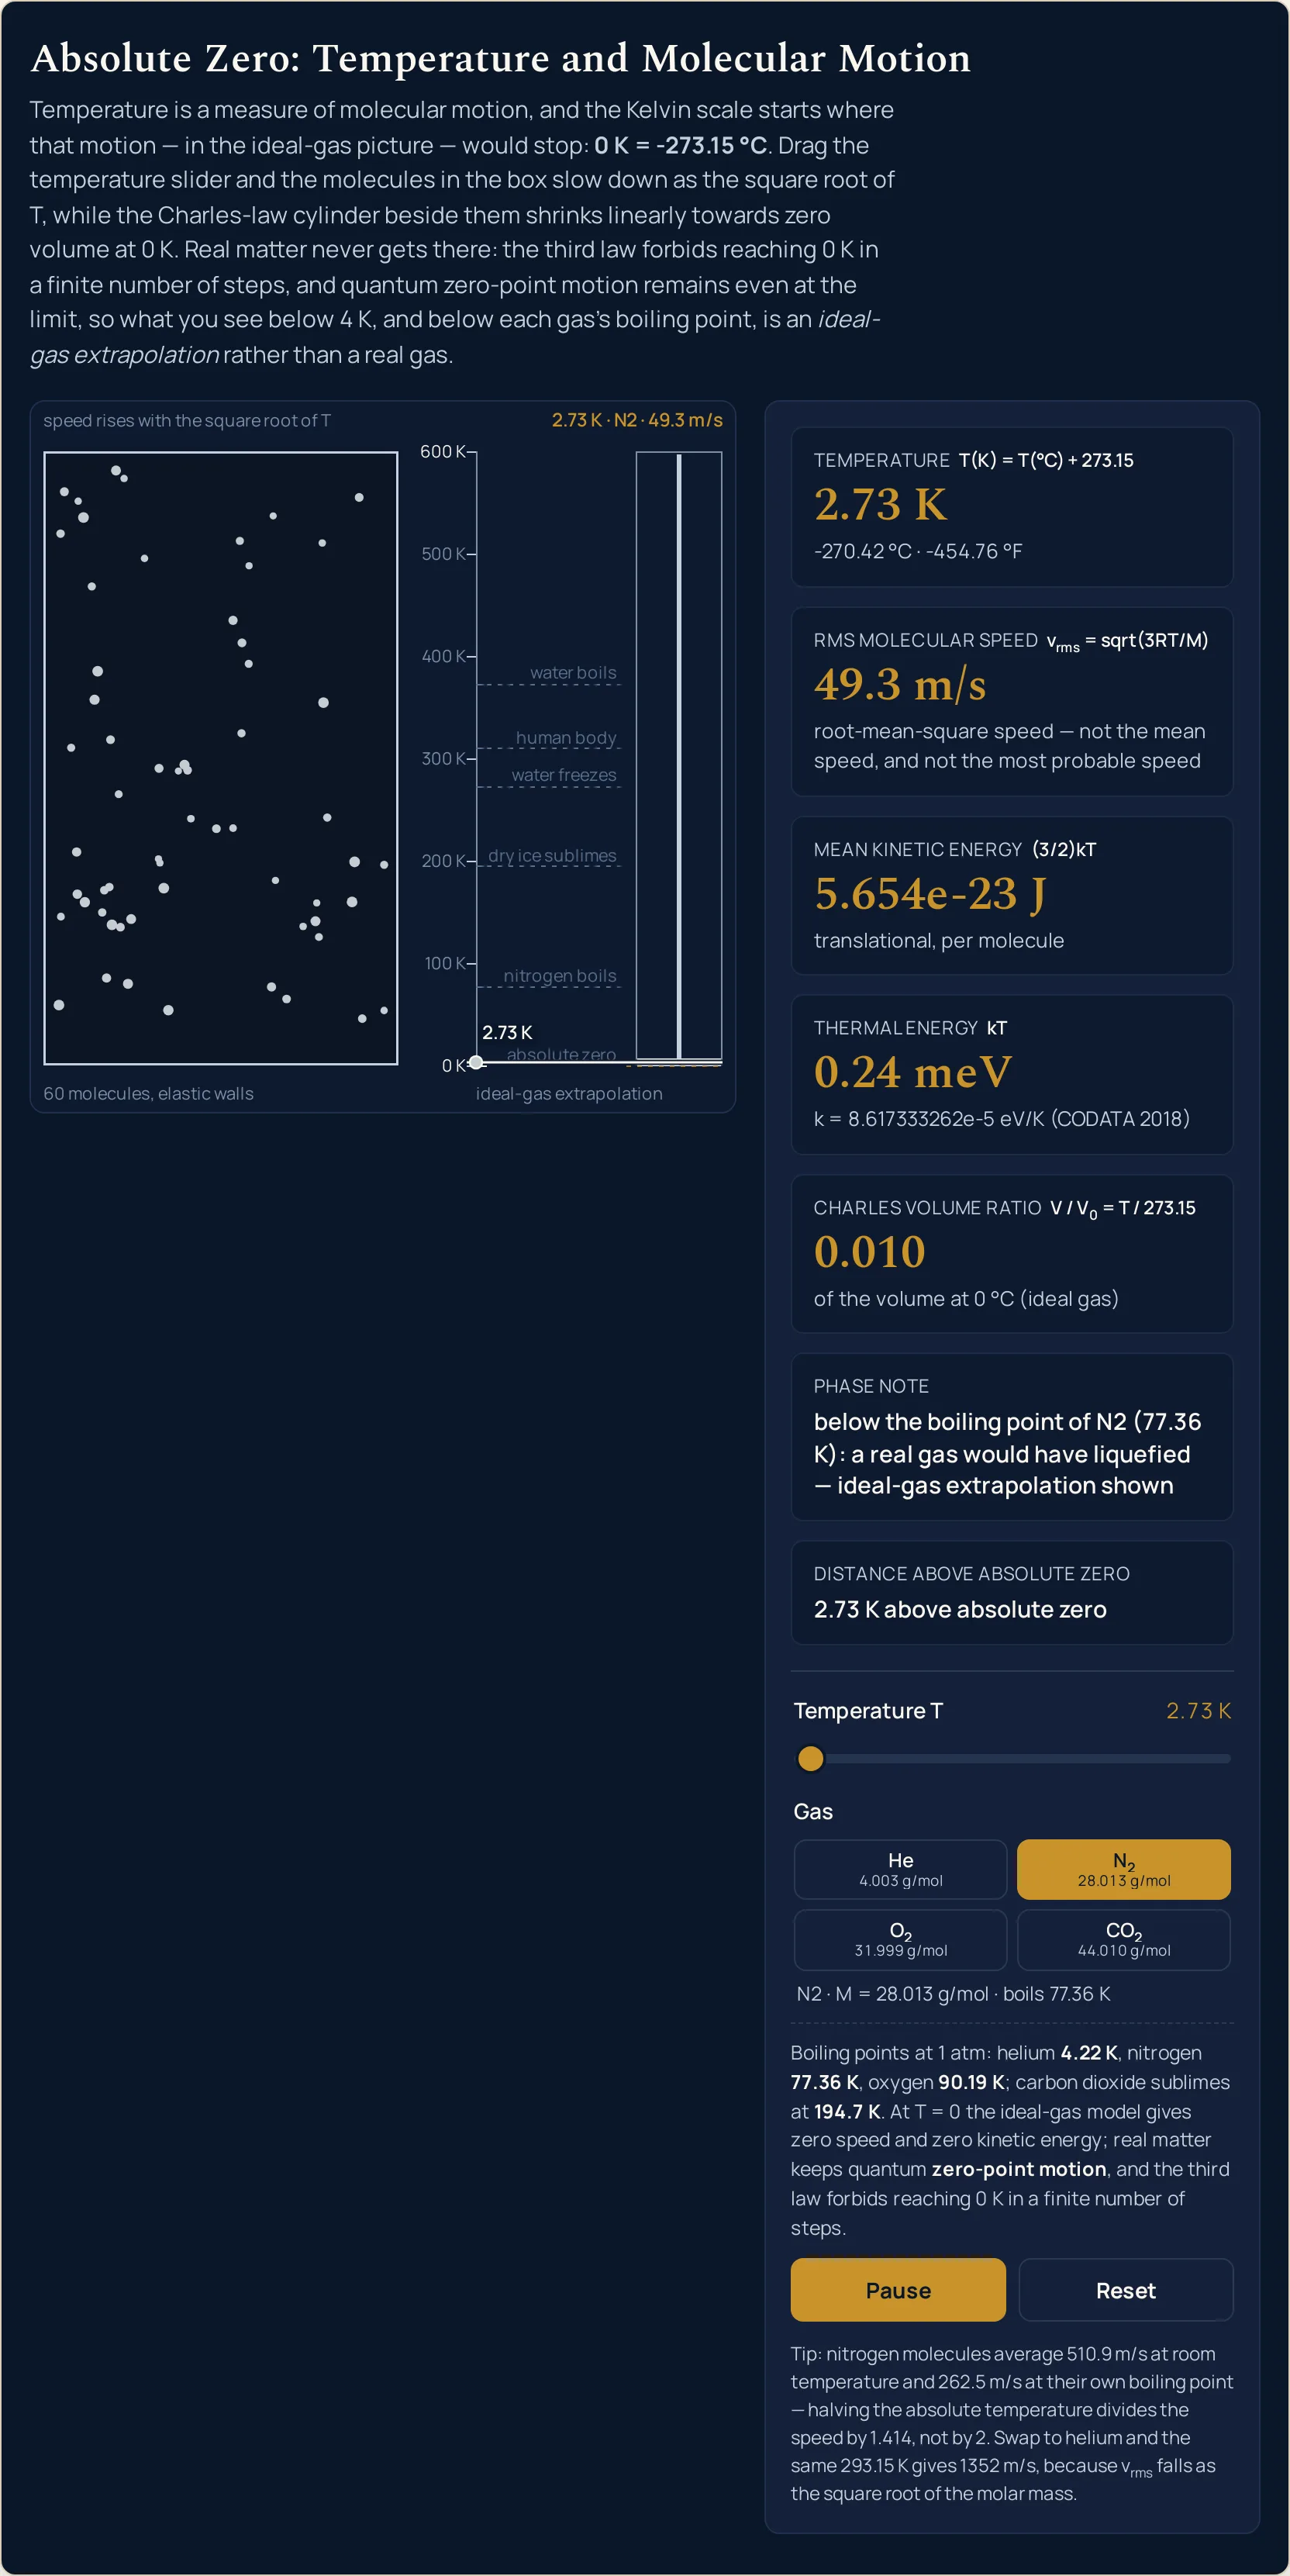
The phase note is worth watching across that row. At 77.36 K exactly it still reads gas, because that is the boiling point rather than a temperature below it; drop one step to 77.35 K and the speed reads 262.4 m/s, the column turns hatched and the note becomes the sentence about a real gas having liquefied. That step tips the same rounding boundary the physics contract's two liquid-nitrogen figures sit either side of, by a different route.
Row 2 to row 3 carries on down to 4.22 K, the boiling point of helium, with nitrogen still selected: 61.3 m/s, 0.36 meV and a volume ratio of 0.015. Row 3 to row 4 reaches the bottom of the slider, where the readouts are 0 m/s, 0 J, 0.00 meV and 0.000, and the molecules in the box hold still. That last row is the ideal-gas limit drawn out to its end, not a description of matter at 0 K.
Rows 5 and 6 change the gas instead. Helium at the same 293.15 K leaves the kinetic energy at 6.071e-21 J, the thermal energy at 25.26 meV and the volume ratio at 1.073, and moves only the speed, from 510.9 m/s to 1352 m/s. Heating that helium to the top of the slider then gives 1934 m/s and a volume ratio of 2.197, the largest either readout reaches here.
The clearest lesson in the lab is that the two columns fall at different rates. Halve the kelvin reading, 293.15 K down to 146.58 K, and the volume ratio does halve, 1.073 to 0.537, but the speed only drops from 510.9 m/s to 361.3 m/s, a division by 1.414. To halve the speed you must quarter the temperature: 73.29 K reads 255.5 m/s. Check it at round numbers if you prefer — 300 K gives 516.8 m/s and 75 K exactly half of it, 258.4 m/s.
Two more positions repay finding. At 273.15 K, where water freezes, the volume ratio reads exactly 1.000, because that is the temperature the ratio is measured against; at 546.30 K, twice that in kelvin, it reads exactly 2.000. The same doubling shows in the energies, 23.54 meV against 47.08 meV, which is a property of the kelvin scale rather than of the gas.
Formula and symbol reference
Four relationships produce everything on the panel: the scale definition T(K) = T(°C) + 273.15, the kinetic-theory result v_rms = sqrt(3·R·T/M), the mean translational energy (3/2)·k·T with its bare form kT, and Charles's law at constant pressure, V/V0 = T/273.15. The ranges marked “in this lab” are the simulator's own displayed values at the control positions named.
| Symbol | Meaning | SI unit | In this lab |
|---|---|---|---|
| T | Absolute temperature, the only thing the slider sets | kelvin, K | 0 to 600 K in this lab, in steps of 0.01 K; 293.15 K after Reset. |
| T(°C), T(°F) | The same temperature on the two relative scales, printed under the kelvin reading | degree Celsius and degree Fahrenheit | 0.00 K reads -273.15 °C and -459.67 °F; 600.00 K reads 326.85 °C and 620.33 °F. |
| M | Molar mass of the gas, fixed by the gas button and never typed | kilogram per mole, kg/mol | 4.003 (helium), 28.013 (nitrogen), 31.999 (oxygen) and 44.010 (carbon dioxide) g/mol, as the gas line prints them. |
| v_rms | Root-mean-square molecular speed, the main readout: sqrt(3·R·T/M) | metre per second, m/s | 0 m/s at 0 K to 1934 m/s (helium at 600 K) in this lab; nitrogen tops out at 730.9 m/s and carbon dioxide at 583.1 m/s. |
| (3/2)kT | Mean translational kinetic energy of one molecule, the same for every gas | joule, J | 0 J at 0 K to 1.243e-20 J at 600 K in this lab; 6.071e-21 J at 293.15 K. |
| kT | Thermal energy scale, printed in millielectronvolts | joule, J (shown in meV) | 0.00 meV at 0 K to 51.70 meV at 600 K in this lab; 25.26 meV at room temperature and 0.36 meV at 4.22 K. |
| V/V0 | Charles volume ratio against the volume at 0 °C, at constant pressure | dimensionless ratio | 0.000 at 0 K, exactly 1.000 at 273.15 K, 2.000 at 546.30 K and 2.197 at the top of the slider. |
| k | Boltzmann constant, the energy that goes with one kelvin | joule per kelvin, J/K | 1.380649e-23 J/K, or the 8.617333262e-5 eV/K the lab quotes under the thermal-energy readout; exact. |
| R | Molar gas constant, k multiplied by the Avogadro constant | joule per mole per kelvin, J/(mol·K) | 8.314462618 J/(mol·K), exact since the 2019 redefinition of the SI; not adjustable. |
| T(boil) | The threshold the phase note watches: the boiling point, or for carbon dioxide the sublimation point, at 1 atm | kelvin, K | 4.22 K helium, 77.36 K nitrogen, 90.19 K oxygen, 194.7 K carbon dioxide, as printed on the gas line. |
The physics: temperature as molecular motion
Temperature, in kinetic theory, is a statement about energy: each molecule of an ideal gas carries a mean translational kinetic energy of (3/2)·k·T, and the lab prints that quantity directly. It is 6.071e-21 J at 293.15 K and 1.602e-21 J at 77.36 K, down by the same factor as the kelvin reading. Press a different gas button and it does not budge, which is the first thing the lab is built to show.
The speed is a second step, and it is where the gas enters. Setting (1/2)·m·v² equal to that mean energy and solving for the speed gives v_rms = sqrt(3·R·T/M), so a heavier molecule carries the same energy more slowly. At 293.15 K the four buttons read 1352, 510.9, 478.0 and 407.6 m/s for helium, nitrogen, oxygen and carbon dioxide.
The square root is why cooling is such slow work in the box. Both the readout and the drawn molecules follow it: the particles at 600 K cover exactly twice the ground per frame that they do at 150 K, and the readouts agree, 730.9 m/s against 365.5 m/s. Taking a gas to a tenth of its speed means taking it to a hundredth of its absolute temperature.
The cylinder on the right runs on the other relationship, Charles's law at constant pressure. The volume of a fixed amount of ideal gas is proportional to the absolute temperature, so the lab draws a piston height proportional to T and prints the ratio against the volume at 0 °C. Follow that straight line downwards and it meets zero volume at one particular temperature, which is where the number -273.15 came from in the first place.
That is the historical route to the value, and it is an extrapolation, not a measurement. Take a dilute gas, measure its volume at a handful of ordinary temperatures, draw the straight line through them and continue it past every temperature you measured until the volume would vanish. Different gases at different pressures give the same intercept, which is what makes it a property of temperature rather than of any one gas.
No gas survives the journey, and the lab is explicit about it. Below the boiling point on the gas line the column is drawn hatched and the phase note names the change the real substance would have undergone, so the part of the line that locates absolute zero is marked as the part nothing can be measured on. What the scale has at its zero is not a measured state but the point the arithmetic of every dilute gas agrees on.
Reading in kelvin is what makes those statements about ratios legal. Because the scale starts at the true zero, doubling the reading doubles the energy and the volume: 273.15 K and 546.30 K give 23.54 and 47.08 meV, 1.000 and 2.000. Do the same in Celsius, 0.00 °C and 273.15 °C, and the ratio is meaningless, which is why every relation the lab uses takes the absolute temperature.
The slider reaches 0.00 K, but nothing else does. The third law of thermodynamics says no finite sequence of cooling steps can bring a system to absolute zero, because each stage removes a smaller share of what is left than the one before it. The zeros at the bottom of the slider are what the ideal-gas model predicts there, and the lab's fixed-values line says as much: real matter keeps its quantum zero-point motion.
Where the ideal-gas picture breaks down
The lab draws one idealised gas at a fixed pressure, with molecules that have no size and no attraction for one another. Most of the scale it covers is a place where no such gas exists, and the readouts are worth reading with that in mind.
- Real gases condense long before 0 K
- Every gas in the lab has a boiling point inside the slider's range, and below it the substance is a liquid or a solid rather than the gas the readouts describe. The phase note and the hatching mark the boundary, but they only track the boiling or sublimation point: by 4.22 K the nitrogen of row 3 would also have frozen solid, and the 61.3 m/s beside it is an ideal-gas figure for something that is no longer a gas.
- Symptom: the lab still printing a speed and a volume ratio for a substance that has already condensed.
- Zero-point motion does not stop
- At 0 K the particles in the box are still and every readout is zero, because the model has no thermal energy left to distribute. Quantum mechanics does not allow the same thing of real matter: a residual zero-point motion survives at the limit, and helium is the substance that shows it best, staying liquid at 1 atm no matter how far it is cooled. The lab's stillness is the end of the thermal motion, not of all motion.
- No intermolecular forces, no molecular volume
- The straight Charles line assumes molecules that occupy no space and ignore each other. A real gas approaching its condensation point does neither: attraction pulls it below the line and the volume the molecules themselves take up eventually pushes it back above. Those are the corrections a van der Waals equation carries and this lab does not.
- The molecules never collide with each other
- The sixty particles bounce off the walls and pass straight through one another, and they all move at the one speed the readout names. A real gas has a broad spread of speeds, maintained by exactly the collisions this drawing leaves out, and the rms value the lab prints is a single number describing that spread. The picture is honest about the speed, not about the distribution.
- One pressure, one gas at a time
- There is no pressure control, so the volume ratio holds only at constant pressure, and the boiling points on the gas line are the values at 1 atm. Raise the pressure on a real sample and both the boiling point and the ratio move. A mixture, air included, has no single molar mass to press a button for.
- The third law forbids the bottom of the slider
- Reaching 0.00 K on the slider takes one drag; reaching 0 K in a laboratory takes infinitely many cooling steps, which is the third law's way of saying it cannot be done. Treat the final row of the worked example as the limit the other rows are heading towards rather than as a state.
- The lab's own limits
- Kelvin and Celsius print to two decimal places and the slider steps in 0.01 K, so 2.725 K is shown as 2.73 K; speeds carry four significant figures at and above 100 m/s and three below it, and the volume ratio three decimal places. The molecule field is illustrative rather than a scale drawing: sixty particles stand in for an enormous number, and their speed on screen is scaled to fit the box, though the ratio between any two temperatures is exact.
Where absolute zero is actually used
- Cryogenic liquids and the separation of air
- The two gas buttons in the middle of the panel carry the numbers an air-separation plant works between: nitrogen boils at 77.36 K and oxygen at 90.19 K, a gap of under 13 K that a distillation column has to exploit. Press each in turn at 77.36 K and the phase note flips from gas for nitrogen to the liquefied sentence for oxygen, which is the separation in one click.
- Superconductivity and superfluidity
- Both effects appear only below a threshold temperature, and the two cryogenic landmarks on the scale are the practical dividing lines. Helium turns superfluid a little above 2 K and the older metallic superconductors need liquid helium at 4.22 K, while the cuprate materials found in the 1980s work above 77.36 K, which is why liquid nitrogen made the subject cheap; verify any particular transition temperature before you quote it.
- Infrared detectors and space telescopes
- A warm detector produces its own signal, and the thermal-energy readout is the scale of it: 25.26 meV at room temperature, 6.67 meV in liquid nitrogen and 0.36 meV in liquid helium, a fall of about seventy between the first and the last. That is why infrared instruments are cooled rather than merely shaded, and why an observatory built for the far infrared carries its detectors at a few kelvin; check the figure for any specific instrument before relying on it.
- The coldest thing in the sky
- The cosmic microwave background is at 2.725 K, the preset the readouts round to 2.73 K, and it sets the temperature that empty space falls to away from any star. No passively cooled instrument gets colder: a telescope shaded from the Sun settles towards a few tens of kelvin, and going below that takes a refrigerator on board.
- Cold-atom physics, below the slider's smallest step
- Laser and evaporative cooling take small clouds of atoms into the nanokelvin range and lower, which is where Bose-Einstein condensates are made; the published record lows are worth verifying before use. The whole of that field happens inside one step of this slider, between 0.00 and 0.01 K, which is the honest way to picture how much room there is at the bottom of the scale.
- Why the gas laws insist on kelvin
- Anything that scales with temperature has to be worked in a scale whose zero is the real one, and the volume ratio is the demonstration: 1.000 at 273.15 K and 2.000 at 546.30 K. Put those two temperatures into a calculation in Celsius, 0 and 273.15, and the arithmetic breaks. It is the same reason the ideal gas law and Charles's law both refuse a Celsius temperature.
Where to go next
To put your own numbers in rather than a slider position, the absolute zero calculator takes a temperature in any of four scales and a molar mass and writes out the substitution. The article Absolute Zero and the Kelvin Scale covers the history and the definition at length, and heat versus temperature settles the distinction the energy readouts depend on. Carry a kelvin figure into the ideal gas law calculator, watch the same straight line from the gas's side in the Charles's law simulator, or browse the whole library of physics simulations.
Frequently asked questions
What does the absolute zero simulator actually show?
It shows what one temperature does to a gas. The slider sets a temperature between 0 K and 600 K, and the lab prints that reading in kelvin, Celsius and Fahrenheit, the root-mean-square molecular speed sqrt(3RT/M), the mean translational kinetic energy per molecule, the thermal energy kT, and the Charles volume ratio against 0 degrees Celsius. The drawing answers too: sixty molecules move at a speed set by sqrt(T), and a piston falls with the temperature marker.
Do the molecules in the box really stop at 0 K?
They stop in the drawing because the ideal-gas model behind it has no thermal energy left to share out, so the speed readout is 0 m/s and every energy readout is zero. Real matter never goes still: quantum zero-point motion remains at the limit, and helium is famous for staying liquid at 1 atm however far it is cooled. Only the heat-driven share of the motion disappears at the bottom of the slider.
Why does halving the temperature not halve the molecular speed?
Because the speed follows sqrt(T), not T. Cool nitrogen from 293.15 K to 146.58 K, half the kelvin reading, and the lab drops from 510.9 m/s to 361.3 m/s, a division by 1.414 rather than by 2. To halve the speed you have to quarter the temperature: 73.29 K reads 255.5 m/s. The energy readouts do halve, because they are proportional to T.
Why is the cylinder hatched at low temperatures?
Because the gas the cylinder draws no longer exists there. Take nitrogen one slider step below its own boiling point, to 77.35 K, and the phase note reads "below the boiling point of N2 (77.36 K): a real gas would have liquefied — ideal-gas extrapolation shown" while the column turns hatched. Carbon dioxide gets the wording it deserves instead: below 194.7 K a real sample would have frozen, because at 1 atm it sublimes.
Why does the volume ratio read exactly 1.000 at 273.15 K?
Because 273.15 K is 0 degrees Celsius, and the ratio the lab prints is the volume compared with the volume at that temperature. Below it the reading is a fraction: 0.500 at 136.58 K, 0.283 at 77.36 K, 0.000 at absolute zero. Above it the gas is larger than its ice-point volume, reaching 1.073 at room temperature, 2.000 at 546.30 K and 2.197 at the top of the slider.
Why does helium move so much faster than carbon dioxide?
Because the speed falls with the square root of the molar mass. At 293.15 K the four gas buttons read 1352 m/s for helium, 510.9 m/s for nitrogen, 478.0 m/s for oxygen and 407.6 m/s for carbon dioxide, and the ratio of the two extremes is the square root of 44.010 divided by 4.003. The energy readouts do not move at all when you press a different button; only the speed does.
Why can the slider not show the 2.725 K of the cosmic microwave background?
Because every kelvin readout in the lab prints two decimal places and the slider moves in steps of 0.01 K, so 2.725 K sits between two positions and is displayed as 2.73 K. Nitrogen there reads 49.3 m/s, 0.24 meV and a volume ratio of 0.010. It is the one landmark on the scale the slider cannot land on exactly; every other one, down to 4.22 K, is a grid point.
Can the simulator go below absolute zero?
No. The slider stops at 0.00 K and the lab clamps anything lower, because there is no colder temperature to describe. Absolute zero is the floor of the kelvin scale by construction, and the third law of thermodynamics says no finite sequence of cooling steps reaches it either, so the bottom of the slider is an arithmetic limit rather than a state anyone has produced.
References & formula source
- Halliday, Resnick and Walker, Fundamentals of Physics, chapter 18 (Temperature, heat and the first law) and chapter 19 (The kinetic theory of gases).
- Young and Freedman, University Physics with Modern Physics, chapters 17 and 18: temperature scales, and the rms speed of a gas.
- NIST, CODATA 2018 recommended values of the fundamental physical constants: the Boltzmann constant, the molar gas constant and the Avogadro constant, all exact since 2019.
- BIPM, The International System of Units (SI), 9th edition: the kelvin defined by fixing the numerical value of the Boltzmann constant.
- Further reading: Absolute zero — Wikipedia