A wide layer of fluid between a warm plate below and a cool plate above, and one question: is any of it actually moving? This thermal convection simulator is a free interactive lab that answers it from three sliders. It opens on air at 20.0 K across a 10.0 mm gap, reads Ra = 2030 against a critical 1708, and returns the verdict CONVECTING — cells.
Now look at the coefficient cell in that opening state: —. So is the Nusselt number, and so is the heat rate. The layer is convecting and the panel still refuses to put a number on it, because no published correlation covers this Rayleigh number — so the flux card prints a floor, q > 52.6 W/m2 upward, rather than a figure. That refusal is what this lab is for.
Thermal Convection: the Onset Lab
A fluid layer heated from below does not convect at all until the Rayleigh number Ra = gβΔT H3 / (να) crosses Rac = 1708. Below that the fluid does not move and heat crosses by conduction alone. Because the gap enters as H3, widening a still-air gap from 10 to 12 mm flips the verdict at the same 15 K — and water, which carries 138 times the Rayleigh number of air at the same ΔT and gap, convects in gaps a fifth as wide.
Load a real fluid layer
Each button presses one of the lab’s own fluid buttons and then writes its three sliders, so every press lands on a known state. Every number you then see is the lab’s own, and the line underneath quotes the cards straight back to you.
The first two differ by one slider and nothing else, which is the whole argument of this page. The third swaps the fluid at the same setting, the fourth is the sign case, and the last is the only one deep inside the published correlation.
Pick a layer above, or drag the sliders yourself.
What Is the Thermal Convection Simulator?
The thermal convection simulator is a free interactive physics lab that runs in your browser, with nothing to install and no sign-up. It draws a wide horizontal fluid layer in cross-section, heated by the plate below it and cooled by the plate above it, beside a plot of the Rayleigh number against the temperature difference with a fixed line drawn at Rac = 1708. The question it answers is whether the fluid is moving at all.
Three sliders and two buttons drive it, each printing its own setting beside its name. Temperature difference runs -20 to 80 K in steps of 0.5 and opens at 20.0 K; Layer height runs 2 to 40 mm in steps of 0.5 and opens at 10.0 mm; Plate area runs 0.05 to 4 m2 in steps of 0.05 and opens at 1.00 m2. Two buttons choose the fluid in the gap, Air or Water.
Four cards carry the answer. The headline is the Rayleigh number to three significant figures with its ratio to the critical value underneath, then the Verdict, then the Onset - the temperature difference this gap would need, and the gap width this difference would need - and then the heat flux across the layer. At the opening setting they read 2030, Ra / Rac = 1.19, CONVECTING — cells, 16.8 K and q > 52.6 W/m2 upward.
Read that last card again, because it is the one thing this lab exists to show. The opening state is above the threshold and convecting, and the panel still refuses to print a Nusselt number, a coefficient or a heat rate: Nu, h and Q all read an em dash. Between Ra = 1708 and 1.5e5 there is no published correlation to use, so the flux is given as a floor the true value lies above, and never as a number.
The threshold itself is the first result, and one slider makes it visible. Set the fluid to air, the difference to 15.0 K and the gap to 10.0 mm: the Rayleigh card reads 1520, the verdict reads STILL — conduction only, and the flux card reads an exact q = 39.5 W/m2 upward carried by conduction alone. Widen the gap to 12.0 mm and nothing else, and the verdict flips to CONVECTING — cells while the flux card falls to q > 32.9 W/m2 upward. A thicker gap conducts less, so a wider gap is not automatically a better conductor of heat.
Swapping the fluid is the other half of it. Put water in the same 10.0 mm gap at the same 15.0 K and the Rayleigh card jumps to 2.10e5 - a hundred and twenty-three times the critical value - the band cell reads band 2: Globe & Dropkin correlation, and the withheld cells come back with real figures: Nu 4.74, h 286 W/(m2·K) and q = 4280 W/m2 upward. The Onset card reads 0.122 K, so water in that gap convects at a difference you could not feel.
Drag the temperature difference below zero and the lab says what has happened rather than printing a negative number. The verdict card reads HEATED FROM ABOVE — stable, the Rayleigh card reads 0, and heat still crosses the gap downward by conduction: at -15.0 K over a 20.0 mm gap the flux card reads q = 19.7 W/m2 downward. The flux is always a magnitude plus a direction word, because a negative number beside the word stable reads as a fault.
A compact grid under the cards holds the eight quantities the four cards are built from — the Nusselt number, the Prandtl number, the coefficient h, the conductivity k, the kinematic viscosity, the thermal diffusivity, the expansion coefficient and the heat rate Q — and names the correlation band in a ninth cell. For air they read 0.697 for the Prandtl number and 0.0263 W/(m·K) for the conductivity; for water, 6.96 and 0.603 W/(m·K). Three of those cells withhold in band 1 and the rest never do.
A caption strip under the drawing writes out which of the cases is on screen and why, in its own words rather than as a repeat of the cards, and a standing line beneath it carries the conditions every reading depends on. Rac = 1708 is the rigid-rigid, wide-layer value, both surfaces no-slip; the correlation band runs from 1.5e5 to 6.8e8; and the fluid properties are quoted at 20 °C and really do vary with temperature, so a 60 K reading is an estimate.
What the lab leaves out, stated as omissions rather than as assumptions that happen to hold. There is one geometry only - a wide horizontal layer heated from below - so no vertical plate, no pipe and no three-mode comparison. There is no time in it either: this is the steady state and not the approach to it, so nothing here is a cooling curve.
The rolls in the drawing are a schematic whose count and arrow size rise with the Rayleigh number, not a computed cell width. Nothing on the panel is a measurement: every digit is arithmetic on three slider positions and a fluid button, so verify any figure against your own source before you use it.
| Control | Range | Step, default and what it moves |
|---|---|---|
| Temperature difference | -20 to 80 K | steps of 0.5 K, opening on 20, where the read-back beside the slider says "20.0 K". It is the difference across the layer, so degrees Celsius and kelvin are the same number here. It enters the Rayleigh number linearly, which makes it the slider to drag first: with air in a 10.0 mm gap the verdict flips from STILL to CONVECTING somewhere between 16.5 and 17.0 K, and the Onset card names the exact figure, 16.8 K. The range deliberately goes negative so the heated-from-above case is reachable rather than merely guarded - at -15.0 K over 20.0 mm the layer is stable and the flux card reads 19.7 W/m² downward |
| Layer height | 2 to 40 mm | steps of 0.5 mm, opening on 10, where the read-back says "10.0 mm". This is the control the lab is built around, because the gap enters the Rayleigh number as its CUBE: doubling it multiplies the Rayleigh number by exactly eight, from 1520 at 10.0 mm to 12200 at 20.0 mm with air at 15.0 K. Widening the gap therefore flips the verdict and LOWERS the flux at the same time, from an exact 39.5 W/m² at 10.0 mm to a floor of 32.9 W/m² at 12.0 mm, because a thicker layer conducts less. Inside the correlation band the gap cancels out of the coefficient h altogether |
| Plate area | 0.05 to 4 m² | steps of 0.05 m², opening on 1, where the read-back says "1.00 m²". It is the one control that is not in the Rayleigh number at all, so it moves neither the verdict nor the flux: dragging it from end to end with water at 15.0 K in a 10.0 mm gap leaves the flux card at 4280 W/m² in every position and moves only the heat rate cell, from 214 W to 17100 W. It is there so the per-square-metre reading and the watts reading can be told apart, which is the commonest place this topic goes wrong by a factor of the area |
| Fluid in the gap | two buttons | the first is labelled "Air" and is pressed at boot; the second is labelled "Water". They swap the whole property set - conductivity, viscosity, diffusivity, expansion coefficient and Prandtl number - and the Prandtl cell is the quickest way to see that something changed, 0.697 for air against 6.96 for water. The same gap and the same temperature difference give a Rayleigh number a hundred and thirty-eight times larger in water, which is why water convects in gaps about a fifth as wide. Neither button changes its label, and there is no third fluid |
How to use the thermal convection definition simulator
- Read the four cards before you touch anything. They are already answering, for air at
20.0 Kacross a10.0 mmgap: Rayleigh number2030, withRa / Rac = 1.19under it; VerdictCONVECTING — cells; Onset16.8 K, withHonset = 9.44 mm at this ΔT; and the heat fluxq > 52.6 W/m2 upward. - Now read the grid underneath, because three of its cells are empty. Nusselt number, Coefficient h and Heat rate all print
—in the state the lab opens in, and the Correlation band cell says why:band 1: cellular, no published correlation. There is no opening value of h on this panel to quote, and that is deliberate. - Press Still air in a 10 mm gap to go the other way across the threshold. The difference drops to
15.0 Kand the verdict changes toSTILL — conduction only:Ra = 1520, which is0.892of the critical value. Now the grid fills in —Nu 1.00,h 2.63 W/(m2·K),Q 39.5 W— and the flux card prints an exactq = 39.5 W/m2 upward. - Press Widen the gap to 12 mm, which moves one slider and is the most useful click on the page. The gap goes
10.0to12.0 mm,Ragoes1520to2630, the verdict flips toCONVECTING — cells— and the flux card falls, toq > 32.9 W/m2 upward. A thicker layer conducts less, so a better verdict is not more heat. - Drag the gap slider by hand from
2.0to40.0 mmand watch the right-hand plot. The gold marker climbs the curve and crosses theRa_c = 1708line between10.0and10.5 mm. The Onset sub-line holds atHonset = 10.4 mmthe whole way, because it answers for the temperature difference rather than for the gap. - Press Water, same gap, same heat. Nothing changes but the fluid, and
Rajumps from1520to2.10e5. That clears the correlation floor of1.5e5, so the three withheld cells come back with real figures:Nu 4.74,h 286 W/(m2·K)andq = 4280 W/m2 upward. The Onset card now reads0.122 K. - With water still loaded, drag the temperature difference up from
1.0 K. The flux card is a floor until10.5 K, then turns into a figure at11.0 K. Watch the Coefficient h cell from there:258,286,314,396,453,499 W/(m2·K)as you climb to80.0 K. It is not a constant. - Drag the temperature difference below zero. The verdict changes to
HEATED FROM ABOVE — stable, the Rayleigh card reads an exact0, the two plate labels and their colours swap, and no marker is drawn in the plot at all. Heat still crosses: at-15.0 Kover20.0 mmthe flux card readsq = 19.7 W/m2 downward. - Drag Plate area A and notice what does not move. From
0.05to4.00 m2the Rayleigh card, the verdict, the onset and the flux card all hold exactly where they were. Only the Heat rate cell changes, running214 Wto17100 Wwith water at15.0 K. Area is not in the Rayleigh number. - Read the caption strip under the drawings last. It writes the current case out as a sentence of its own rather than repeating the cards, and the standing line beneath it carries the conditions: that
1708is the rigid-rigid wide-layer value, that band 1 withholds on purpose, and that the properties are quoted at20 °C.
Dragging is the right way to find out which readings move together and a poor way to land on a particular state, because the gap slider alone has 77 positions. The five preset buttons above exist for that, and the thermal convection guide is where the subject itself is argued from scratch, with the definition, the threshold derived and five problems worked step by step.
What this panel cannot do is answer at a surface rather than across a layer. It has no surface temperature and no bulk fluid temperature, so a question that hands you a coefficient and asks for a heat rate — or hands you a rate and asks for the coefficient — belongs to the thermal convection calculator, which solves Newton’s law in five directions and prints the working for each.
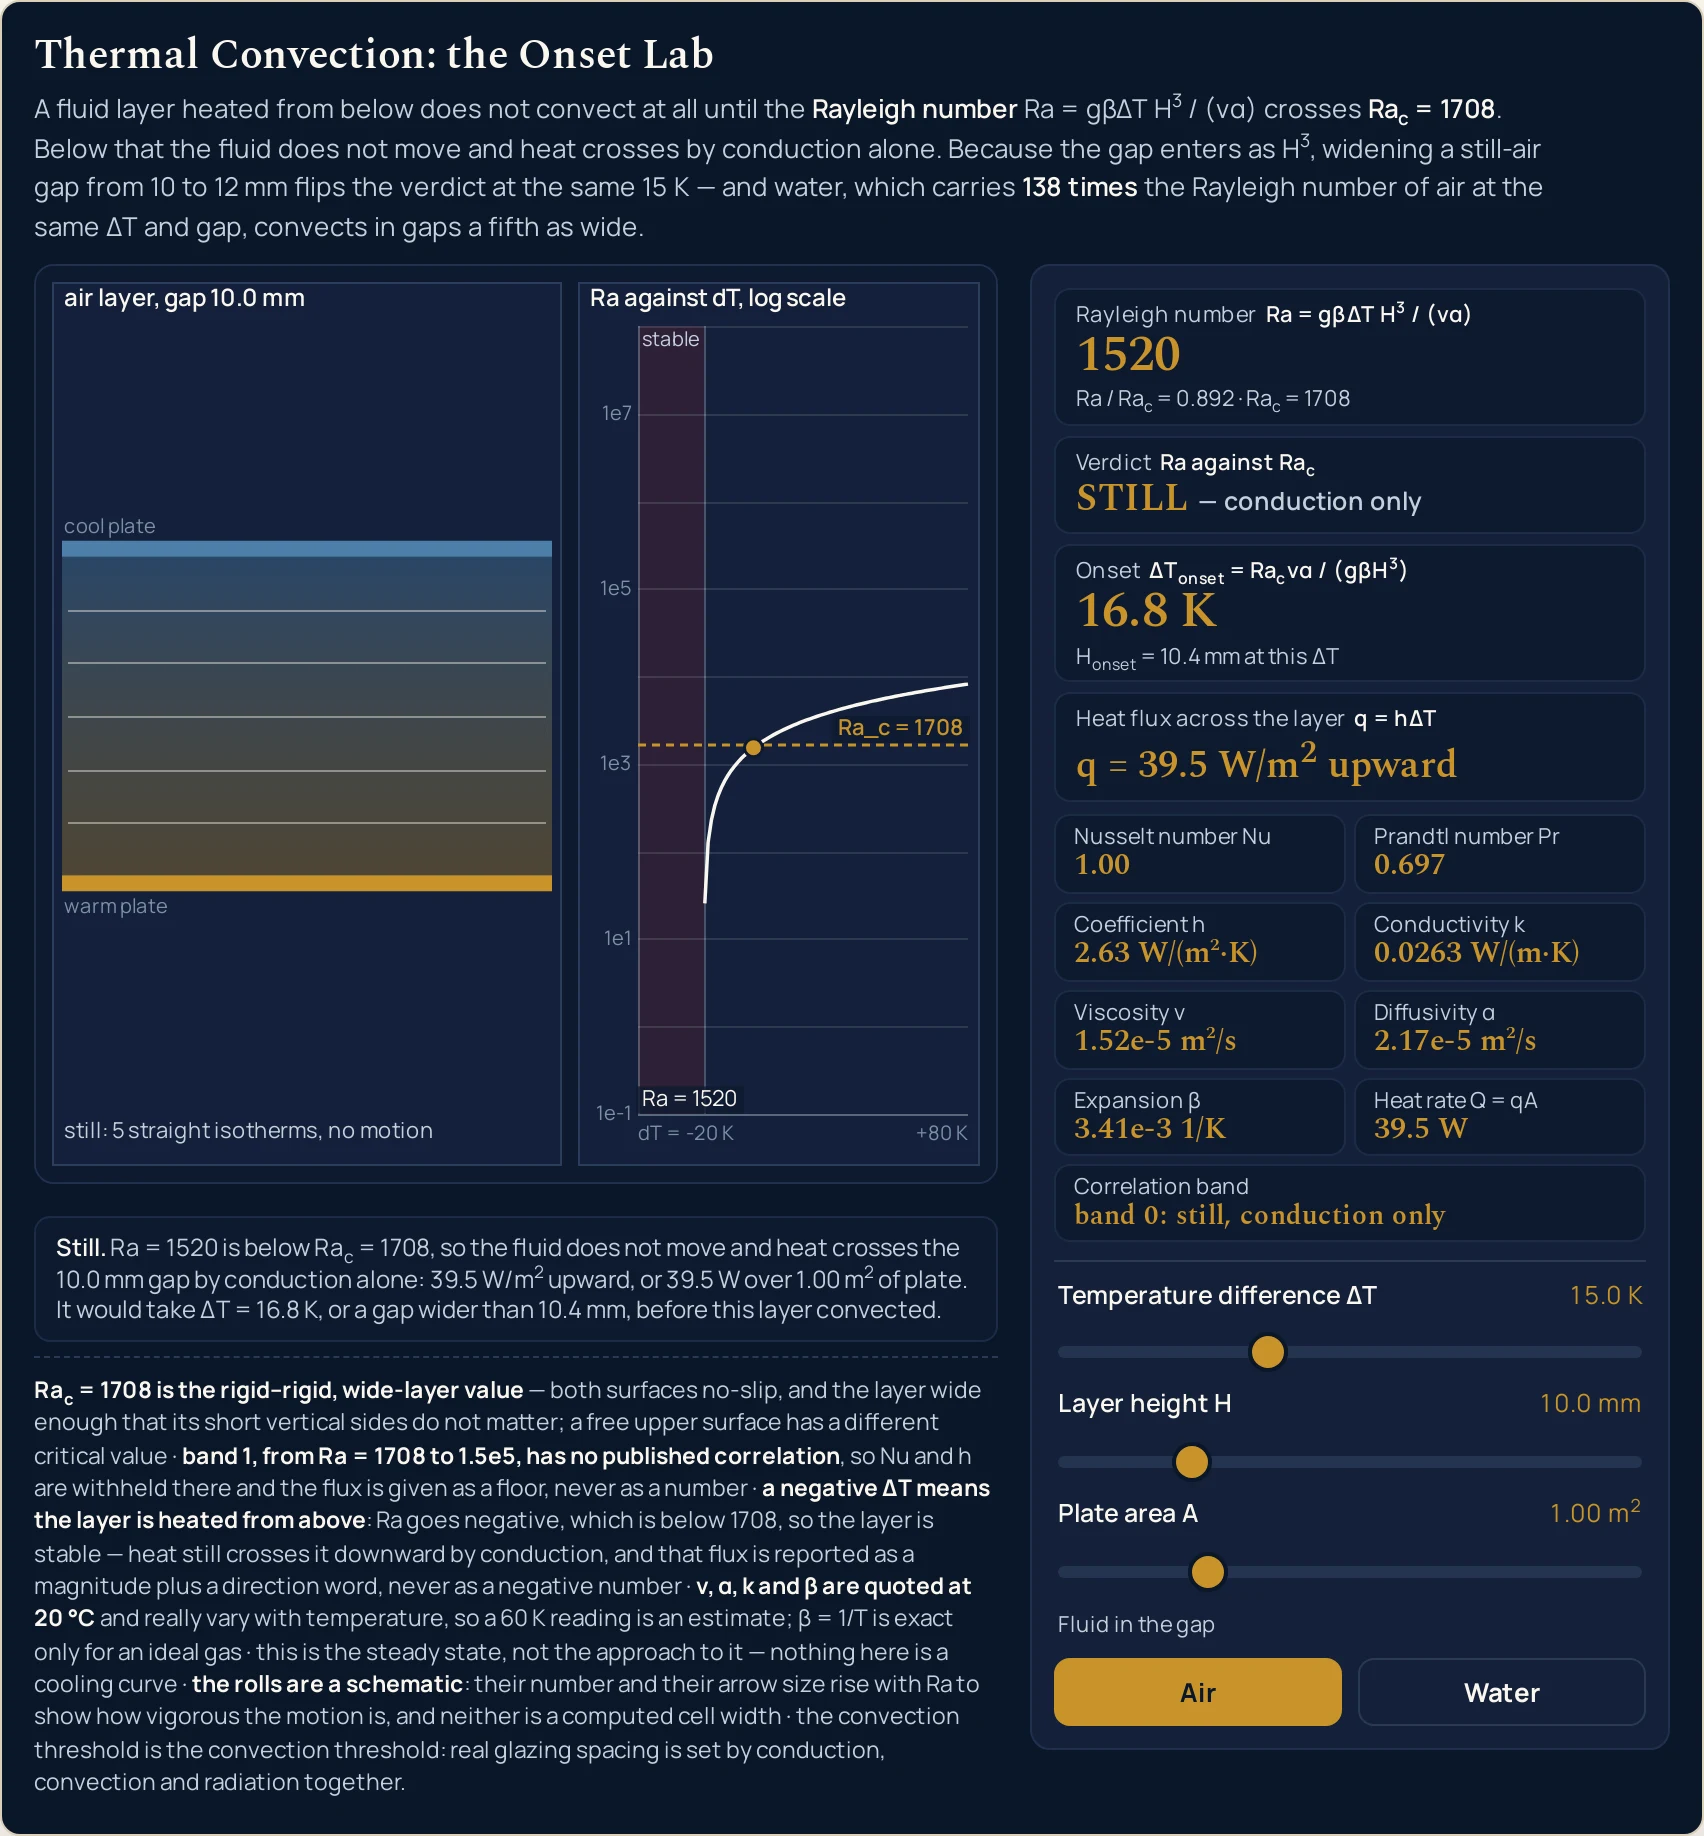
Ra = 1520 is 0.892 of the critical value, so the left drawing carries straight isotherms and no arrows, the marker in the right-hand plot sits just below the Ra_c = 1708 line, and the flux card prints an exact q = 39.5 W/m2 upward. The plot writes Ra_c in ASCII, because a canvas has no markup to draw a subscript with.Worked example: change one thing at a time
Nothing in the three tables below was worked out here. Each row is a state the lab was put into through its own sliders and then read back from, cell by cell, and a reading is quoted whole rather than tidied: verdicts with their qualifier, fluxes with their direction word, since the panel never carries a sign. Three kinds of cell are trimmed to fit their column — the two sub-lines drop their trailing clause, and the sweep tables give the band and the coefficient as a figure alone. The first table is one click: the gap slider, 10.0 to 12.0 mm, with the fluid and the 15.0 K left alone.
One: the gap slider, and nothing else
Twelve readings, two states, one control moved. Read the verdict row and the flux row together, because they move in opposite directions and that is the result.
| Reading on the panel | Gap at 10.0 mm | Gap at 12.0 mm | What moved, and why |
|---|---|---|---|
| Gap slider read-back | 10.0 mm |
12.0 mm |
the only control touched — the fluid and the 15.0 K stay exactly where they were |
| Rayleigh number card | 1520 |
2630 |
up, because the gap enters Ra as H3 |
| The ratio under it | Ra / Rac = 0.892 |
Ra / Rac = 1.54 |
the one number that matters crosses 1 |
| Verdict card | STILL — conduction only |
CONVECTING — cells |
the flip. One slider, half a millimetre at a time |
| Onset card | 16.8 K |
9.73 K |
the difference this gap would need: lower, because a wider gap convects more easily |
| The line under it | Honset = 10.4 mm |
Honset = 10.4 mm |
unchanged — it answers for the 15.0 K, not for the gap, and 10.4 sits between the two columns |
| Heat flux card | q = 39.5 W/m2 upward |
q > 32.9 W/m2 upward |
falls, and stops being a number. A thicker layer conducts less |
| Nusselt number cell | 1.00 |
— |
exactly 1 when nothing moves; withheld once something does |
| Coefficient h cell | 2.63 W/(m2·K) |
— |
the first figure is only k/H dressed as a coefficient |
| Heat rate cell | 39.5 W |
— |
the flux over 1.00 m2, and then nothing to multiply |
| Correlation band cell | band 0: still, conduction only |
band 1: cellular, no published correlation |
the cell that explains the three dashes above it |
| Cells in the drawing | none — five straight isotherms | two counter-rotating rolls | the caption counts what was drawn and never names rolls that are not there |
A 20 per cent wider gap gets a better verdict and carries less heat, and that pairing is the single most useful thing on this page. The verdict improves because Ra rose past 1708. The flux fell because the conduction floor is the conductivity times the difference divided by the gap, and the gap went up. Those two facts do not fight: the cells now carry more than that lower floor, and the panel will not say how much more.
So the honest answer to “is a wider gap always better” is no, and this pair is where you can see it rather than take it on trust. The only quantity that is unambiguously better at 12.0 mm is the verdict. Below the threshold the mechanism is Fourier’s law and nothing else, which the Fourier's law guide sets out properly, and the Fourier’s law simulator puts on its own screen.
Two: the gap from end to end, with the heat held still
Now the fluid stays air, the difference stays 15.0 K and the plate stays 1.00 m2, and only the gap slider moves. The 10.5 mm row is in the table because it is the first reachable step above the onset gap of 10.4 mm, so the flip is bracketed rather than asserted.
| Gap slider | Rayleigh card | Verdict card | Heat flux card | Coefficient cell | Band cell | What the layer is doing |
|---|---|---|---|---|---|---|
| 2.0 mm | 12.2 |
STILL — conduction only |
q = 197 W/m2 upward |
13.2 |
band 0 | the narrowest the slider goes, and the most heat of any row — conduction over a short distance |
| 6.0 mm | 329 |
STILL — conduction only |
q = 65.8 W/m2 upward |
4.38 |
band 0 | still a fifth of the way to the threshold, with Ra up 27-fold for a 3-fold gap |
| 10.0 mm | 1520 |
STILL — conduction only |
q = 39.5 W/m2 upward |
2.63 |
band 0 | the first preset: 0.892 of the critical value, and nothing is moving |
| 10.5 mm | 1760 |
CONVECTING — cells |
q > 37.6 W/m2 upward |
— |
band 1 | one step of the slider later, and the verdict has changed |
| 12.0 mm | 2630 |
CONVECTING — cells |
q > 32.9 W/m2 upward |
— |
band 1 | the second preset, and the flux is now a floor rather than a figure |
| 20.0 mm | 12200 |
CONVECTING — cells |
q > 19.7 W/m2 upward |
— |
band 1 | double the gap of the first preset: Ra is exactly eight times 1520 |
| 40.0 mm | 97500 |
CONVECTING — cells |
q > 9.86 W/m2 upward |
— |
band 1 | the far end of the slider, and still short of the correlation floor of 1.5e5 |
The flux falls monotonically down that table while the Rayleigh number rises eight-thousand-fold, and it never stops falling at the flip. 197 at 2.0 mm, 39.5 at 10.0 mm, 9.86 W/m2 at 40.0 mm. The verdict changes once, between the third and fourth rows. Nothing else on the panel changes its mind anywhere.
Two rows are worth checking against each other with a calculator, because they are the cube law. 10.0 mm gives Ra = 1520 and 20.0 mm gives 12200 — eight times, for twice the gap, because the gap is cubed. The onset figures in the same two states run the other way, 16.8 K against 2.10 K, which is the same factor of eight inverted.
Four of the seven rows withhold the coefficient, and the last one is the reason band 1 has to be labelled rather than estimated. At the far end of the slider air at 15.0 K is still only at Ra = 97500, against a correlation floor of 1.5e5: every row of this table sits inside the gap in the published literature. The quantity in the denominator that keeps it there is the thermal diffusivity, which the thermal diffusivity guide builds up from a conductivity, a density and a specific heat.
Three: water, one gap, and the coefficient refusing to sit still
The fluid is water, the gap stays 10.0 mm and the plate stays 1.00 m2, and only the temperature difference moves. This is the table that answers the question the formula hides: once the layer is convecting, is the coefficient a number you can look up?
| Difference slider | Rayleigh card | Nusselt cell | Coefficient cell | Heat flux card | Band cell | What the layer is doing |
|---|---|---|---|---|---|---|
| 1.0 K | 14000 |
— |
— |
q > 60.3 W/m2 upward |
band 1 | already convecting at one kelvin — the onset card reads 0.122 K |
| 5.0 K | 70100 |
— |
— |
q > 301 W/m2 upward |
band 1 | the floor rises exactly in proportion, because a floor is Fourier |
| 10.5 K | 1.47e5 |
— |
— |
q > 633 W/m2 upward |
band 1 | the last withheld row, one step below the correlation floor |
| 11.0 K | 1.54e5 |
4.27 |
258 |
q = 2830 W/m2 upward |
band 2 | the correlation starts, and the flux is 4.5 times the floor above it |
| 15.0 K | 2.10e5 |
4.74 |
286 |
q = 4280 W/m2 upward |
band 2 | the third preset — the same gap and the same heat as the first, in water |
| 20.0 K | 2.80e5 |
5.21 |
314 |
q = 6290 W/m2 upward |
band 2 | the difference is up a third from the row above and the coefficient is up a tenth |
| 40.0 K | 5.61e5 |
6.57 |
396 |
q = 15800 W/m2 upward |
band 2 | double 20.0 K, and the flux is rather more than double |
| 80.0 K | 1.12e6 |
8.28 |
499 |
q = 39900 W/m2 upward |
band 2 | the top of the slider: the coefficient has nearly doubled since 11.0 K |
The coefficient cell runs from 258 to 499 W/(m2·K) down that table, with nothing changed but how hot the lower plate is. It nearly doubles. Any calculation that takes a single tabulated coefficient and carries it across that whole range of differences is out by a factor approaching two at one end of it.
The step between the third and fourth rows is the other reason to read this table. At 10.5 K the panel can only say q > 633 W/m2; one step of the slider later it says q = 2830 W/m2. The floor was not nearly the answer — the real flux is about four and a half times it. A floor is a bound, not an estimate, and this is the clearest demonstration of that the panel can give.
Formula and symbol reference
The band at the head of this page carries one comparison, and every reading on the panel is one side of it, a factor inside it, or a consequence of which side won. The flux is the only quantity computed two different ways, and which way depends entirely on the verdict.
The symbol column below uses the panel’s own names, and the “in this lab” column gives each slider’s real end stops with the readings measured at those positions. Eight of the rows are not controls at all: they are computed, fixed, or one of two values set by the fluid button.
| Symbol | What it is | SI unit | In this lab |
|---|---|---|---|
| Ra | Rayleigh number: buoyancy divided by the two things that damp it, viscosity and thermal diffusion. It is the whole question this lab asks, and it is dimensionless | none — a ratio | the headline card, three significant figures. It opens at 2030. Across the slider corners measured this pass it runs from an exact 0 at any difference of zero or below, through 12.2 (air, 15.0 K, 2.0 mm), up to 7.18e7 with water at the top of both sliders — the widest the controls reach. |
| Rac | The critical value the verdict card compares against: the Rayleigh number at which a layer heated from below stops conducting and starts turning over | none — a ratio | fixed at 1708, printed on the sub-line of the headline card, drawn as a labelled horizontal line in the right-hand plot, and never moved by any control. It is the rigid-rigid, wide-layer value, which the panel states in a standing line of its own. |
| ΔT | Temperature difference across the layer. It is a difference, so degrees Celsius and kelvin are the same number here | K | the first slider, -20 to 80 K in steps of 0.5, opening on 20.0 K. Negative is a legal, meaningful setting rather than an error: it is the heated-from-above case, and it is the fourth preset. Note that the onset figure 16.8 K is not a reachable slider position — the grid gives 16.5 and 17.0, which is how the flip gets bracketed. |
| H | Layer height: the gap between the warm plate and the cool one. The control this lab is built around | m in the formula, mm on the slider | the second slider, 2 to 40 mm in steps of 0.5, opening on 10.0 mm. It enters Ra as H3, so doubling it multiplies the card by exactly eight: 1520 at 10.0 mm and 12200 at 20.0 mm, with air at 15.0 K. |
| A | Plate area: how much of the layer you are accounting for. The only control that is not in the Rayleigh number at all | m2 | the third slider, 0.05 to 4 m2 in steps of 0.05, opening on 1.00 m2. It moves the heat rate cell and nothing else: with water at 15.0 K in a 10.0 mm gap the flux card holds at q = 4280 W/m2 from end to end while the rate runs 214 W to 17100 W. |
| Nu | Nusselt number: how much more heat the moving fluid carries than the same layer would carry by conduction alone. One means no improvement at all | none — a ratio | a grid cell, three significant figures, and the cell most worth watching. Exactly 1.00 whenever the verdict is STILL or HEATED FROM ABOVE; an em dash through the whole of band 1; and from 3.59 (air, 23.5 K, 40.0 mm, the first band-2 state found on the air side) up to 33.1 at the water corner. |
| h | Convective coefficient: the flux the layer carries per kelvin of difference, per square metre. This is the figure every other page on this topic treats as a lookup value | W/(m2·K) | a grid cell, Nu·k / H. An em dash through band 1, including the state the lab opens in. Elsewhere it runs from 0.657 W/(m2·K) (air at 40.0 mm, where it is just k/H) to 499 W/(m2·K) (water at 80.0 K, at any gap). In band 0 it carries no convection at all. |
| q | Heat flux across the layer: watts per square metre, and the quantity the fourth card reports | W/m2 | the fourth card, always a magnitude plus a direction word. An exact 0 with the words no temperature difference at ΔT = 0; a floor written q > through band 1, measured as low as 0.329 W/m2 (air, 0.5 K, 40.0 mm); and a figure up to 39900 W/m2 with water at 80.0 K. |
| Q | Heat rate: the flux multiplied by the plate area. Watts, not joules — it is a rate | W | a grid cell. An em dash wherever the flux is a floor, because a floor times an area is still a floor and the panel will not dress one as a product. Measured at 0.658 W (air, -20.0 K, 40.0 mm, 0.05 m2) and at 1.60e5 W with water at the corner of all three sliders, which is the largest figure the cell can print. |
| Pr | Prandtl number: how much more readily the fluid carries momentum than heat. It is why the two fluids behave so differently at the same setting | none — a ratio | a grid cell with exactly two values, because there are exactly two fluids: 0.697 for air and 6.96 for water. It is the quickest confirmation that a fluid button did something. Both sit well inside the correlation’s own 0.02 to 8750 window. |
| k | Thermal conductivity of the fluid: the figure Fourier’s law uses, and the one that sets the floor under every convecting state | W/(m·K) | a grid cell, two values: 0.0263 W/(m·K) for air and 0.603 W/(m·K) for water, both quoted at 20 °C. The 23-fold gap between them is most of the reason the two fluids read so differently. |
| ν and α | Kinematic viscosity and thermal diffusivity: the two quantities that damp the overturning, and the two that sit in the denominator of the Rayleigh number | m2/s | two grid cells. Air reads 1.52e-5 m2/s and 2.17e-5 m2/s; water reads 1.00e-6 m2/s and 1.44e-7 m2/s. Their ratio is the Prandtl cell above, and their product is what makes water’s Rayleigh number so much larger. |
| β | Thermal expansion coefficient: how much the fluid swells per kelvin, which is where the buoyancy in the numerator comes from | 1/K | a grid cell, two values: 3.41e-3 1/K for air and 2.07e-4 1/K for water. The air figure is exact for an ideal gas at 20 °C; the water figure is tabulated, and it is the one number in this cluster to verify against your own source before you use it. |
The gap is millimetres on the slider and metres inside the relation, and that is the conversion most often dropped by hand. Because the gap is cubed, getting it wrong by a factor of a thousand is a factor of a thousand million on the Rayleigh number — the difference between 1520 and a figure no fluid has. The panel applies the conversion for you and prints the slider in millimetres because that is the scale a real gap is quoted at.
Two of the symbols in that table collide with other pages on this site and are worth separating before you substitute. The expansion coefficient here is the volumetric one for a fluid, in reciprocal kelvin, not the linear one a solid is quoted with. And the kinematic viscosity is the dynamic viscosity divided by the density: the viscosity simulator is where that quantity is the subject rather than a denominator, and the density guide is where the density it divides by is.
The physics of a convecting layer
You can watch the competition the Rayleigh number measures without any algebra, using one slider. Heating the bottom of the layer makes the fluid there less dense, so it wants to rise; viscosity resists the motion and thermal diffusion leaks the temperature difference away before the parcel can get anywhere. The Rayleigh number is the first of those divided by the other two, and 1708 is where the first one wins.
That is why the gap matters so much more than anything else on the panel. A thicker layer gives a rising parcel further to travel before it reaches the cool plate, which is time for buoyancy to act and distance for it to accelerate over, while the diffusion that would erase the difference has three dimensions of fluid to spread through. The net result is the cube in the relation, and the cube is why 10.0 and 12.0 mm are on opposite sides of a threshold at the same temperature difference. The buoyancy that drives all of it is the same density change Archimedes' principle describes, and the buoyancy simulator is where that force is the subject.
The Nusselt number is the cleanest reading on the panel, because it is a comparison rather than a quantity. It is the heat the layer actually carries divided by the heat the same layer would carry by conduction alone, so 1.00 means the fluid is contributing nothing and 22.6 means it is carrying twenty-two times what a still layer would. The grid prints it beside the coefficient so the two can be read together.
And that pairing turns up something the formula hides: inside the correlation band the gap drops out of the coefficient entirely. Put water at 60.0 K in a 10.0 mm gap and the panel reads Nu 7.52 with h 453 W/(m2·K). Widen the gap to 30.0 mm and the Nusselt cell triples, to 22.6 — while the coefficient cell does not move at all. It is still 453.
That is not a coincidence and it is not a bug. The coefficient is the Nusselt number times the conductivity divided by the gap; the Nusselt number rises in proportion to the gap in this band, so the gap cancels. What the gap still changes is the Rayleigh number, 8.41e5 against 2.27e7 in those two states, and therefore how vigorous the drawing gets: six rolls against eight.
The band labels are the panel being honest about where published knowledge stops. Band 0 is analytic — below the threshold the Nusselt number is exactly one, because nothing is moving. Band 2 is a published correlation for wide layers between a heated lower plate and a cooled upper one, valid from 1.5e5 to 6.8e8. Band 1 is the gap between those two, where cells demonstrably exist and no correlation covers them, so the panel withholds rather than interpolating.
For air at the gap a window actually uses, that hole in the literature is the whole lab. Air in a 10 mm gap would need a temperature difference of 1.48e3 K to reach the correlation floor, where water in the same gap gets there at 10.7 K. Air does reach band 2 on this panel — take the gap to 40.0 mm and it crosses at about 23.5 K, reading Ra = 1.53e5, Nu 3.59 and h 2.36 W/(m2·K) — but only at four times the gap and far more heat than a cavity in a wall ever carries.
| Part of the drawing | What it paints | What it does not claim |
|---|---|---|
| the layer, left panel | A side view of the fluid between its two plates, titled with the fluid and the gap — air layer, gap 10.0 mm — with warm plate under it and cool plate over it. Below the threshold it draws five straight, evenly spaced isotherms and no arrows at all; above it, counter-rotating rolls |
the rolls are a schematic. Their count and their arrow size are derived from the Rayleigh number so the picture cannot drift from the card, but neither is a computed cell width: 2 rolls just over the threshold, 6 at the water preset, 8 at the boiling-pot setting. Nothing in the drawing is a length you can measure off |
| the caption along its foot | One line that names what was actually drawn: still: 5 straight isotherms, no motion below the threshold, 2 counter-rotating cells or 8 counter-rotating cells above it, and stable: warm fluid is already on top with the difference negative |
it never names rolls that are not on screen. The caption is written from the same state the drawing was, so a reader who sees the word isotherms is looking at isotherms. With the difference below zero the two plate labels swap as well, and the colours swap with them |
| the plot, right panel | The Rayleigh number against the temperature difference, titled Ra against dT, log scale, on a decade-anchored logarithmic axis labelled 1e-1, 1e1, 1e3, 1e5 and 1e7, with the difference running from dT = -20 K to +80 K |
the axis is anchored to the decades rather than to the data, so the curve does not rescale under you as you drag. The negative half carries a shaded band labelled stable, because a layer heated from above has no Rayleigh number to plot rather than a small one |
| the threshold line and the marker | A fixed horizontal line labelled Ra_c = 1708 and a round gold marker on the curve at the current setting, carrying its own value: Ra = 1520 at the first preset, Ra = 2630 at the second |
the marker is above the line exactly when the verdict card says the layer is convecting, which is the one thing the plot exists to make visible. With the difference at or below zero no marker is drawn at all — only a dashed vertical rule — because drawing one at the foot of the axis would claim a Rayleigh number the fluid does not have |
| both labels, when they collide | At a narrow panel the Ra_c = 1708 label and the marker’s own value label share one horizontal band. The panel measures both boxes in the drawing font first and drops one rather than overprinting, and the current state wins the contest |
a dropped label is never a dropped claim. The dashed line still says where 1708 is when its text has gone, and the marker dot is drawn last of all so no label’s backing box can ever hide the measurement it is labelling |
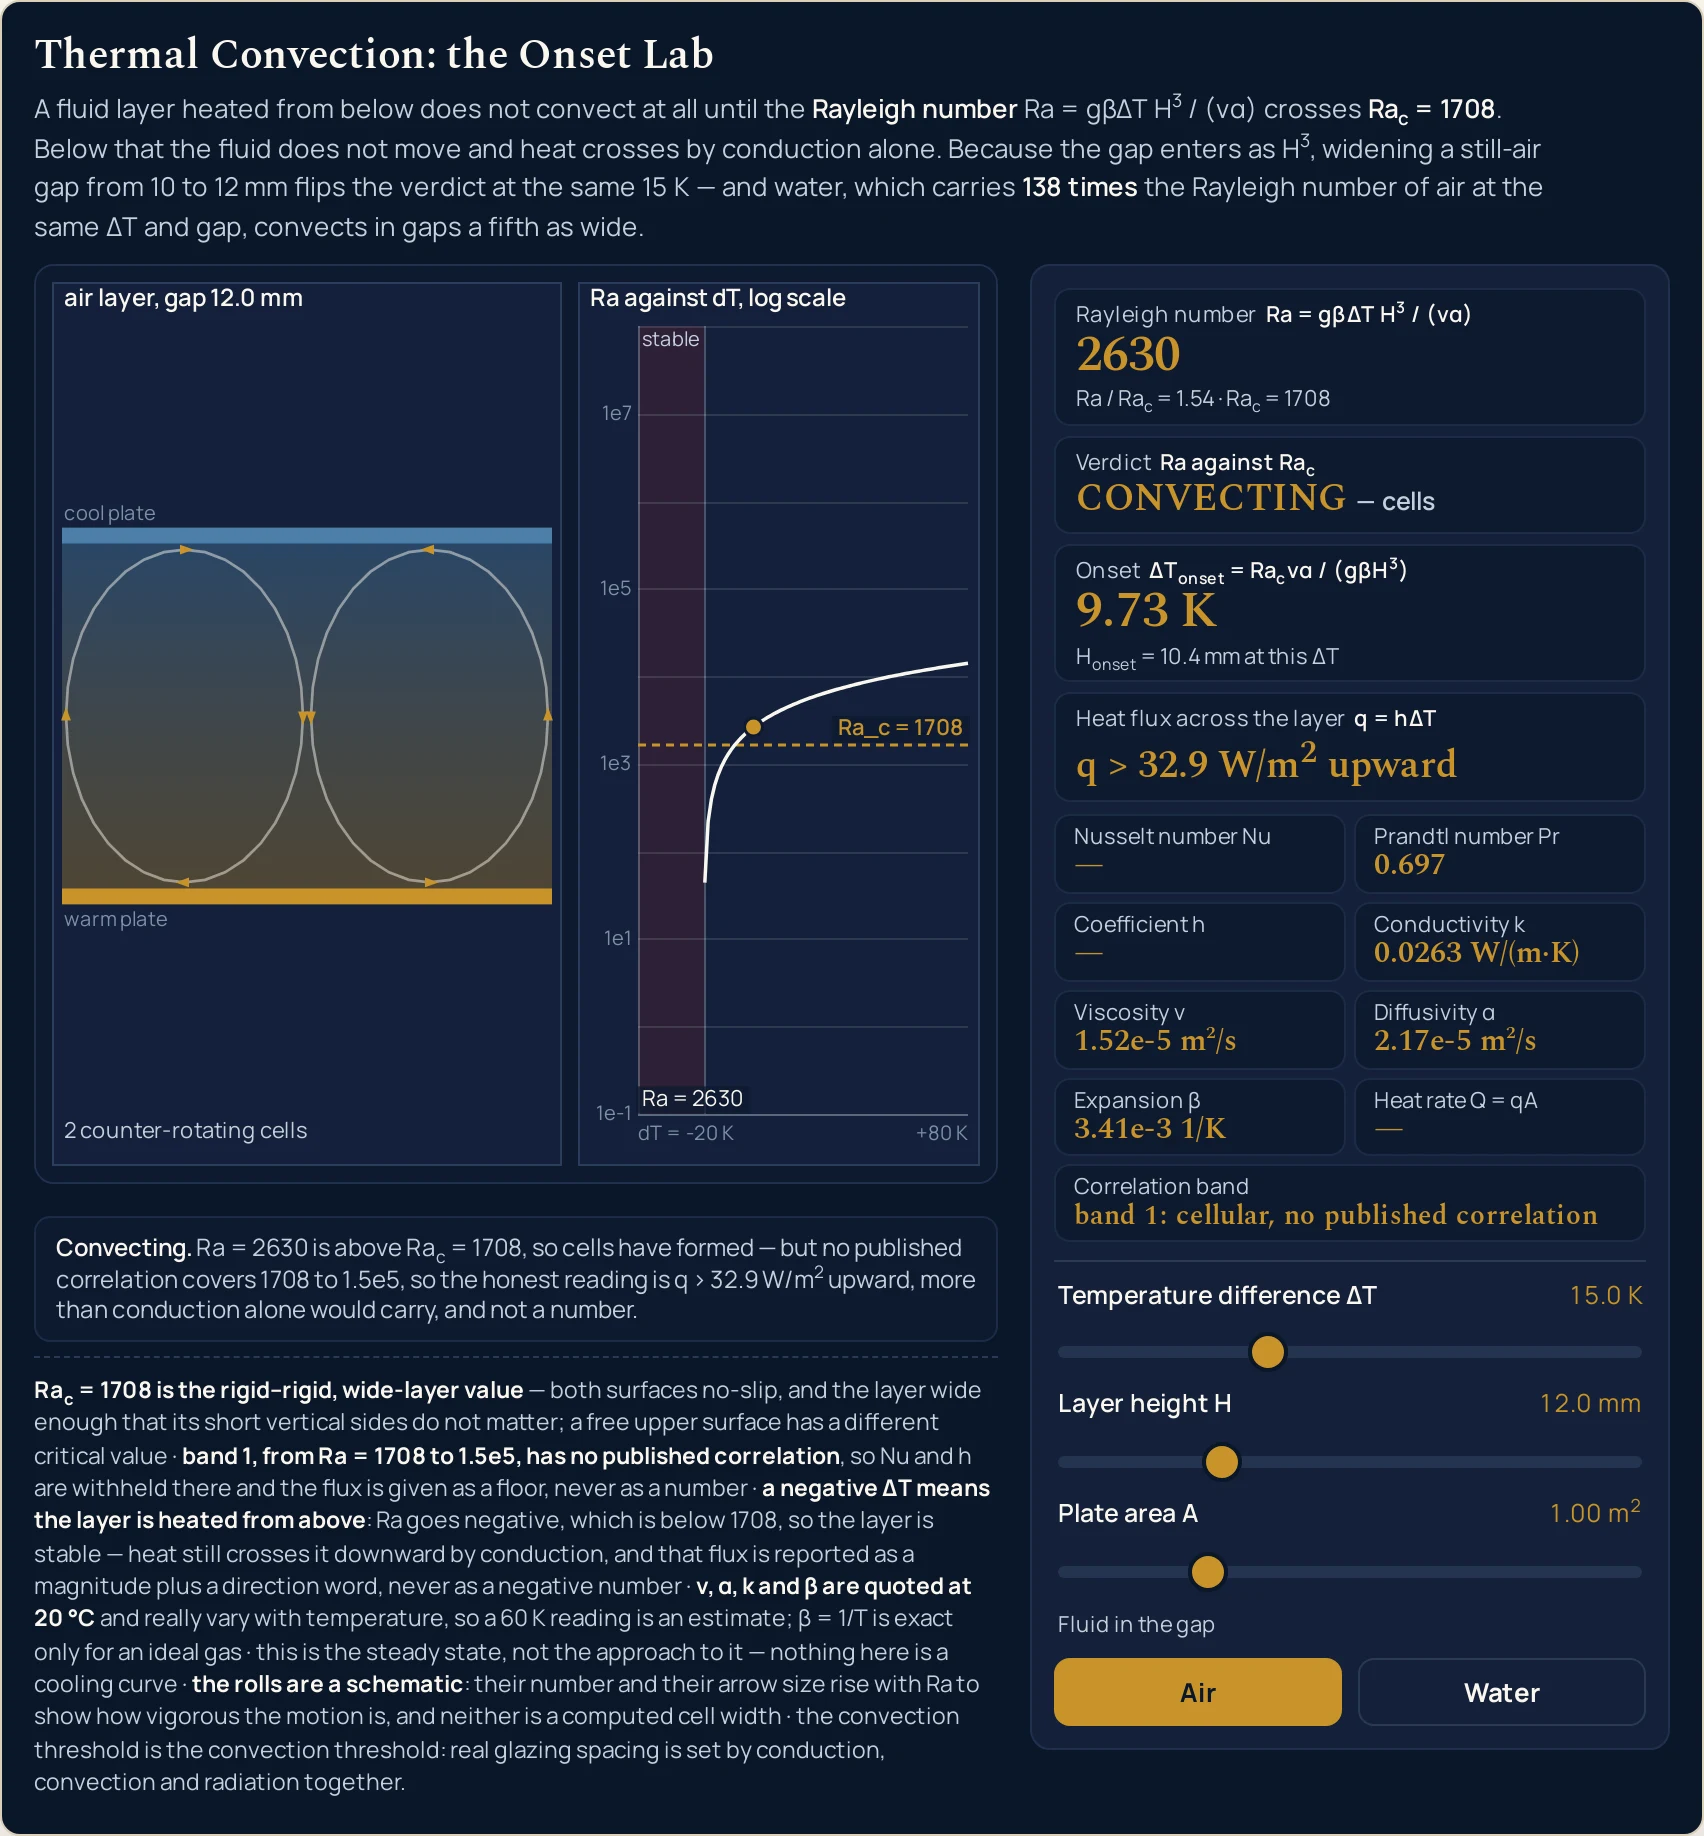
15.0 K, with one slider moved. The marker has crossed the Ra_c = 1708 line, the isotherms have been replaced by two counter-rotating rolls, and Nu, h and Q have all gone to —. The flux card reads q > 32.9 W/m2 upward — a lower figure than the 39.5 it read at 10.0 mm.Where the thermal convection simulator breaks down
Every state the three sliders reach is answered, and the arithmetic is not where this panel can let you down. What it cannot be is a real cavity in a real wall, and what it refuses to do is treat its own idealisations as facts. The first two items below matter more than the rest together.
- The threshold is the rigid-rigid, wide-layer value
- This is the hard limit, and the panel states it in a standing line rather than hiding it.
Rac = 1708assumes both surfaces are no-slip and the layer is wide enough that its short vertical sides do not matter — which is the published caveat on the correlation this lab uses above the threshold, quoted as a width condition. A free upper surface has a different critical number altogether, and a narrow cell is stabilised by its own walls. Carry1708into either case and the verdict is wrong before the arithmetic starts. - Band 1 is a hole in the published literature, not a rounding choice
- Between
Ra = 1708and1.5e5the cells are real and no correlation covers them, so the panel gives a floor and withholds three cells. The floor is a bound and not an estimate, which the water table above measures: a floor of633 W/m2at10.5 Kbecomes a measured2830 W/m2one slider step later. Treating a band-1 floor as an answer understates the flux, and the panel prints a greater-than sign so it cannot be mistaken for one. - Every property is quoted at one temperature
- The conductivity, the viscosity, the diffusivity and the expansion coefficient are all taken at
20 °C, and every one of them really varies with temperature. So a reading at a60 Kdifference is an estimate: properties should be evaluated at the film temperature for anything that matters. The air expansion coefficient is exact for an ideal gas and good enough for air at one atmosphere; the water figure is tabulated and is the one number in this cluster to check against your own source. - There is one geometry and it is not a surface
- This is a wide horizontal layer heated from below, with two flat plates and nothing else. There is no vertical plate, no pipe, no fin and no object sitting in a draught, and the correlations that cover those geometries are different correlations — mixing one of them into this relation is the commonest way this topic goes wrong. If your problem has a surface temperature and a bulk fluid temperature rather than a gap, the thermal convection calculator is the right page.
- Nothing here happens over time
- The panel reports the steady state and has no clock at all. How long a layer takes to start turning over once you cross the threshold, how the rolls organise themselves, and how a hot object cools towards the fluid around it are all separate questions with separate formulas, and none of them is on this screen. There is no cooling curve here, no time constant and no rate of change of temperature.
- It is the only mechanism on screen
- A real gap also loses heat by radiation across it, and the plates themselves conduct. This lab draws convection and the conduction it falls back on, and nothing else — so the flux card is never the whole heat flow through a real assembly. The comparison of conduction, convection and radiation is where the three are set side by side, and the heat transfer simulator is where all three run together on one screen.
- The rolls are a schematic
- Their count and their arrow size are derived from the Rayleigh number rather than chosen, so the drawing cannot contradict the card above it — but neither is a computed cell width, and nothing in the scene is a length you can measure. There is no cell-size readout on the panel and nothing that reports a flow speed. A reader who measures a roll has measured the renderer.
- The threshold is about buoyancy, and only buoyancy
- A still-air gap narrower than about
10.4 mmcannot convect at15 K. That is a statement about where overturning starts and nothing more: real glazing spacing is set by conduction, convection and radiation together, plus the gas filling the cavity and what it costs. No figure on this page is the reason for any product’s dimensions, and no standard or U-value is named here. - Three slider positions, and no measurement anywhere
- You set three controls and a fluid, and the lab reports what they imply. There is no box to type a measured flux into, no unit menu, no third fluid and no way to run the relation backwards from a flux to a gap. The property table is taken from values this site already ships rather than measured here. Verify any figure against your own source before you use it.
Where thermal convection is actually used
- Deciding whether a gap will convect at all
- This is the question the panel exists for, and it is the one no calculator on this topic asks. Set the fluid, the difference and the gap, and the verdict card answers in three words. The Onset card then gives you both inverses at once: the difference this gap would need, and the gap width this difference would need —
16.8 Kand10.4 mmfor still air at15.0 Kin a10.0 mmcavity. - Telling a conducting layer apart from a convecting one in the same object
- Water in a
2.0 mmgap at15.0 KreadsRa = 1680and a verdict ofSTILL—0.985of the critical value, and the only still state water reaches on this panel at that difference. Widen that gap by half a millimetre and it convects. The same object can therefore be on either side of the threshold depending on a dimension, which is exactly why the verdict is a card rather than an assumption. - Sanity-checking a coefficient someone has handed you
- Published tables for the convective coefficient disagree with one another by orders of magnitude, so a single figure is a starting estimate at best. The panel is the honest alternative for a layer: it builds the coefficient from the fluid, the gap and the difference, and refuses where no correlation exists. For still air in a
10.0 mmgap it reads2.63 W/(m2·K), and across the band-2 states measured on this panel it runs from2.36in air to499in water. - Separating a flux from a rate before the units bite
- The flux card is watts per square metre and the Heat rate cell is watts, and the area slider is there so you can watch one move and the other sit still. Drag it with water at
15.0 Kloaded:qholds at4280 W/m2while the rate runs214 Wto17100 W. If watts per square metre on its own is the quantity you want, the heat flux guide and the heat flux calculator are where it is the subject. - Knowing which way the heat is going
- Heating a layer from above is stable and the panel says so in words rather than printing a negative number. That matters for anything where the warm side is on top: the verdict reads
HEATED FROM ABOVE — stable, no cells are drawn, and the flux card readsq = 19.7 W/m2 downwardat-15.0 Kover20.0 mm. A magnitude and a direction word are two separate pieces of information, and neither is a minus sign. - Seeing why one fluid insulates and another does not
- Press the two fluid buttons at the same setting and the Rayleigh card moves by a factor of a hundred and thirty-eight:
1520for air against2.10e5for water, at15.0 Kin a10.0 mmgap. The Prandtl cell confirms the swap at a glance,0.697against6.96. That one contrast is the reason a sealed air gap is a useful insulator and a water-filled one is not. - Knowing when this relation is the wrong tool
- Two states make it wrong rather than imprecise, and both have a number on them. A layer below
1708is not convecting at all, so the answer is Fourier’s law and nothing else. And a forced flow has its own threshold set by the speed of the fluid rather than by how hot it has been made — that is the Reynolds number simulator’s ground, and no reading on this panel applies once a fan or a pump is involved.
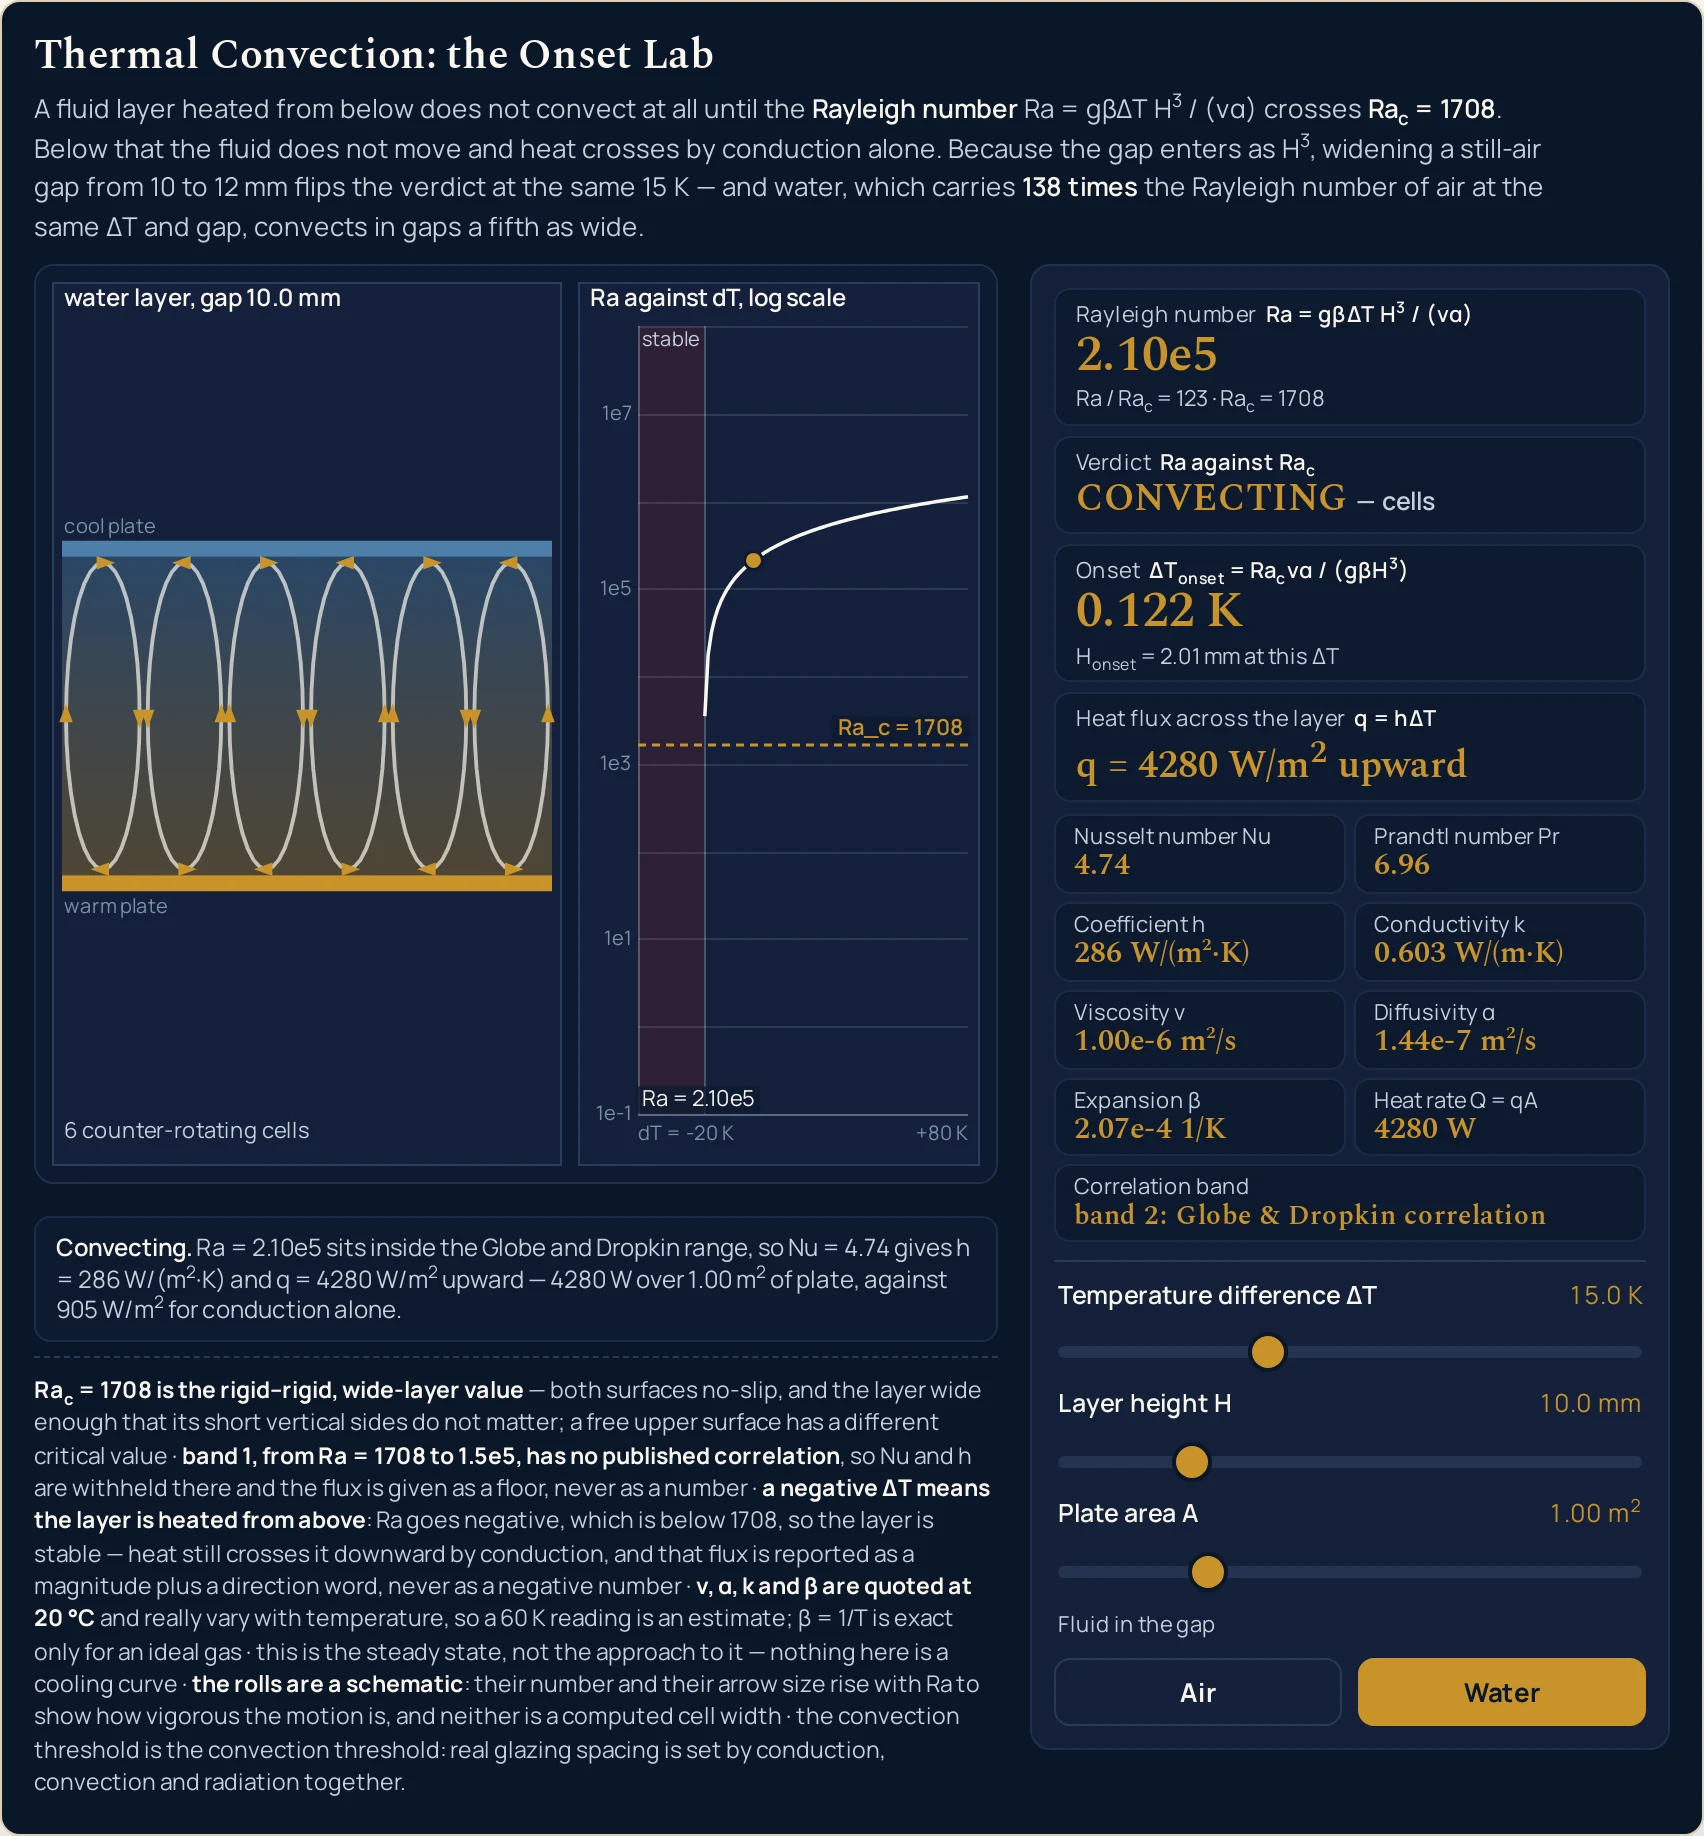
Ra is 123 times the critical value, so the correlation applies and the three withheld cells come back — Nu 4.74, h 286 W/(m2·K), Q 4280 W. The Onset card has dropped to 0.122 K — about a tenth of a kelvin is all it takes to start this layer turning over.Where to go next
A panel can put you in a state and let you move one thing at a time, and that is the end of what a panel is for. The thermal convection guide is where the subject is written out: the definition, the formula and its symbols, the threshold argued from scratch, why the coefficient is not a constant, and five problems with every step shown.
Five posts own the pieces this lab takes as read. The comparison of conduction, convection and radiation is where the three mechanisms are set side by side, the Fourier's law guide owns the conduction this lab falls back on below the threshold, the heat flux guide owns watts per square metre as a quantity in its own right, and the thermal diffusivity guide and the specific heat capacity guide build up two of the numbers in the grid.
Three more are worth having beside this one. The difference between heat and temperature is the distinction the two plate labels depend on, and the density guide and Archimedes' principle are where the buoyancy that drives the whole thing is the subject.
On the tool side, the thermal convection calculator takes typed figures and solves Newton’s law in five directions, the thermal conduction calculator does Fourier’s law through a slab of known thickness — one letter away in the address bar, and a different formula — the heat flux calculator does watts per square metre on its own, the thermal diffusivity calculator builds the quantity in the denominator here, and the specific heat calculator the one inside that.
Five neighbouring pictures sit beside this one: the heat transfer simulator, the Fourier’s law simulator, the thermal diffusivity simulator, the Reynolds number simulator and the viscosity simulator, with the buoyancy simulator for the force underneath all of it. Beyond them there is the simulation library, an index of calculators, and the blog for everything written out at length.
Frequently asked questions
Why do the Nusselt number and the coefficient h read as a dash when I open the lab?
Because the opening state sits in a band where no published correlation exists. Air at 20.0 K across a 10.0 mm gap gives a Rayleigh number of 2030, which is above 1708, so the layer really is convecting - but the Globe and Dropkin correlation does not start until 1.5e5. The panel withholds both cells and prints a floor instead, q > 52.6 W/m² upward.
Does widening the gap always move more heat?
No, and the first two presets exist to settle it. Going from 10.0 to 12.0 mm at the same 15.0 K flips the verdict from STILL to CONVECTING, and the flux card falls, from an exact 39.5 W/m² to a floor of 32.9 W/m². A thicker layer conducts less, and in that band the lab cannot say how much the new cells give back.
What does the greater-than sign on the flux card mean?
It means the panel has a lower bound rather than a value. Between 1708 and 1.5e5 the cells are real but nothing published covers them, so the card prints the conduction flux as a floor the truth lies above. The water table on this page shows how far above: a floor of 633 W/m² at 10.5 K becomes a measured 2830 W/m² at 11.0 K.
Why is the Rayleigh number card zero when I drag the difference below zero?
Because the layer is then heated from above, and the panel says so in words. The verdict card reads HEATED FROM ABOVE - stable, the Rayleigh card reads 0, and heat still crosses the gap downward: at -15.0 K over 20.0 mm the flux card reads 19.7 W/m² downward. It is always a magnitude and a direction word, never a negative flux.
Why does the coefficient h not move when I widen the gap in the correlation band?
Because the gap cancels out of it there. The Nusselt number rises in proportion to the gap, and h is that number times the conductivity divided by the gap, so the two moves cancel exactly. Water at 60.0 K reads h = 453 W/(m²·K) at a 10.0 mm gap and at a 30.0 mm gap, while the Nusselt cell goes from 7.52 to 22.6.
Is 1708 the threshold for every fluid layer?
No. It is the rigid-rigid, wide-layer value: both surfaces no-slip, and the layer wide enough that its short vertical sides do not matter. A free upper surface has a different critical number, and a narrow cell is stabilised by its own walls. The panel states that in a standing line under the drawing, and every figure on this page assumes it.
Does the plate area slider change the heat flux?
No, and it is worth watching once. Drag it from 0.05 to 4.00 m² with water at 15.0 K in a 10.0 mm gap and the flux card holds at 4280 W/m² in every position, while the heat rate cell runs from 214 W to 17100 W. The flux is per square metre; the rate is that flux multiplied by the area.
Can air ever show a real coefficient while it is convecting?
Yes, but not in a 10 mm gap - there it would need a difference of 1.48e3 K to reach the correlation band. Open the gap to 40.0 mm and push the difference to 80.0 K and the panel does reach it: Ra = 5.20e5, a Nusselt number of 5.40 and h = 3.55 W/(m²·K). Water in a 10 mm gap arrives at 10.7 K.
How many of the printed digits should I trust?
The cards carry three significant figures, with a compact exponent outside 0.01 to 100000, and the sliders step in halves. Those are display choices rather than claims about accuracy. The fluid properties are quoted at 20 degrees Celsius and really do vary with temperature, so a 60 K reading is an estimate. Nothing here is measured, so verify any figure before you use it.
References & formula source
- Every figure on this page comes from one relation and three slider positions. The Rayleigh number is the acceleration of gravity times the thermal expansion coefficient times the temperature difference times the cube of the gap, all divided by the kinematic viscosity times the thermal diffusivity. The verdict compares it with 1708. Below that the flux is the conductivity times the difference divided by the gap; above it the flux is the coefficient times the difference, and the coefficient is the Nusselt number times the conductivity divided by the gap. The panel applies all of that and multiplies out; the written guide derives it and works the problems.
- The critical value 1708 is the rigid-rigid, wide-layer figure: both surfaces no-slip, and the layer wide enough that the effect of its short vertical sides is minimal. That width condition is the published caveat on the correlation this lab uses above the threshold, and it is why no reading here should be carried over to a narrow cell or to a layer with a free upper surface. A free surface has a different critical number altogether.
- The band between 1708 and 1.5e5 is LABELLED rather than extrapolated, and that is the single most important sentence in this list. No published correlation covers it, so the Nusselt number, the coefficient and the heat rate are all withheld there and the flux is given as the conduction floor the true value lies above. The correlation that does apply, from a 1959 study of wide layers between a heated lower plate and a cooled upper one, is published for Rayleigh numbers from 1.5e5 to 6.8e8 and Prandtl numbers from 0.02 to 8750. Both fluids here sit inside the Prandtl window.
- The flux across the layer is reported as a magnitude and a direction word, never as a signed number. With the difference negative the layer is heated from above and heat still crosses it downward, so a minus sign printed beside the word stable would read as a fault rather than as a direction. The companion calculator keeps its sign, because a negative heat rate in Newton's law legitimately means the surface is gaining heat. Those are two different quantities on two different pages and both behaviours are separately asserted.
- The fluid property table is assembled from values this site already ships rather than from a new source, so this lab cannot disagree numerically with the three live labs it sits beside. The density and viscosity come from the Reynolds number lab's fluid table; the conductivity and specific heat from the thermal diffusivity lab's presets. Air's expansion coefficient is derived exactly, as one over the absolute temperature for an ideal gas. Water's expansion coefficient of 2.07e-4 per kelvin is tabulated at 20 degrees Celsius and is the one figure in this cluster that was neither fetched nor derived: verify it against your own source before you use it.
- The table checks itself. A Prandtl number derived from this site's own density, viscosity, conductivity and specific heat lands at 0.697 for air against an independently tabulated 0.707, and at 6.96 for water against 7.01 - both inside 1.5 per cent, and both asserted at a 2 per cent tolerance. Every property is quoted at 20 degrees Celsius and every one really does vary with temperature, so a reading at a 60 K difference is an estimate: properties should be evaluated at the film temperature for anything that matters.
- The threshold is the convection threshold and nothing more. A still-air gap narrower than about 10.4 mm cannot convect at 15 K, and that is a statement about buoyancy only: a real glazing unit is set by conduction, convection and radiation together, plus the gas filling it and what it costs. No manufacturer, standard or U-value is named anywhere on this page, and no spacing figure here should be read as the reason for any product's dimensions.
- The drawing states its own scale rules rather than leaving them to be assumed. The rolls in the left panel are a schematic: their count and their arrow size are derived from the Rayleigh number so the picture cannot contradict the card, but neither is a computed cell width and nothing in the scene is a length to measure. The logarithmic axis in the right panel is anchored to the decades rather than to the data, so the curve does not rescale while you drag, and the marker is above the threshold line exactly when the verdict card says the layer is convecting.
- This is the steady state, not the approach to it. There is no time anywhere in the lab, no cooling curve, no time constant and nothing that says how long a layer takes to start turning over once you cross the threshold. There is one geometry only, a wide horizontal layer heated from below, so no vertical plate, no pipe, no fan and no pump. A fourth correlation band exists in the code as a guard above 6.8e8 and is unreachable from these sliders - the widest Rayleigh number they produce is 7.18e7 - so this page describes three.
- The simulation was built, gated and frozen before this page was written, and every string quoted here was read back out of the running file rather than computed here. A reference oracle at 45 assertions with none failing; a Node tier at 553 checks with none failing; a headless Chrome tier at 1717 checks with none failing at three widths; a mutation pass over 173 planted faults with 167 killed, six proven redundant and none surviving; a compact-height pass measured at 900 pixels against a 1000 pixel ceiling; and a cross-browser pass of 19 checks in which 129 readouts came out identical in Chrome and in Firefox at each of three widths.
- What was not verified, stated as a gap rather than left to be assumed. Safari and WebKit: the build on the machine this was tested on cannot start, so Safari was never exercised and nothing here is evidence about it. Assistive technology: every slider carries a label and a spoken value and the drawing carries a full description, but no screen reader was driven and no real touch target was pressed. No figure on this page has been checked against a physical measurement of any kind.
- Nothing on this page is a measurement. Every digit and every pixel is arithmetic on three slider positions and a fluid button, so the lab shows the shape of one relation rather than an observation of any real gap, and the model is one wide uniform layer between two flat plates. Verify any figure against your own source before you use it for anything that matters.
- Further reading: Rayleigh–Bénard convection — Wikipedia