The interference of waves simulator is a free interactive lab built around one slider. Two waves run along the top of the drawing and their point-by-point sum runs beneath, on the same vertical scale, so a doubling really does look twice as tall. Drag Path difference and the sum swells to 10.0000 units, collapses to 0.00000 units half a wavelength later, then comes back exactly where it started one wavelength on. No wave speed, no frequency and no loudness is printed anywhere on this page.
Interference of Waves: Adding Two Waves on One Axis
Two waves on one axis, with their point-by-point sum beneath on the same vertical scale. Slide the path difference: the resultant doubles, collapses to nothing, then comes back exactly one wavelength on.
Load a real pair of waves on one axis
The first seven buttons are the lab’s own presets, pressed by id and nothing else. The last six press the opening one and then move a slider or two, which is what anyone does half a minute in. Between them they reach all thirteen published states, and they are arranged as pairs, because that is what makes them a lesson rather than a list: each pair changes exactly one thing, and the readings that stay byte-identical across it are the point.
Take the first five in order. Two and three change only the path difference, from the maximum to nothing at all; three and four change only the second amplitude, and every geometry reading holds its string. Two and five change only the path difference again, by three whole wavelengths, and this time it is the resultant that holds while the phase climbs. One and seven switch the second wave off.
Pick a published state above, or drag the four sliders yourself.
What Is the Interference of Waves Simulator?
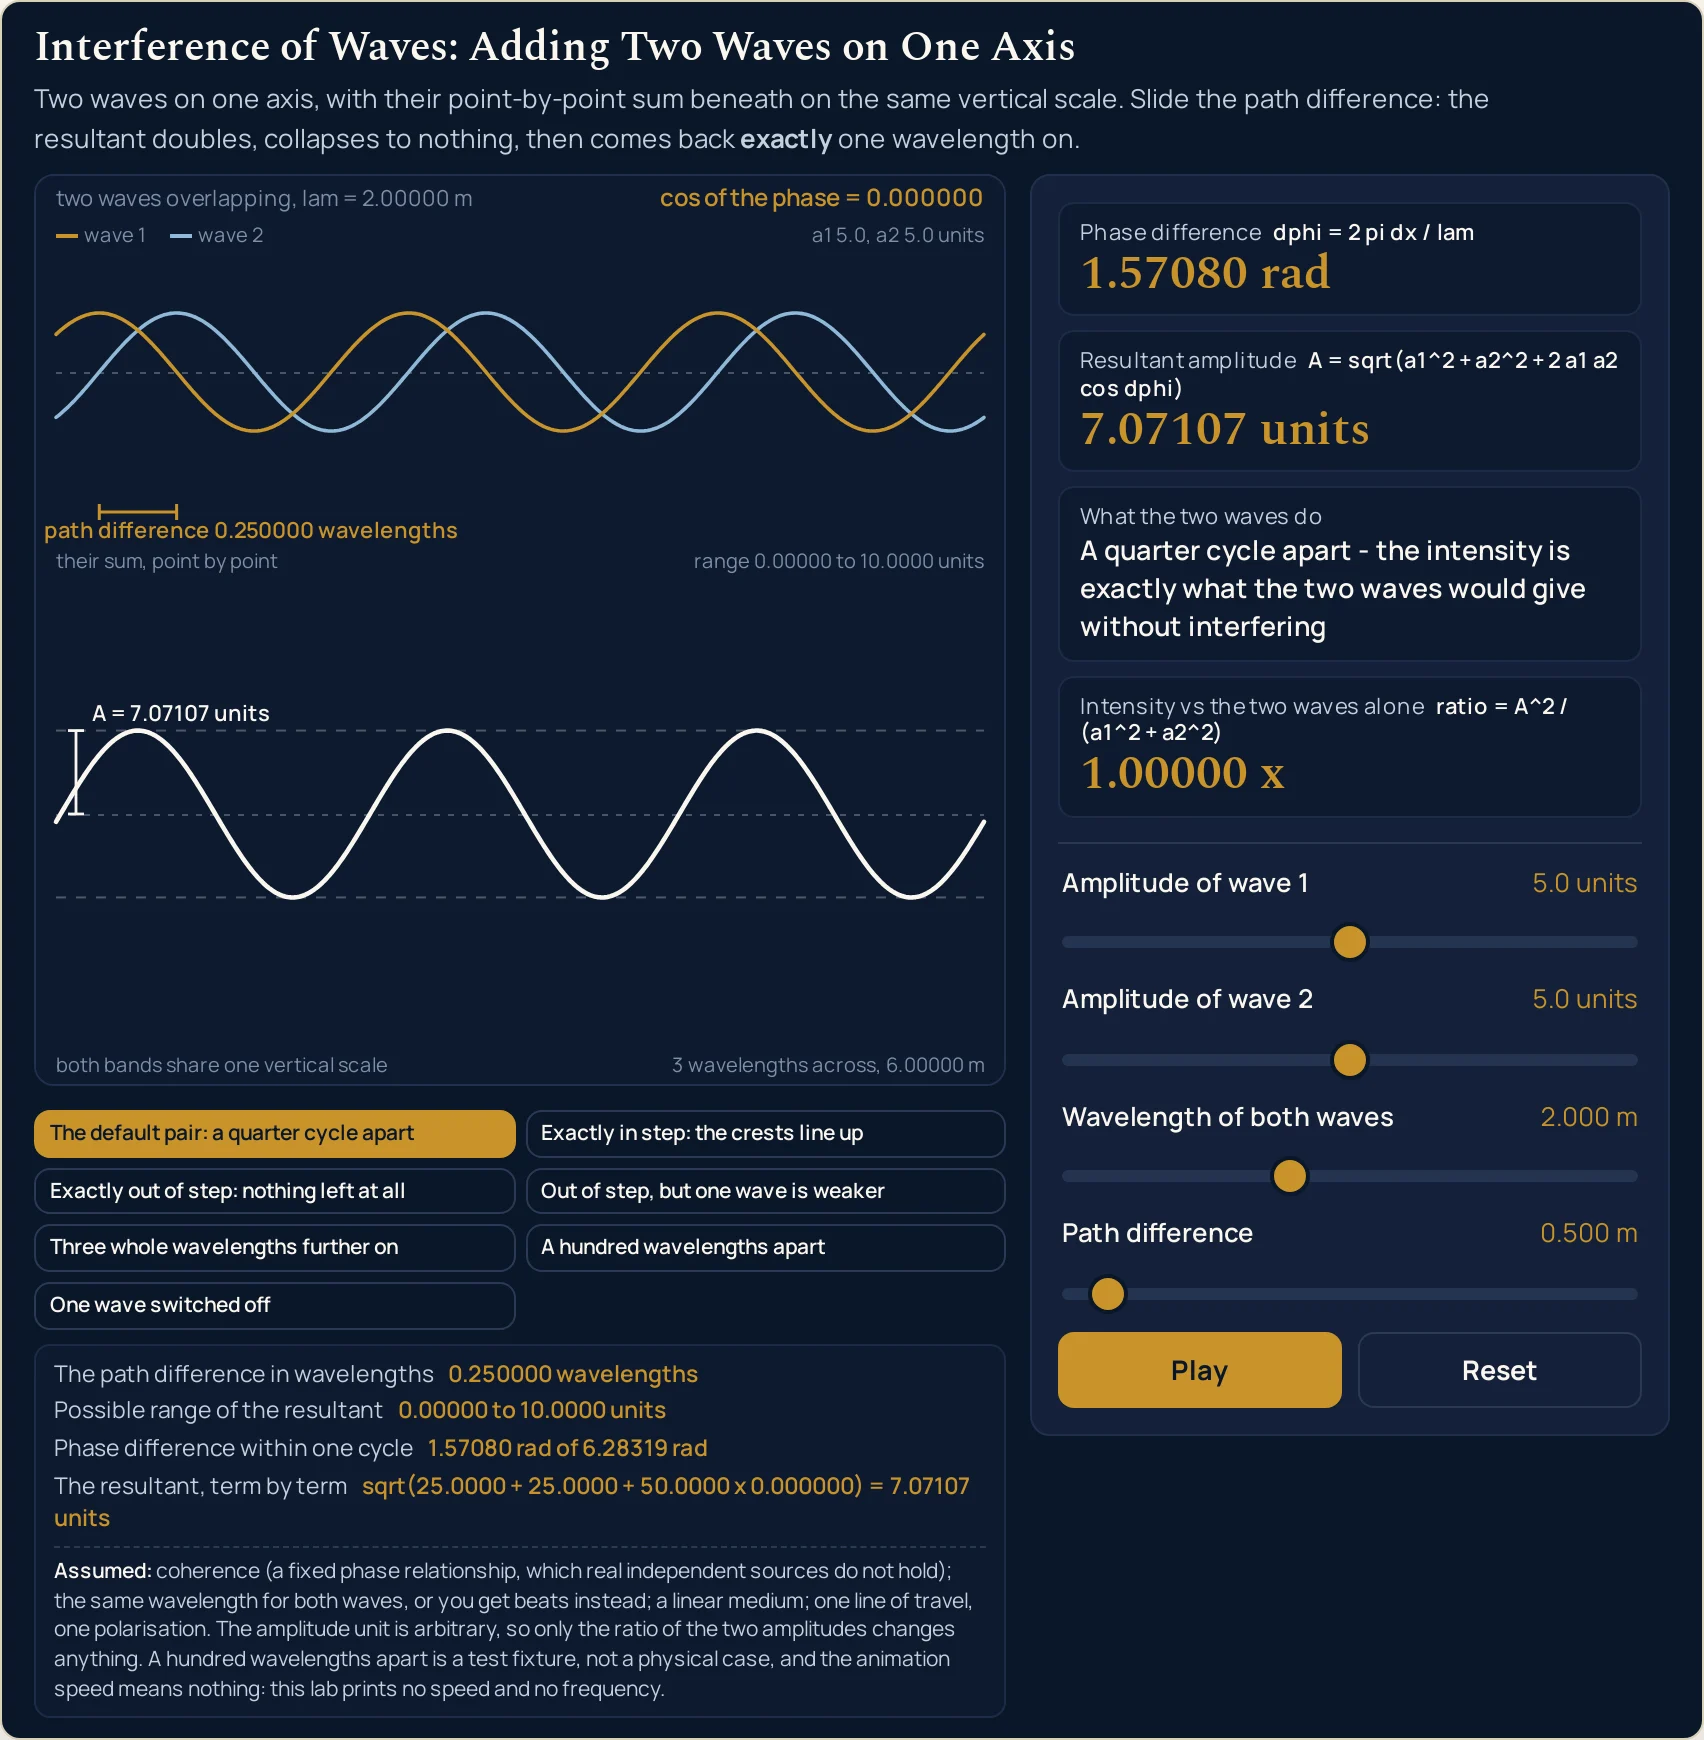
The interference of waves simulator is a free interactive physics lab that runs in your browser, with nothing to install and no sign-up. One drawing carries two bands on a single shared vertical scale: above, two waves of the same wavelength on one horizontal axis, gold and blue, with the blue one displaced along the axis by the path difference; below, their point-by-point sum in cream, between a faint pair of envelope lines at plus and minus the resultant.
Four sliders drive it. Amplitude of wave 1 and Amplitude of wave 2 each run 0 to 10.0 units in steps of 0.1, Wavelength of both waves runs 0.100 to 5.000 m in steps of 0.005, and Path difference runs 0 to 10.000 m in the same step. Seven preset buttons load a published state in one press, and Pause and Reset finish the panel.
Eight readings answer. Four cards give Phase difference, Resultant amplitude, What the two waves do and Intensity vs the two waves alone; a one-column strip beneath them adds The path difference in wavelengths, Possible range of the resultant, Phase difference within one cycle and The resultant, term by term. On the state the lab opens in they read 1.57080 rad, 7.07107 units, 1.00000 x, 0.250000 wavelengths, 0.00000 to 10.0000 units, 1.57080 rad of 6.28319 rad and sqrt(25.0000 + 25.0000 + 50.0000 x 0.000000) = 7.07107 units.
The four controls split into two jobs and the readings are arranged so the split can be watched. The two amplitudes decide how big the answer is allowed to be and never touch the phase or the count of wavelengths. The wavelength and the path difference decide where inside that band the pair lands, and never move the band: it holds at 2.00000 to 8.00000 units through every geometry you can reach at 5.0 against 3.0.
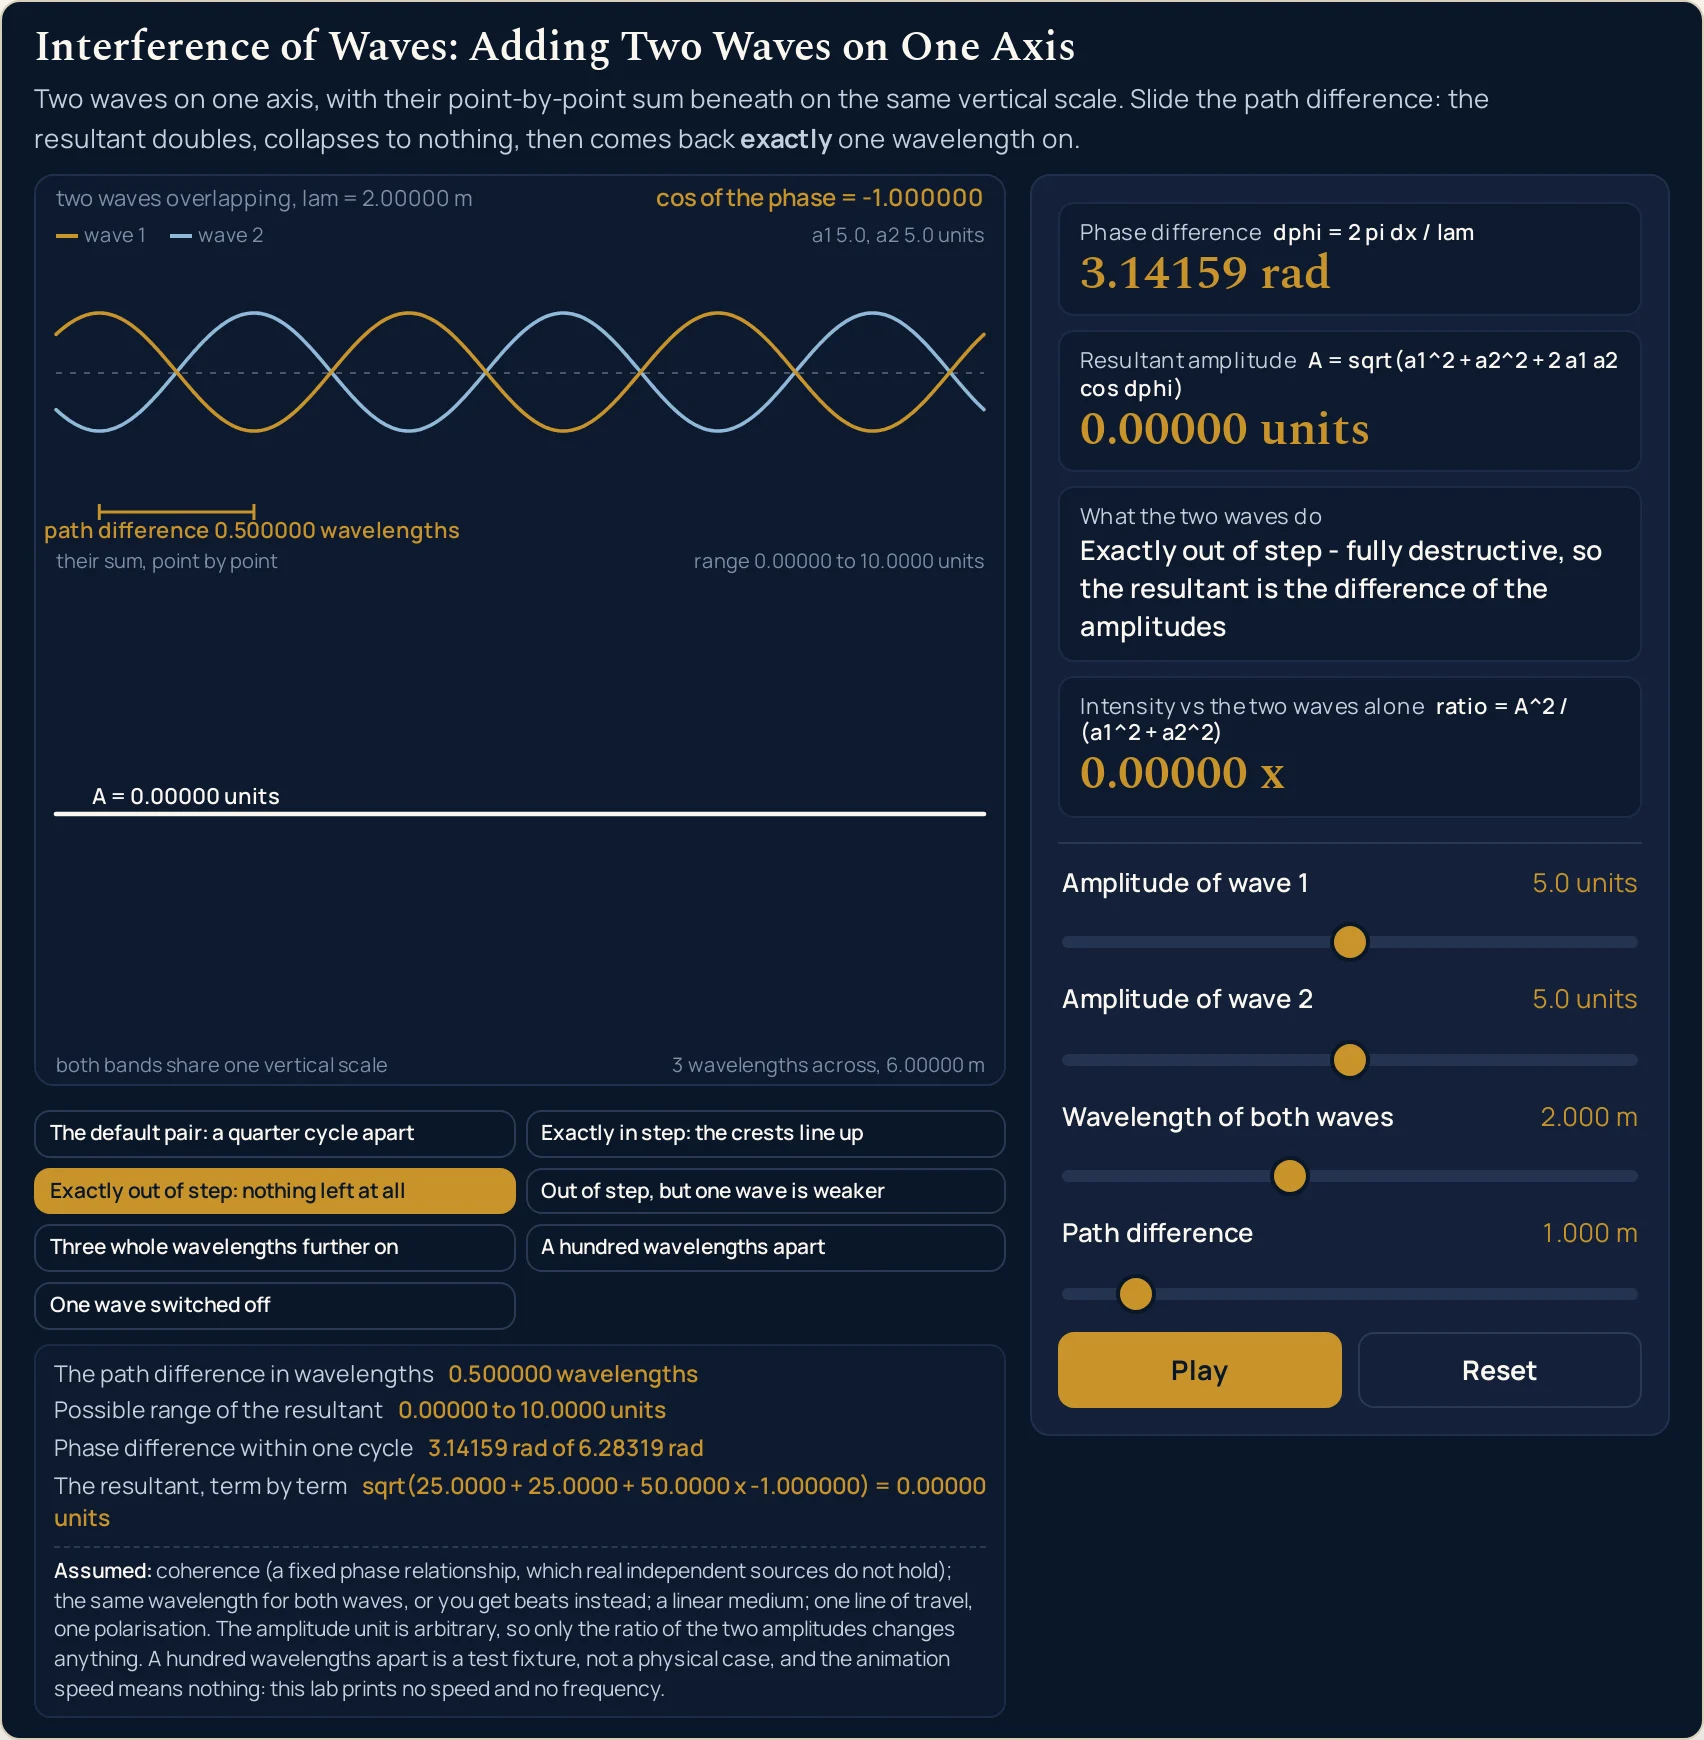
Sliding the path difference alone is the demonstration. At 0.500 m on a 2.000 m wavelength the two waves are a quarter cycle apart and the intensity card reads 1.00000 x — interference has given nothing and taken nothing. At 0.000 m the resultant is 10.0000 units at 2.00000 x; at 1.000 m it is 0.00000 units at 0.00000 x. That doubling is borrowed from the cancellation half a wavelength away, and over one whole wavelength of path the average ratio is exactly 1.
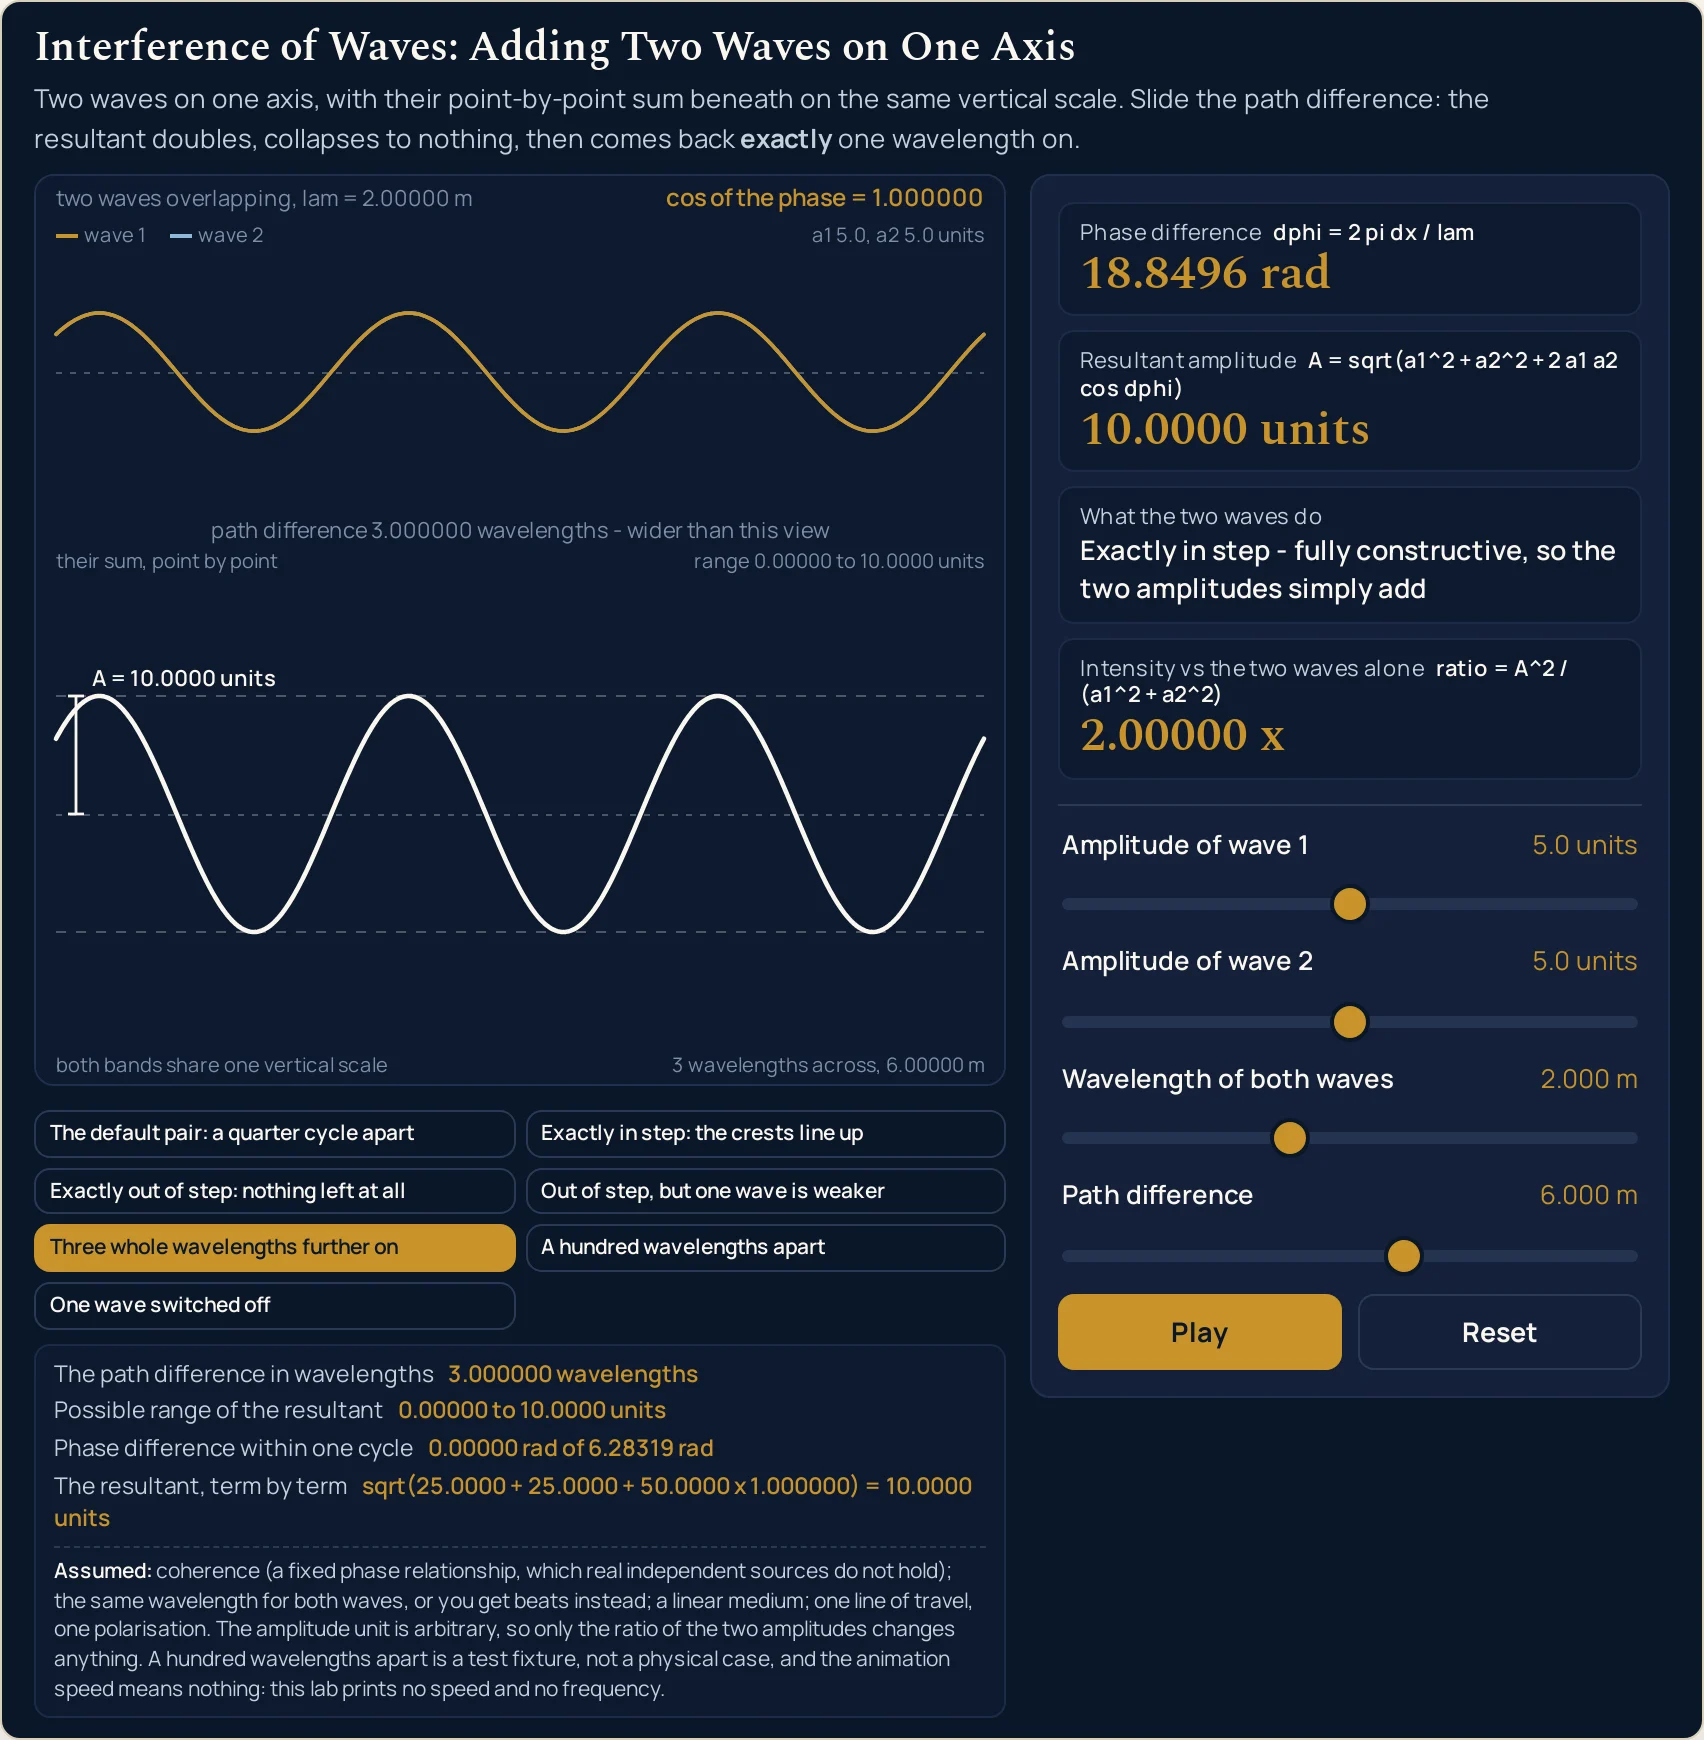
Whole wavelengths are the other half of the lesson, and one card is the only place they show. Press Exactly in step: the crests line up and then Three whole wavelengths further on: the resultant, the intensity and the verdict are byte for byte the same, while Phase difference climbs from 0.00000 rad to 18.8496 rad and Phase difference within one cycle returns to 0.00000 rad of 6.28319 rad. Only the fraction of a wavelength ever matters.
Unequal amplitudes are the case most people get wrong, and one press shows it. Out of step with both waves at 5.0 the resultant is 0.00000 units; drop the second to 3.0 and it is 2.00000 units at 0.117647 x — the difference between the two amplitudes, not zero — while the phase, the path difference and the reduced phase stay byte-identical. Switch one wave off entirely and the range collapses to 5.00000 to 5.00000 units and the verdict changes to its own string.
What the panel will not do, it says on itself. The wavelength is an input and no wave speed, frequency, period, energy or loudness is printed anywhere. The amplitude unit is the bare word units, because a wave is measured in whatever it displaces, so only the ratio of the two amplitudes changes anything. The animation speed carries no information, and the hundred-wavelength preset is a test fixture rather than a physical case: a real pair of sources loses its phase relationship long before that.
| Control | Range | Step, default and what it moves |
|---|---|---|
| Amplitude of wave 1 | 0 to 10.0 units | step 0.1; opens at 5.0; moves the resultant, the verdict, the intensity and the range, and never the geometry |
| Amplitude of wave 2 | 0 to 10.0 units | step 0.1; opens at 5.0; the same four readings, and at 0 the verdict changes to its own string |
| Wavelength of both waves | 0.100 to 5.000 m | step 0.005; opens at 2.000; moves six of the seven readings, everything but the range, and nothing at all while the path difference is 0 |
| Path difference | 0 to 10.000 m | step 0.005; opens at 0.500; moves every reading except the possible range of the resultant |
| Buttons | 7 presets | one press each; a preset writes all four sliders together and lights itself, and Pause and Reset sit beside the sliders |
How to use the interference of waves simulator
- Read the four cards before you touch anything. They are already answering: Phase difference 1.57080 rad, Resultant amplitude 7.07107 units, Intensity vs the two waves alone 1.00000 x, and a verdict reading A quarter cycle apart - the intensity is exactly what the two waves would give without interfering. That middle figure is the most illuminating number on the panel: overlapping the two waves has given nothing and taken nothing.
- Look at the drawing as one scene in two bands, not as two pictures. Wave 1 is gold and wave 2 is blue along the top, with the blue one shoved along the axis by the path difference, and the view always holds exactly three wavelengths. The cream curve beneath is their sum, point by point, drawn at the same pixels-per-unit as the band above — which is what makes a doubling look like a doubling, and what the caption
both bands share one vertical scaleis promising. The caption at the top right,cos of the phase = 0.000000, is the factor the arithmetic turns on. - Now drag Path difference alone, from 0 towards half a wavelength. Start at
0and the two crests sit on top of each other: 10.0000 units, 2.00000 x. Push to1.000 mon the opening2.000 mwavelength and the cream curve flattens onto the axis — 0.00000 units, 0.00000 x. One slider, the whole argument. - Keep going, a whole wavelength further, and watch it come back. At
2.000 mthe resultant is 10.0000 units again; at6.000 m, three wavelengths on, it is still 10.0000 units at 2.00000 x. The card that notices is Phase difference, which has climbed to 18.8496 rad, while Phase difference within one cycle has returned to 0.00000 rad of 6.28319 rad. - Now drop Amplitude of wave 2 and watch the cancellation stop being complete. Put the path difference back at
1.000 mand pull the second amplitude to3.0: the resultant is 2.00000 units, not zero, and the intensity is 0.117647 x. Out of step leaves the difference between the two amplitudes behind, which is the single most common thing people get wrong here. - Check what that amplitude move did not do. Phase difference, The path difference in wavelengths and Phase difference within one cycle are byte-identical before and after it. The amplitudes own how big the answer is allowed to be; the two lengths own where inside that band you land. Neither pair ever reaches into the other.
- Watch the bracket under the two waves, and watch it give up. It runs from a crest of wave 1 to the matching crest of wave 2 and carries the figure with it:
path difference 0.250000 wavelengthsat the opening state. Push past two of the three wavelengths in view and there is no matching pair left on screen, so the lab drops the bracket and prints a caption in its place —path difference 3.000000 wavelengths - wider than this viewon the fifth preset, andpath difference 100.000000 wavelengths - wider than this viewat the far corner. - Read the one-column strip under the canvas as a decomposition, not as more evidence. The path difference in wavelengths is the quantity everything turns on, Possible range of the resultant is the band the amplitudes fix, Phase difference within one cycle is the card above with the whole turns dropped, and The resultant, term by term restates the second card on purpose with the arithmetic showing.
- Take the amplitude unit at face value: it is the bare word units. A wave is measured in whatever it displaces, so a string is in millimetres and a sound is in pascals, and the panel refuses to pretend otherwise. Press Both amplitudes doubled, same geometry and the resultant goes to 14.1421 units while 1.00000 x does not move: only the ratio of the two amplitudes changes anything.
- Use Pause when you want to look rather than watch. It stops the single animation loop and leaves a clean static frame, which is the right state for reading the envelope and the bracket. The button then reads Play. The travel rate means nothing at all — this lab publishes no wave speed and no frequency — so no reading changes either way.
- Reset is the way back when too many sliders have moved to remember. It returns all four to
5.0,5.0,2.000 mand0.500 m, zeroes the travelling phase and re-lights the opening preset. Dragging any slider by hand drops the preset highlight, so no button can claim a state the cards do not show.
That the view always holds exactly three wavelengths is a drawing decision rather than anything about the waves. A view fixed instead at the widest one the lab ever needs, 15.000 m, would draw 150 wavelengths at one end of the wavelength slider and three at the other, so the scale follows the wavelength and the bottom-right caption prints how many metres three of them is.
Dragging is the right way to see which reading answers to which slider, and a poor way to hit an exact figure. When you already have two of the three geometry quantities and want the third typed out, the interference of waves calculator solves the same division for whichever one is missing, with unit menus on every box. The interference of waves guide is the prose half of the subject, with the two conditions, beats and the worked problems set out in full.
Worked example: change one thing at a time
Nothing in the tables below was worked out here. Each row is a state the lab was put into on this page and then read back from, cell by cell, so every string in them is the panel’s own. The first table prints the four cards for five published states; the second prints the strip rows for the same five, so the band and the arithmetic can be read beside the answers rather than inferred from them.
| What was pressed | Path difference in wavelengths | Phase difference | Resultant amplitude | Intensity vs the two waves alone | What the two waves do |
|---|---|---|---|---|---|
| Exactly in step: the crests line up | 0.000000 wavelengths | 0.00000 rad | 10.0000 units | 2.00000 x | Exactly in step - fully constructive, so the two amplitudes simply add |
| Exactly out of step: nothing left at all | 0.500000 wavelengths | 3.14159 rad | 0.00000 units | 0.00000 x | Exactly out of step - fully destructive, so the resultant is the difference of the amplitudes |
| Out of step, but one wave is weaker | 0.500000 wavelengths | 3.14159 rad | 2.00000 units | 0.117647 x | Exactly out of step - fully destructive, so the resultant is the difference of the amplitudes |
| Three whole wavelengths further on | 3.000000 wavelengths | 18.8496 rad | 10.0000 units | 2.00000 x | Exactly in step - fully constructive, so the two amplitudes simply add |
| Both amplitudes doubled, same geometry | 0.250000 wavelengths | 1.57080 rad | 14.1421 units | 1.00000 x | A quarter cycle apart - the intensity is exactly what the two waves would give without interfering |
Rows one and two are the headline, and only the path difference separates them. Same wavelength, same two amplitudes — and the resultant goes from 10.0000 units to 0.00000 units while the intensity goes from 2.00000 x to 0.00000 x. Half a wavelength of extra path is the entire difference between the two rows.
Rows two and three are the pair worth pressing yourself. Only the second amplitude moved, and the first two reading columns are byte-identical down the two rows: the same 0.500000 wavelengths, the same 3.14159 rad. The resultant goes from nothing to 2.00000 units and the verdict does not change a character, because the resultant is the difference of the amplitudes is true of both.
Rows one and four are the pair that proves only the fraction matters. Three whole wavelengths of extra path, and the resultant, the intensity and the verdict are byte-identical across them. The count of wavelengths has gone from 0.000000 to 3.000000 and the phase from 0.00000 rad to 18.8496 rad, and nothing else on the panel has noticed.
The strip, for the same five states
The four cards answer what; the strip underneath shows the band the answer had to land in and the arithmetic it came out of. Read the range column down the first two rows and it never moves, because the two amplitudes never moved. Read the reduced-phase column down rows one and four and it does not move either, which is the whole claim of the page in one cell.
| What was pressed | Possible range of the resultant | Phase difference within one cycle | The resultant, term by term |
|---|---|---|---|
| Exactly in step: the crests line up | 0.00000 to 10.0000 units | 0.00000 rad of 6.28319 rad | sqrt(25.0000 + 25.0000 + 50.0000 x 1.000000) = 10.0000 units |
| Exactly out of step: nothing left at all | 0.00000 to 10.0000 units | 3.14159 rad of 6.28319 rad | sqrt(25.0000 + 25.0000 + 50.0000 x -1.000000) = 0.00000 units |
| Out of step, but one wave is weaker | 2.00000 to 8.00000 units | 3.14159 rad of 6.28319 rad | sqrt(25.0000 + 9.00000 + 30.0000 x -1.000000) = 2.00000 units |
| Three whole wavelengths further on | 0.00000 to 10.0000 units | 0.00000 rad of 6.28319 rad | sqrt(25.0000 + 25.0000 + 50.0000 x 1.000000) = 10.0000 units |
| Both amplitudes doubled, same geometry | 0.00000 to 20.0000 units | 1.57080 rad of 6.28319 rad | sqrt(100.000 + 100.000 + 200.000 x 0.000000) = 14.1421 units |
The third row is the only one whose band is narrower than the others. At 5.0 against 3.0 the resultant can never leave 2.00000 to 8.00000 units, which is why a complete cancellation is not available to it at any path difference you can set. The rows above and below it, with two equal waves, run from 0.00000 to 10.0000 units and can reach both ends.
The last column is where the cosine does its work. It swings between 1.000000 in step and -1.000000 out of step and sits at 0.000000 a quarter of a cycle apart, and the middle term of the sum follows it. In the last row every term has quadrupled while the printed cosine has not changed at all, which is scale invariance written out in one line.
Formula and symbol reference
The lab prints two of its relations on itself, over the cards they belong to. Written out in the plain-digit form the panel uses:
cycles = dx / lam, then frac = cycles - floor(cycles), then dphi = 2 pi cycles and dphiR = 2 pi frac. The resultant is A = sqrt(a1^2 + a2^2 + 2 a1 a2 cos(dphiR)) and the intensity ratio is ratio = A^2 / (a1^2 + a2^2). The band runs from the difference between a1 and a2 up to a1 + a2.
One route computes the resultant, and it runs through dphiR rather than dphi. That matters less for the answer than you might think and more for the trust: with two routes, one of them could forget to drop the whole turns and no printed amplitude would reveal it. The reduced-phase row is the only reading on the panel where that mistake becomes visible, which is the measured reason it is there.
A single slider sets the wavelength of both curves, and the panel takes that on trust. Two waves whose wavelengths do not match settle into no steady pattern whatever, and nothing on screen would warn you. Where the wavelength itself comes from is a property of the material and a different page: the guide to wave speed in different media is what sets it in a given medium, and the wavelength formula and units guide is where a reader who arrives holding a frequency instead should start. Neither quantity is derived anywhere on this page.
Twelve rows follow and only four of them are things you drag. The rest are cards, strip rows or quantities the panel uses without showing. For the sliders the right-hand column gives the end stops, the step and the published positions; for everything else it gives the strings the lab prints and the span it prints them over.
| Symbol | Meaning | SI unit | In this lab |
|---|---|---|---|
| a1 | Amplitude of wave 1 — how far that wave displaces the medium at its crest. The first slider, and one of the two controls that can touch the possible range of the resultant | arbitrary; the lab prints the bare word units | 0 to 10.0 units, in steps of 0.1; it opens at 5.0 units and the presets also reach 10.0 units and 0.0 units. Counted by stepping the slider rather than read off a card: 101 reachable positions, every one of them answered. |
| a2 | Amplitude of wave 2, on the same footing. Dropping it to zero is the one amplitude move that changes the verdict into a string about there being nothing to interfere with | arbitrary; the same units as a1 | 0 to 10.0 units, in steps of 0.1; it opens at 5.0 units, and 3.0, 2.0, 10.0 and 0.0 are published positions. 101 positions again, swept end to end in the test runs with the geometry rows byte-identical throughout. |
| lam | Wavelength of both waves. ONE slider serves both, which is an assumption about the pair rather than a law: two waves of different wavelengths give no steady pattern at all | metre | 0.100 to 5.000 m, in steps of 0.005; it opens at 2.000 m, and 4.000 m, 3.000 m and 0.100 m are published positions. 981 reachable positions. It moves six of the seven readings — everything but the range — and none at all while the path difference is 0. |
| dx | Path difference — the extra distance one of the two waves has travelled before they are added. The fourth slider; like the wavelength it moves every reading but the range, and unlike the wavelength it is never silent | metre | 0 to 10.000 m, in steps of 0.005; it opens at 0.500 m, and 0.000, 1.000, 1.500, 6.000 and 10.000 m are published positions. 2001 reachable positions, the widest sweep on the panel. |
| cycles | The path difference measured in wavelengths, which is the quantity the whole panel turns on. The first strip row, printed to a fixed six decimal places | dimensionless | six decimals, always: 0.250000 wavelengths at the opening state, 0.000000 in step, 0.500000 out of step, 3.000000 three wavelengths on and 100.000000 at the far corner of the two geometry sliders. |
| frac | The part of that count left after the whole wavelengths are dropped. It never appears as a row of its own, because the panel shows its consequences instead | dimensionless | it is what makes 0.000000, 3.000000 and 100.000000 wavelengths give the same 10.0000 units. Watch it in the reduced-phase row, which is the only reading on the panel that can tell a whole cycle from none. |
| dphi | The total phase difference, built from the count of wavelengths rather than from a single expression. The first card, and the one reading that keeps climbing as you push the path difference out | radian | six significant figures with the trailing zeros kept: 1.57080 rad at the opening state, 3.14159 rad out of step, 18.8496 rad three wavelengths on. From the slider ends rather than from a card: the smallest non-zero phase it can print is 0.00628319 rad and the largest is 628.319 rad, with 0.00000 rad itself one slider position away, at no extra path. |
| dphiR | The same phase difference with the whole turns dropped, which is the figure the resultant is actually computed from. The third strip row, printed against the full turn beside it | radian | always between 0.00000 and 6.28319 rad, and printed as a pair: 1.57080 rad of 6.28319 rad at the opening state, 0.00000 rad of 6.28319 rad both in step and three whole wavelengths further on. |
| A | The resultant amplitude — the height of the sum drawn in the lower band, and the figure the envelope pair is set at. The second card | the same units as a1 and a2 | six significant figures: 7.07107 units at the opening state, 10.0000 in step, 0.00000 out of step, 14.1421 with both amplitudes doubled. From the slider ends: it spans 0.00000 to 20.0000 units, and the longest string it can print is 0.000314474 units. |
| ratio | The intensity against what the two waves would give on their own: the resultant squared over the sum of the two amplitudes squared. The fourth card, and the only dimensionless answer on the panel | dimensionless | six significant figures: 1.00000 x at the opening state, 2.00000 x in step, 0.00000 x out of step, 0.117647 x at 5.0 against 3.0. With both amplitudes at zero the divisor is zero and the card prints - rather than a number. |
| The range | The band the resultant can never leave, from the difference between the two amplitudes up to their sum. The second strip row, and the one reading the geometry sliders cannot touch | the same units as a1 and a2 | 0.00000 to 10.0000 units for two equal waves of 5.0, 2.00000 to 8.00000 units at 5.0 against 3.0, 3.00000 to 7.00000 units at 5.0 against 2.0, and 5.00000 to 5.00000 units with one wave switched off, where the band has no width left. |
| The verdict | The one-line answer on the third card, chosen from exactly seven fixed strings. The two amplitude cases are tested before the geometry, so a single wave is never reported as a quarter cycle apart | a sentence | all seven are reachable and all seven are reached by the preset buttons on this page. Every threshold is decided on the printed figure rather than on the raw float, so the string and the row it is reading can never disagree. |
If you read one row twice, make it dphiR. It is the only entry that is openly a stripped-down version of another reading, and the panel prints it against the full turn so that the stripping is visible rather than asserted. Everything the lab computes about the resultant goes through that figure and not through the card above it.
The physics: why the phase difference decides everything
Two waves on the same line add displacement by displacement, and the only thing that decides what the sum looks like is how far out of step they are when they meet. One whole wavelength of extra path is one whole cycle of phase, so the quantity that settles it is the path difference measured in wavelengths. Everything else on the panel is a consequence of that one division.
Because a whole cycle brings a wave back exactly where it started, the whole wavelengths fall out and only the fraction survives. That is why the lab can print 10.0000 units at a path difference of nothing, of three wavelengths and of a hundred, byte for byte the same, while the phase card reads 0.00000 rad, 18.8496 rad and 628.319 rad. The resultant genuinely cannot tell them apart.
Four readings answer to four different things, and the sliders are arranged so you can see it one change at a time. From the test runs rather than from a card: that dependency grid was checked at a tolerance of zero on every non-mover, over 3,024 amplitude pairs and 2,940 geometry pairs, so these are byte-identical strings rather than figures that agree to six digits.
The two amplitudes move the resultant, the verdict, the intensity and the range, and never the phase or the count of wavelengths. The wavelength and the path difference move the other six — the total phase, the reduced phase, the count, the resultant, the verdict and the intensity — and never the range; that is seven readings rather than the eight the panel prints, because the term-by-term row restates the resultant card instead of answering on its own. Multiply both amplitudes by the same factor and the resultant and the range scale by exactly that factor while the intensity and the verdict hold their strings.
Two neighbouring subjects get a clause apiece here and no more. Two waves running in opposite directions along one line give a pattern that stays put instead of travelling, which is a subject of its own and is not drawn here. And the same adding-up, taken at an angle through a pair of slits, is what the diffraction guide calls diffraction; the diffraction grating calculator solves that angular condition, and no angle is derived anywhere on this page.
Where interference of waves breaks down
Every position these four sliders can reach is answered, and answered to the full precision of a double. The arithmetic is not where this panel can let you down; the model behind it is. Seven assumptions sit under every reading on the page, and the lab compresses all seven into one line under the strip because they belong here, at length.
- It needs coherence, and that is by far the biggest one
- Every figure here assumes the two waves hold a fixed phase relationship for as long as you care about. The panel holds it by construction, which is exactly what two independent real sources will not do: they drift against each other, the fraction of a cycle wanders, and the pattern washes out into nothing in particular. There is no slider for this and no card that would warn you. Read every verdict on the page as conditional on it.
- A huge path difference needs that coherence over the whole distance
- The sixth preset is reachable and arithmetically correct: a hundred whole wavelengths of extra path returns the same 10.0000 units as none at all. For that to describe anything real the source would have to hold its phase over the whole of that run, and a real one loses it long before. That preset is a test fixture rather than a physical case, and it appears on this page only with that label attached.
- Both waves must share a wavelength, or you get beats instead
- One slider sets the wavelength and the drawing applies it to both curves. If the two do not match there is no steady pattern to report at all: what you get instead is a slow swelling and fading in time, governed by the difference between the two frequencies rather than by anything on this panel. Beats are named here and quantified in the interference of waves guide; anyone arriving holding a period rather than a frequency needs the frequency formula guide first.
- Superposition is linear, and that is an assumption about the medium
- Adding the two displacements point by point — which is literally what the lower band draws — is itself a model. Real materials obey it up to a point and then stop obeying it, so a very big displacement in an actual string, membrane or air column is not just the two added together. The panel will happily add 10.0 units to 10.0 units and draw the result; whether the thing being displaced would is a question about the material.
- Both waves are assumed to run along the same line, with the same polarisation
- There is one axis in the drawing and there will not be a second. Two waves crossing at an angle give a two-dimensional pattern, which belongs to the diffraction guide and to the wave-particle duality guide rather than to this panel; the diffraction lab is where that geometry is actually drawn. One axis, two curves, one displacement along it: that is all the geometry this panel has.
- Interference moves intensity about; it never makes any
- Reading 2.00000 x and stopping there would be dishonest. That doubling is borrowed from the 0.00000 x half a wavelength away, and averaged over one whole wavelength of path difference the ratio is exactly 1. The quarter-cycle state the lab opens in is the cleanest view of it: 1.00000 x, nothing gained and nothing lost. How loud the result is is a separate question that the decibel calculator handles and this panel never touches.
- The amplitude unit is arbitrary, and only the ratio of the two matters
- The sliders say units rather than millimetres or pascals on purpose, because the relation does not know what is being displaced. That is the amplitude guide’s subject rather than this panel’s. Press Both amplitudes doubled, same geometry: the resultant and the range scale by exactly two while 1.00000 x and the verdict hold. A resultant of 7.07107 units only means something next to the two amplitudes it came from.
Where interference of waves is actually used
- Noise cancelling, which inverts a wave instead of adding path to it
- Adding half a wavelength of extra path is one way to put two waves out of step; electronically inverting one of them reaches the same place with no geometry at all. Press Exactly out of step: nothing left at all for the ideal, then Out of step, but one wave is weaker for what imperfect matching costs: 2.00000 units of residue from a 5.0 against a 3.0. The useful figure is the amplitude ratio, which is why the panel prints the band as well as the answer.
- Quarter-wave coatings, where the round trip counts the thickness twice
- A layer a quarter of a wavelength thick gives a wave that crosses it and comes back 0.500000 wavelengths of extra path, because the trip there and the trip back each count once. That is the state the third preset loads, and with two equal amplitudes it reads 0.00000 units. Real coatings do not cancel perfectly for the reason the fourth preset shows: the two reflected amplitudes are not equal, so what is left is their difference.
- Checking two loudspeakers are wired the same way round
- Swapping the connections on one of a matched pair inverts its displacement, which is exactly half a cycle of phase and nothing else. On this panel that is the step from 10.0000 units to 0.00000 units with no slider moved but the path difference: not a halving but the whole lot gone, since the factor of two sits between the correctly wired pair and the 5.00000 units of either one on its own. The guide to how sound waves travel is the everyday case of two overlapping waves written out.
- Beats, as the method people actually tune instruments by
- Two notes that are close but not equal do not settle into a verdict at all; they swell and fade, and the rate they do it at is the difference between the two frequencies. That is the one case this panel deliberately cannot show you, because it has a single wavelength slider. It is named here and quantified in the guide, and the absence is the honest version of the limit above.
- Deciding whether the resultant or the intensity answers your question
- The resultant is in whatever unit you set the amplitudes in, so it is the figure to use when comparing against a displacement you can measure. The intensity ratio is dimensionless and scale-free, so it is the figure to use when you want to know what the overlap actually did. At 5.0 against 3.0 out of step, 2.00000 units and 0.117647 x are the same state described two ways, and only the second one is comparable between experiments.
- Reading a cancellation backwards to get a wavelength
- Set two equal amplitudes, then drag the path difference until the lower band goes flat: the first place it does is half a wavelength, so doubling the reading on Path difference gives the wavelength. It will go flat again every whole wavelength after that, which is the trap — there is never only one answer, and using the second cancellation as though it were the first is wrong by exactly the factor you misread.
- Seeing why a single wave has nothing to report
- Press One wave switched off. The resultant is 5.00000 units, the band collapses to 5.00000 to 5.00000 units, and the verdict stops describing geometry and says there is nothing to interfere with — even though the path difference still reads 0.250000 wavelengths. The travelling wave lab is that case on its own terms, with nothing to add to.
Where to go next
A panel can show you which readings a slider is allowed to move, and that is the end of what a panel is for. Interference of Waves is where the subject itself is written out: what interference is, the two conditions in full, beats with the arithmetic behind them, the worked problems and the misconceptions. The calculator that takes these figures typed heads the list of related tools below.
Three things this lab leans on but never explains have pages of their own. What sets the wavelength in a given medium is the guide to wave speed in different media. The wavelength taken on its own, for a reader who arrives holding a frequency, is the wavelength formula and units guide. The height of a single wave, which this panel uses as an input twice over, is the amplitude guide.
Further out, the transverse and longitudinal waves guide is what is actually doing the displacing in the two bands, the guide to how sound waves travel is the everyday case of two overlapping waves, and the frequency formula guide is the conversion a reader arriving at beats will want first.
Two labs on this site draw the same adding-up as an angular pattern through slits, and the resemblance is real rather than loose. The diffraction grating lab and the double-slit lab are both already published and are not changing; what they add is a geometry this panel does not have, with two waves arriving from different directions instead of along one line. The diffraction guide is the prose for it.
Nearer home, the travelling wave lab is one wave with nothing to add to it, the transverse and longitudinal lab shows the two particle motions, and the lab for a wave crossing into a new medium is where a wavelength changes. Beyond that there is the simulation library to work through, an index of calculators for when typing beats dragging, and the blog for everything written out at length.
Frequently asked questions
Why is the lower band of the drawing on the same vertical scale as the upper one?
So that twice as big looks twice as big. The sum of two waves can reach twice the height of either one, so the lower band is given exactly twice the half-height of the upper band and both are drawn at one pixels-per-unit. The bottom-left caption says so out loud. Two separate scales would make a doubling and a cancellation look identical.
Why does the bracketed span between the two crests sometimes vanish from the picture?
Because the view only ever shows three wavelengths, and a span wider than two of them has no pair of matching crests left on screen to run between. Rather than draw a short bracket and label it with a long figure, the lab drops the span and prints a caption naming the true value instead, such as path difference 100.000000 wavelengths - wider than this view.
Why does nothing at all change when I drag the wavelength at a path difference of zero?
Because with no extra path there is no fraction of a cycle to change. The path difference in wavelengths stays at 0.000000 wavelengths whatever the wavelength is, so the phase, the resultant, the intensity and the verdict all hold their strings. That is the one family of states where a slider moves and no reading answers; everywhere else the wavelength moves four of them.
What does the phase difference within one cycle row tell me that the phase card does not?
It is the only place on the panel where forgetting to drop the whole cycles would show. Press Three whole wavelengths further on and the card climbs to 18.8496 rad while that row returns to 0.00000 rad of 6.28319 rad. The resultant cannot tell the two apart, because the cosine of three full turns and the cosine of none agree to about thirty decimal places.
The resultant, term by term row just repeats the resultant card. Why is it there?
Deliberately, and it is a decomposition rather than a second piece of evidence. It shows the arithmetic the card hides: at the opening state it reads sqrt(25.0000 + 25.0000 + 50.0000 x 0.000000) = 7.07107 units, so you can see which term the cosine multiplies and watch that last factor swing between 1.000000 and -1.000000 as you drag the path difference.
How fast are the two waves actually moving across the screen?
At no particular speed, and the animation rate carries no information. This lab publishes no wave speed and no frequency, because interference is settled by the path difference divided by the wavelength and the speed never enters it. The travel is there so the drawing reads as waves rather than as a frozen diagram. Press Pause and every reading stays exactly where it was.
Why does the intensity card show a hyphen when I pull both amplitude sliders to zero?
Because with no wave present there is nothing to compare anything with. The card divides the resultant squared by the sum of the two amplitudes squared, and with both at zero that divisor is zero, so the ratio is genuinely undefined. A hyphen is the honest answer there. The geometry rows carry on reading normally, because they never look at the amplitudes.
Why does the verdict stay the same when one wave is much weaker than the other?
Because the verdict reports the geometry, and the geometry has not moved. Out of step at 5.0 against 3.0 the panel still says the resultant is the difference of the amplitudes, which is true: it reads 2.00000 units rather than zero. There is no separate string for complete cancellation, because one honest sentence covers both the equal and the unequal case.
Why does touching any slider switch off the highlighted preset button?
So that no button can claim a state the readings no longer show. Each preset lights itself and unlights the other six when pressed, and the first real drag of any slider clears every lamp at once. The panel is then reporting whatever you have set rather than whatever was last loaded. Reset puts all four sliders back and re-lights the opening preset.
References & formula source
- Every figure on this panel comes out of four slider positions and three closed forms, and nothing is fitted or measured. The lab prints the relations on itself, above the cards they belong to: the phase difference is two pi times the path difference over the wavelength, the resultant is the square root of a1 squared plus a2 squared plus twice a1 a2 times the cosine of that phase, and the intensity ratio is the resultant squared over a1 squared plus a2 squared.
- There is ONE code path for the resultant on this panel, and it runs through the phase difference within one cycle rather than the total. That is a design rule rather than an implementation detail: with two routes, one could forget to drop the whole turns and the other could not, and no card would reveal which had happened. The reduced-phase row is the only reading on the panel where the difference is visible at all, which is the measured reason it exists.
- The phase is built from the count of wavelengths and not from a single expression in the path difference and the wavelength. The two are the same in algebra and not always the same in floating point: the independent working written alongside this lab found 9 of 48 tested states where the two orders of operation differ in the last bit. One order is fixed for this panel, for the calculator and for that independent working alike, so none of the three can drift away from the others.
- The amplitude unit is arbitrary throughout, and the lab says so rather than inventing one. A wave is measured in whatever it displaces, which is millimetres for a string and pascals for a sound, and the resultant comes out in the same unit as the two inputs. Multiply both amplitudes by any factor and the resultant and the band scale by exactly that factor while the intensity card and the verdict do not move, which is what makes the bare word units honest.
- This cluster publishes no wave speed, no frequency, no period, no energy and no loudness, and that is a boundary rather than an omission. Interference is settled by the path difference divided by the wavelength, and the speed never enters that division. Where the wavelength itself comes from in a given medium is a property of the material and belongs on its own page; nothing here derives it.
- Two of the limits on this page have a mechanism and no number. How far a real pair of sources holds its phase relationship, and how large an amplitude a real medium will still superpose linearly, are both properties of particular sources and particular materials. No figure for either is published on this site, so no figure for either appears here. Verify before use.
- The hundred-wavelength preset is arithmetically exact and physically a test fixture, and is labelled as one everywhere it appears. It exists because a formatter decision had to be measured over the whole reachable product of the two geometry sliders rather than guessed, and because a path difference that large is the clearest possible demonstration that only the fraction of a wavelength survives. It is not a description of any experiment.
- Every displayed cosine is rounded to six decimal places before it is printed, and every threshold in the verdict is tested on that printed figure rather than on the raw value. At half a cycle the raw cosine of the half-angle is about 6.1e-17 rather than 0, and a negative zero is stripped as well, because the cosine of three quarters of a turn is a very small negative number and a readout of minus zero would be nonsense.
- Two engines were compared readout by readout rather than assumed to agree: the browser-by-browser check run for this page put five slider positions side by side in Chrome and in Firefox at four widths, 134 readout values per width, and every one matched, with 19 assertions passed and 0 failed. There is a hole in that, and it is Safari - the WebKit build on this machine will not start without system access it has not been given, so Safari was never exercised here and nothing on this page is evidence about it.
- Every readout figure quoted on this page is a string this simulation printed for the button or the slider position named beside it, read back out of the running lab in a browser rather than worked out by hand. Each is computed from the exact value and rounded once, so re-deriving one printed figure from another will not always reproduce the sixth digit; the few figures here that came from running many states rather than from a card say so in their own sentences. Where a figure here and the lab part company, believe the lab, and verify anything you rely on before using it.
- Further reading: Wave interference — Wikipedia