Two sliders, one sinusoid and three different numbers that people all call its wave number. This wave number simulator is a free interactive lab for the one thing those three numbers disagree about, which is what they are counting: drag the wavelength across eight decades and watch the angular figure in rad/m, the spectroscopist’s count per cm, and the same count per m all move together. It opens on the 1 cm anchor, where the four cards read 628.319 rad/m, 10.00 mm, 1.00000 per cm and 1.57080 rad.
The reading to watch is the one that never moves. k / (per cm figure) prints 628.319 (200 pi) in every state the two sliders can reach, and the cell beside it prints 0.798180 (log10 2 pi) just as stubbornly, because those are facts about the two definitions rather than about any wave. Push the wavelength slider from 100.0 nm to 10.00 m and the first card runs from 6.28319e+7 rad/m to 0.628319 rad/m — eight decades — with both of those cells unchanged to the last digit.
Wave Number and Phase per Metre
One sinusoidal wave, and the three different numbers people all call “its wave number”: the angular wave number k = 2π/λ in radians of phase per metre, the spectroscopist’s count of whole cycles per centimetre, and the same count per metre. Drag the wavelength across eight decades and watch all three move — while the gap between k and the per-metre figure on the decade axis never moves, because it is always 2π.
Load a real wavelength
Each button presses the simulation’s own matching preset, so the two sliders are written by the lab itself and every number you then see is the lab’s. There is no mode to pick, no run button and no animation to wait for, so each press lands on a finished state almost at once.
Press the second and then the third if you only press two. They are the pair that makes the point of the whole panel: one is the wavelength a spectroscopist would quote without hesitating, and the other is the single wavelength at which both conventions happen to read a round number.
Pick a wavelength above, or drag the two sliders yourself.
What Is the Wave Number Simulator?
The wave number simulator is a free interactive physics lab that runs in your browser, with nothing to install and no sign-up. It draws one sinusoidal wave and prints the three different numbers people call its wave number: the angular one in rad/m, which counts radians of phase, and the cycles count in per cm and in per m, which counts whole repeats. All three come from one wavelength, and the panel never lets you forget which is which.
Two sliders drive it. Wavelength is a logarithmic ladder of 801 rungs from 100.0 nm to 10.00 m, labelled with the wavelength formatted rather than with the exponent behind it; three of those rungs hold a published wavelength exactly, which is why a preset titled 500 nm shows 500.0 nm and not the nearest grid value. Distance along the wave runs from 0.00 wavelengths to 3.00 wavelengths in hundredths, and is set as a fraction of a wavelength because a fixed distance in metres would be invisible at one end of eight decades and millions of radians at the other.
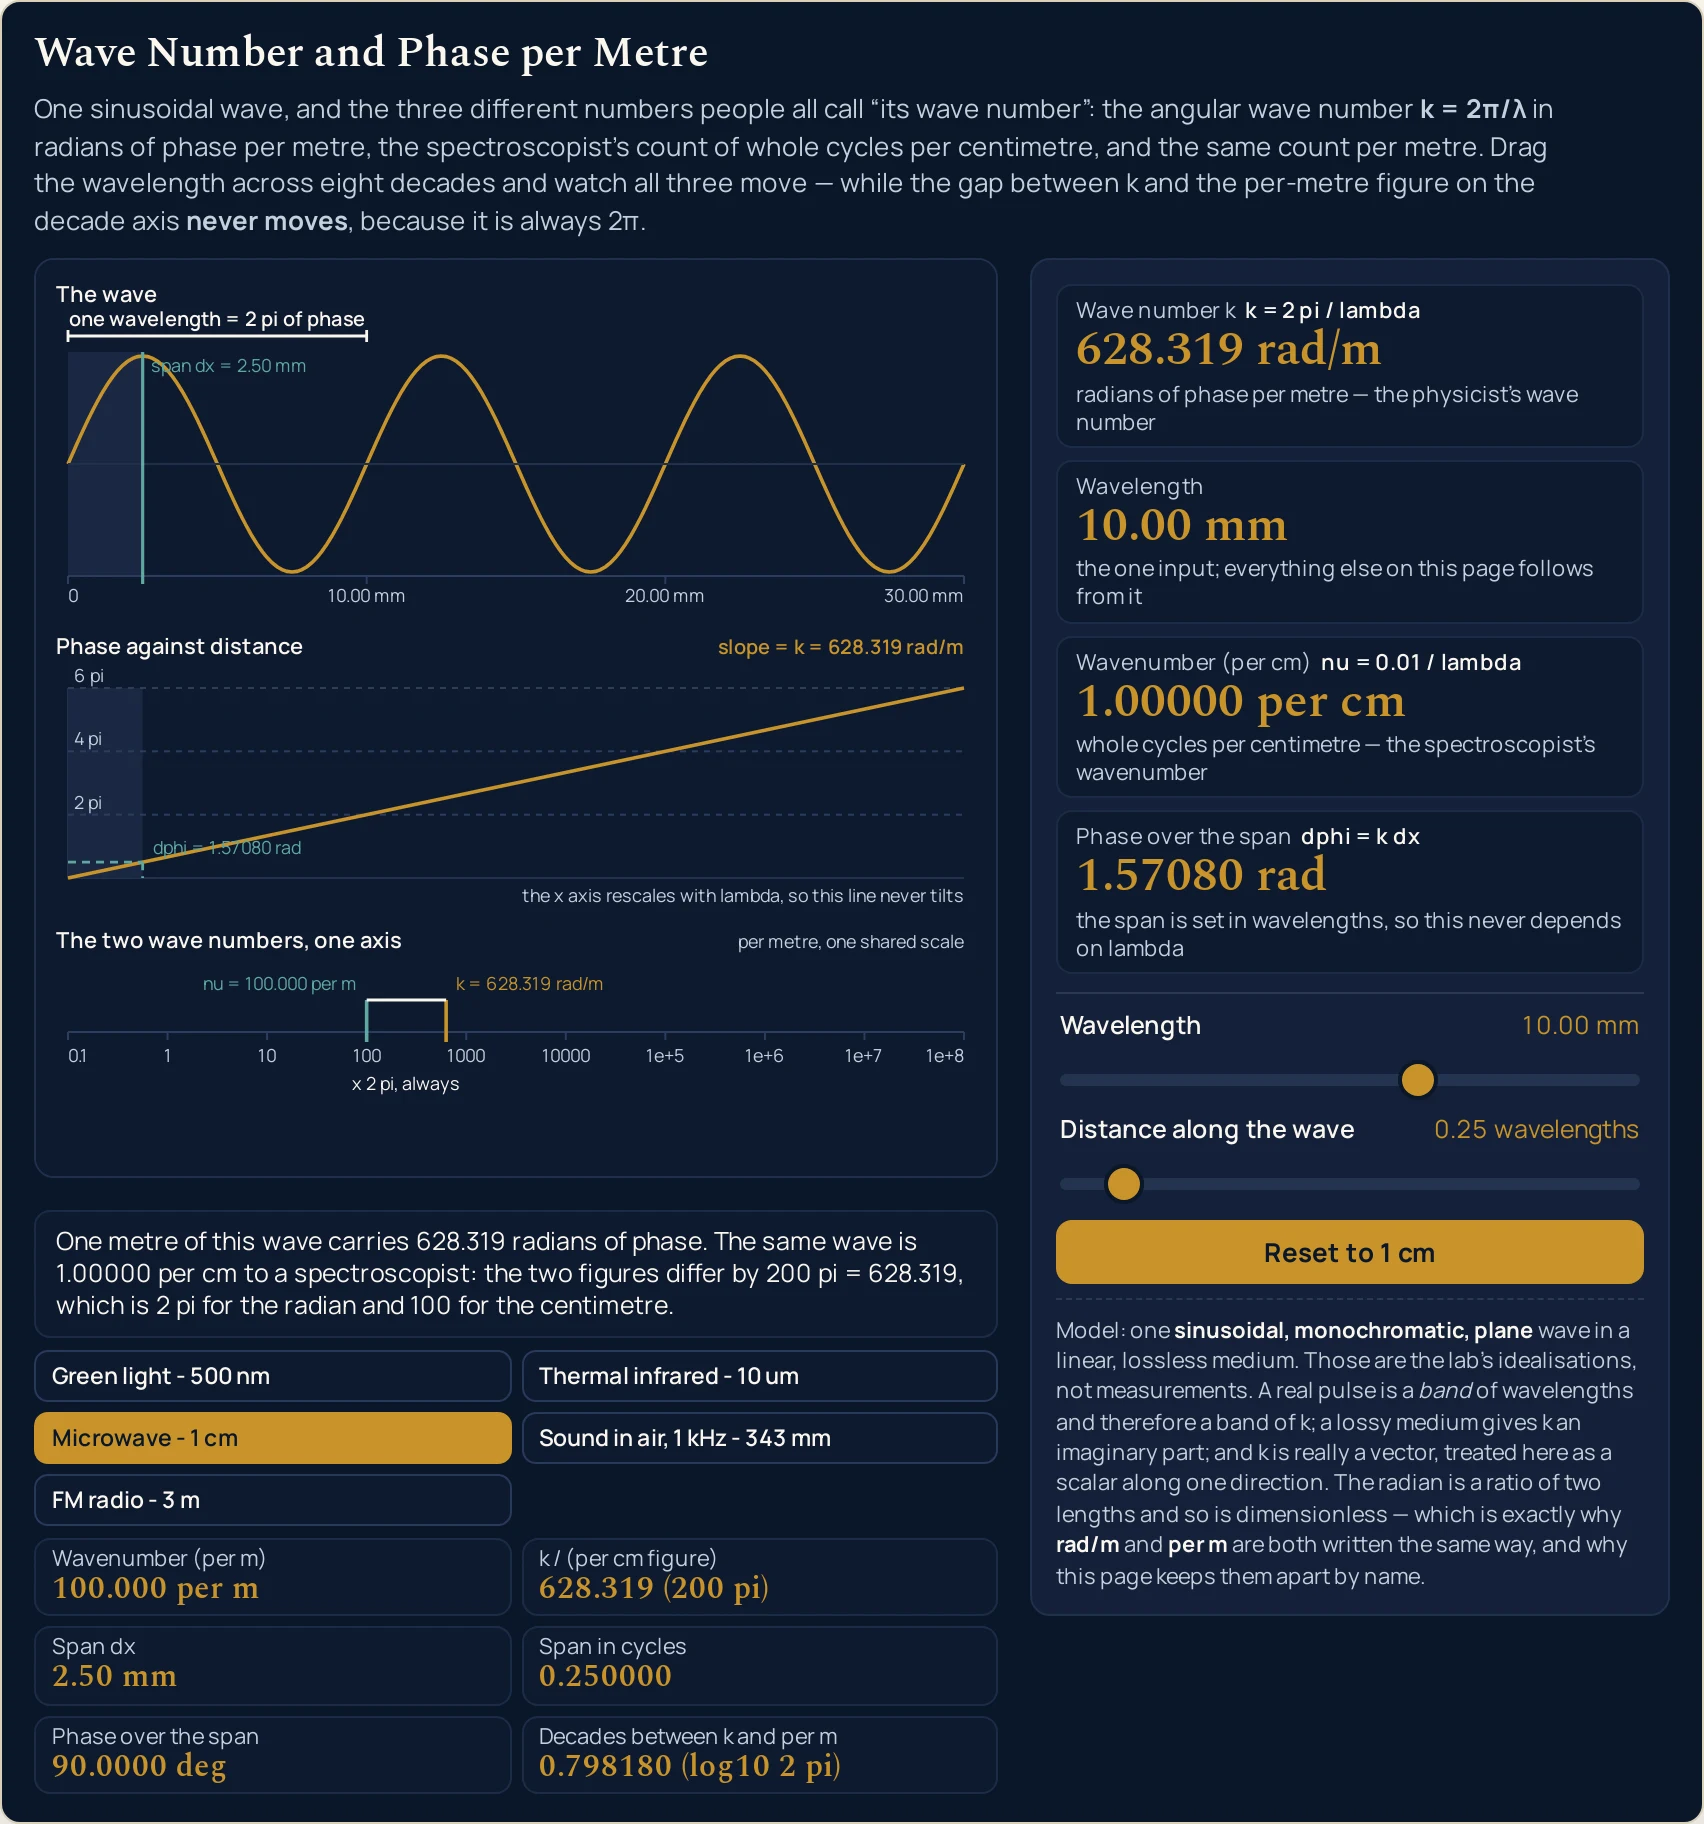
Four cards carry the answer, and two of them show their own definition beside the label. Wave number k is two pi over the wavelength, and Wavelength is the one input both it and everything else is built from. Wavenumber (per cm) is the same wave counted in whole cycles per centimetre. Phase over the span is the wave number multiplied by the distance, and it carries a sub-line that changes when the span is nought and again when it is a whole wavelength.
The lab opens on the 1 cm anchor, where those four read 628.319 rad/m, 10.00 mm, 1.00000 per cm and 1.57080 rad. A compact grid under the drawing adds six more readings, which on that state are 100.000 per m, a ratio of 628.319 (200 pi), a span of 2.50 mm worth 0.250000 cycles and 90.0000 deg, and 0.798180 (log10 2 pi) decades between the angular figure and the per metre one.
That wavelength is the anchor for a reason: it is the one place where both conventions land on a round number, and both are exact rather than nearly so. One centimetre gives exactly one cycle per centimetre and exactly two hundred pi radians per metre, which is why every other figure on the panel can be checked against it.
Two of the six grid cells never change, and they are the point of the whole lab. The ratio cell prints 628.319 (200 pi) in every state the two sliders reach, and the decade cell prints 0.798180 (log10 2 pi), because both are computed from constants rather than by dividing the two cards above them. The angular figure and the cycles figure differ by two pi for the radian convention and by a further hundred for the centimetre; neither factor has anything to do with the wave in front of you.
A sentence strip under the drawing says the same thing in words and rewrites itself on every state. On the opening one it reads One metre of this wave carries 628.319 radians of phase. The same wave is 1.00000 per cm to a spectroscopist: the two figures differ by 200 pi = 628.319, which is 2 pi for the radian and 100 for the centimetre. It is the only place the lab argues rather than reports.
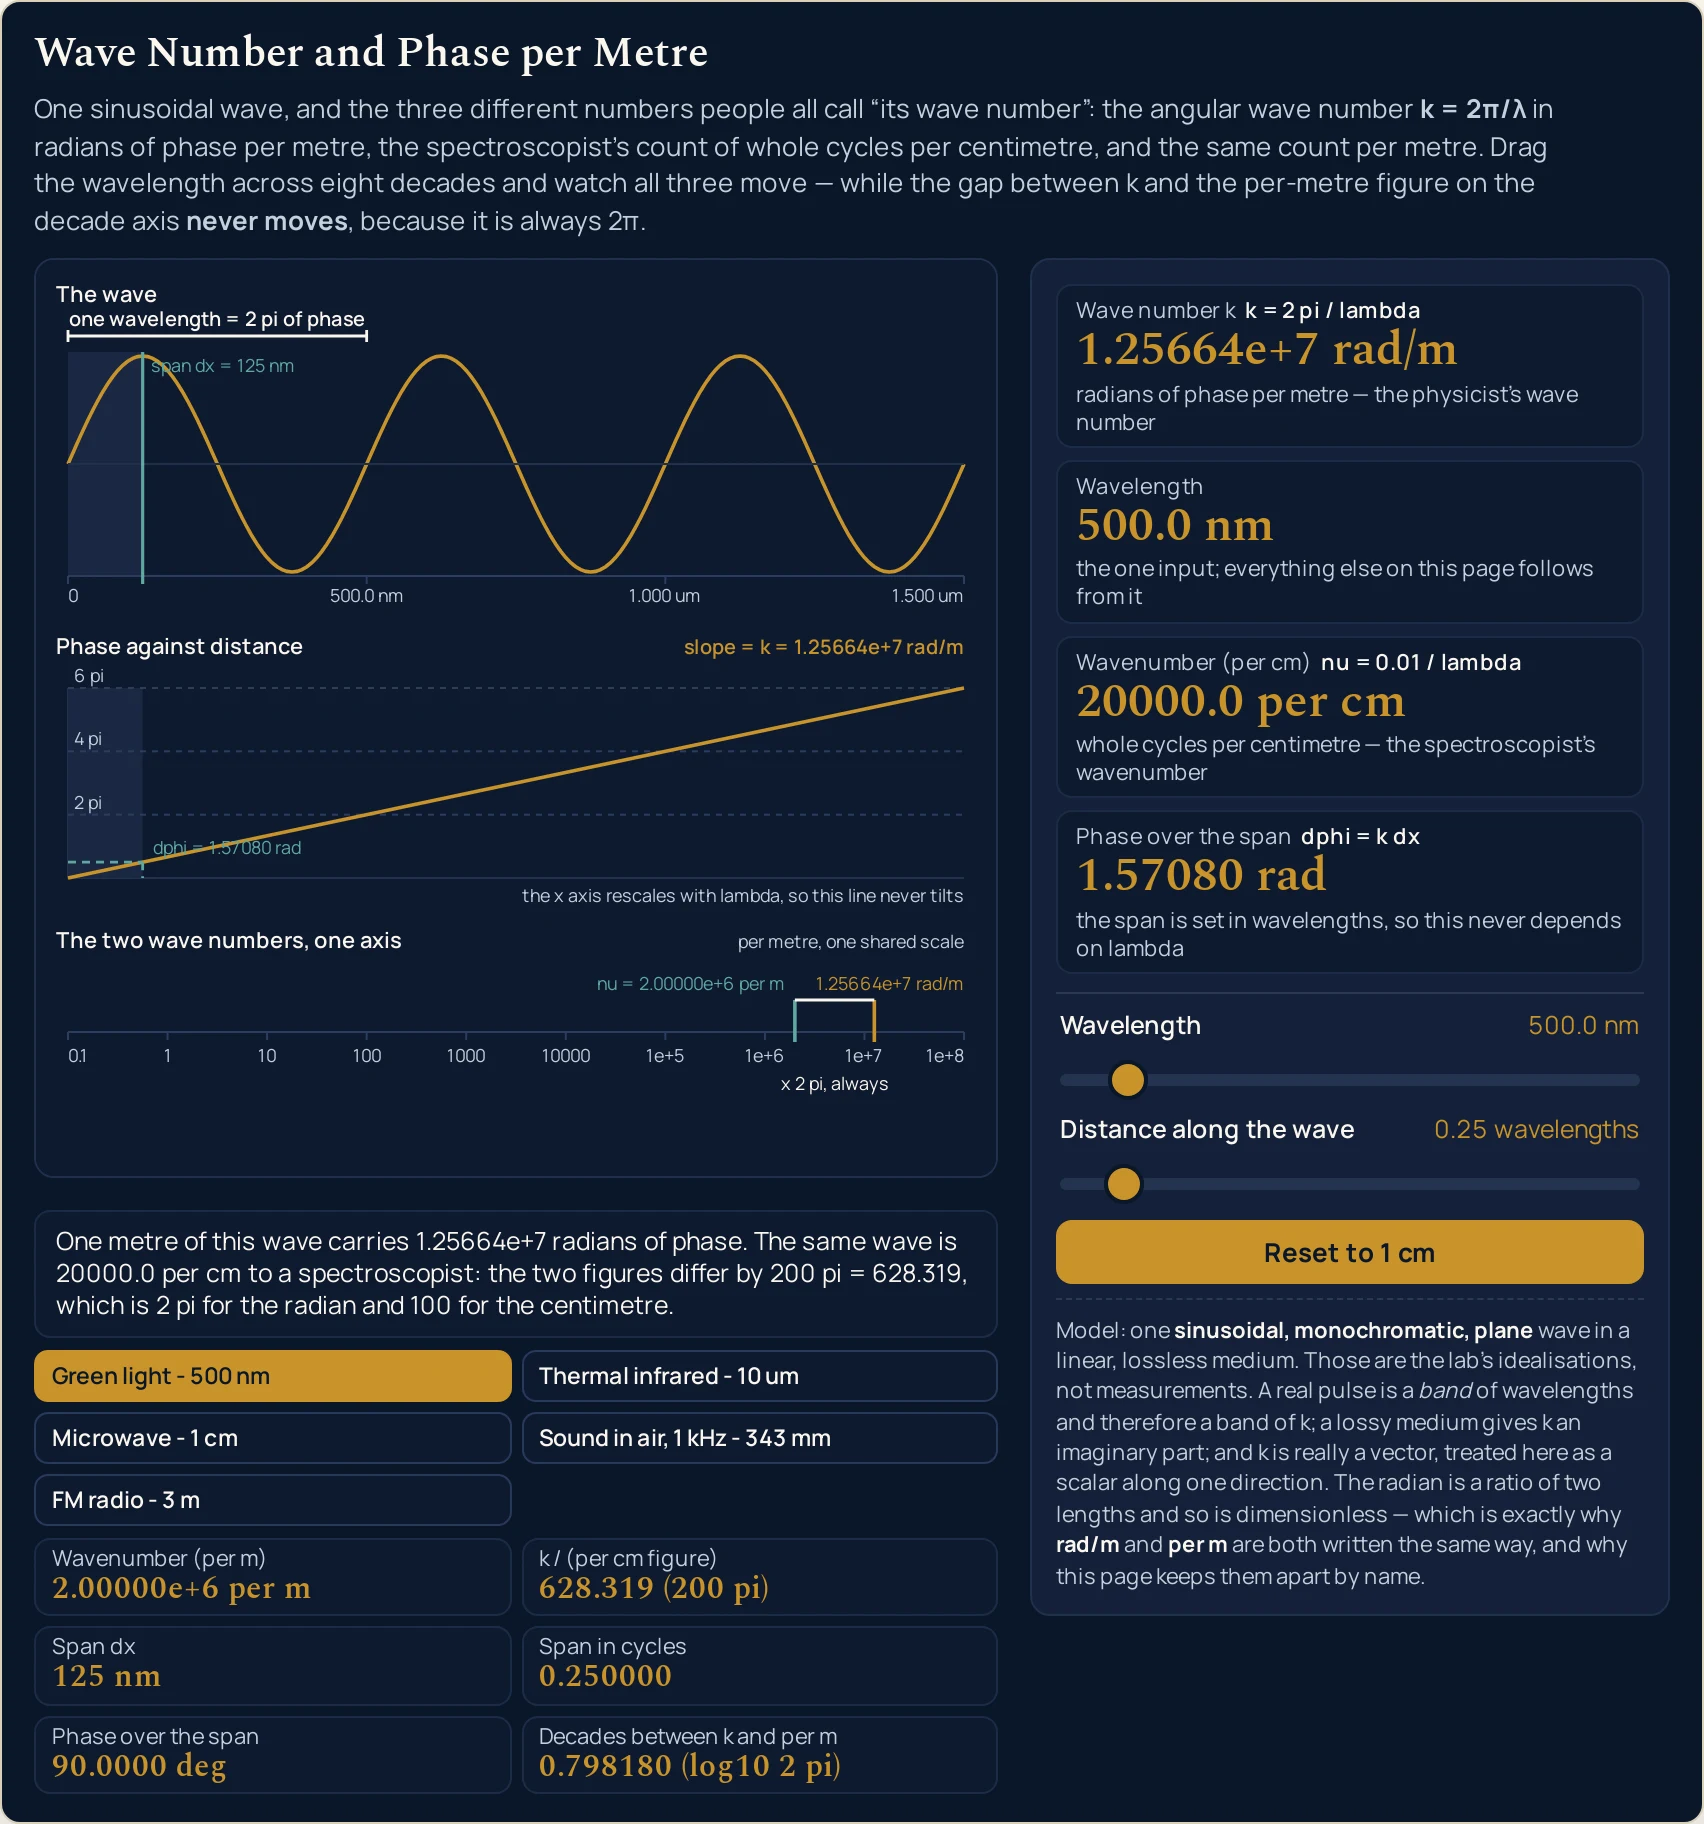
Five preset buttons load published wavelengths across eight decades. Green light at 500.0 nm gives 1.25664e+7 rad/m and 20000.0 per cm; thermal infrared at 10.00 um gives 6.28319e+5 rad/m and 1000.00 per cm; the microwave anchor at 10.00 mm gives 628.319 rad/m and 1.00000 per cm; a 1 kHz note in air at 343.0 mm gives 18.3183 rad/m and 0.0291545 per cm; and an FM radio wave at 3.000 m gives 2.09440 rad/m and 0.00333333 per cm. The first four sit on a quarter wave and the fifth on a whole one.
Because the span is set in wavelengths, the phase card holds 1.57080 rad across the first four presets without moving a digit, while the wave number card runs over seven decades between them. Push the second slider to a whole wavelength instead and the card reads 6.28319 rad at every wavelength on the ladder, which is the two pi identity shown rather than stated. Push it to nought and it reads 0.00000 rad, with its sub-line saying that this is exactly zero and not an error.
The drawing is three labelled bands. The top one plots the wave over exactly three wavelengths with one wavelength bracketed as two pi of phase and the chosen span shaded from the origin; the wave never changes shape as the first slider moves, because only the unit on the axis changes. The middle band plots phase against distance as a straight line whose slope is the wave number, with guides at two pi, four pi and six pi radians that climb from the bottom and stop rather than skipping.
The bottom band is the argument drawn. It is a single decade-anchored logarithmic axis in per metre carrying two marks, the cycles count and the angular figure, with the distance between them captioned as a factor of two pi that is always there. Both marks are placed from one settled position and one constant, so the pair slides along the axis as the wavelength changes without the gap ever stretching. The per centimetre figure gets no mark at all, because it is a different unit and plotting it on a per metre scale would be a category error.
Both conventions are correct, and this lab corrects neither. Dividing one length by another leaves the radian with no dimension to contribute, so a figure quoted as inverse metres passes a dimensional check whichever of the two counts produced it, and the unit symbol has nowhere to record which did. Saying which one you mean every time you quote a figure is the habit the panel is built to encourage.
What the lab does not model, stated as omissions rather than as assumptions that happen to hold. One wavelength only, so a real pulse, which is a sum of wavelengths and therefore a band of wave numbers, is not what these sliders set. A linear, lossless medium, so the wave number stays real where an absorbing medium would give it an imaginary part. A plane wave along one direction, so the figure on the first card is the size of a vector whose direction the panel has no control for.
There is no time axis anywhere on it either, so no frequency and no speed can be read off it. The preset names are shorthand for the wavelengths behind them rather than claims about any particular source, and the 343 metres per second behind the sound preset is a stated convention rather than a measurement.
| Control | Range | Step, default and what it moves |
|---|---|---|
| Wavelength | 100 nm to 10 m | a logarithmic ladder of 801 rungs stepping 1 rung at a time, opening on rung 500, where the label reads "10.00 mm". The label always shows the wavelength formatted, never the exponent behind it, and it switches unit at a micrometre, a millimetre and a metre. The 0.01 exponent grid cannot land on 500 nm, 343 mm or 3 m, so three rungs hold those published wavelengths exactly and the other 798 are the reference script's own ladder value unchanged; the ladder is still strictly increasing. This is the only input the lab has: the wave number, both wavenumber readings and the phase all follow from it |
| Distance along the wave | 0 to 3 wavelengths | a ladder of 301 rungs in hundredths of a wavelength, stepping 1 rung at a time and opening on 0.25, where the label reads "0.25 wavelengths". It is set as a fraction of a wavelength rather than as a distance because a fixed span in metres would be invisible at one end of the first slider and millions of radians at the other. The panel prints the real distance beside it in the grid, as "2.50 mm" on the opening state, so a reader still sees a length. Set it to nought and the phase card reads exactly zero rather than refusing |
| Reset to 1 cm | one button | writes the wavelength slider back to 10.00 mm and the distance slider back to 0.25 wavelengths, which is the state the page arrives on, and lights the microwave preset again. There is no run button and no animation anywhere in this lab: nothing here evolves in time, so a play control would imply a dynamics the model does not have. The only movement on screen is a short ease as the bottom band's marks slide to their new positions after a change |
| Five preset wavelengths | five buttons | green light at 500 nm, thermal infrared at 10 um, the microwave anchor at 1 cm, a 1 kHz note in air at 343 mm and an FM radio wave at 3 m. Each writes both sliders at once, so whichever reading you are watching, the rest describe the same wave. The first four write a quarter wave and the fifth writes a whole one, which is why the phase card is identical across the first four and reads two pi on the fifth. Pressing the infrared and microwave buttons in turn is the fastest way to see the two conventions part company |
How to use the wave number simulator
- Read the four cards before you touch anything. They are already answering for a wavelength of 1 cm: Wave number k
628.319 rad/m, Wavelength10.00 mm, Wavenumber (per cm)1.00000 per cmand Phase over the span1.57080 rad. The first and third are the two quantities this lab exists to keep apart, and each carries its own definition on the line beside its label. - Read the sentence strip under the drawing, because it is the only place the lab argues in words. On the opening state it says
One metre of this wave carries 628.319 radians of phase. The same wave is 1.00000 per cm to a spectroscopist: the two figures differ by 200 pi = 628.319, which is 2 pi for the radian and 100 for the centimetre.Every number in it is rewritten as you drag. - Now drag Wavelength from end to end and watch which readings move. The first card runs from
6.28319e+7 rad/mdown to0.628319 rad/mand the third from1.00000e+5 per cmto0.00100000 per cm. The k / (per cm figure) cell does not move at all, and neither does the decade cell below it. - Watch the bottom band while you do it. Two marks slide along one logarithmic axis in per metre, and the distance between them is fixed: the band labels it
x 2 pi, always. That gap is the whole argument of the lab drawn rather than asserted, which is why the per centimetre figure is deliberately not marked there. - Leave the wavelength alone and drag Distance along the wave instead. It is set in wavelengths rather than metres, from
0.00 wavelengthsto3.00 wavelengths. The phase card climbs to18.8496 radat the top, the degrees cell to1080.00 deg, and the cycles cell reads the slider back to you as3.00000. - Put the distance slider on a whole wavelength. The phase card reads
6.28319 radand its sub-line changes toone whole wavelength is exactly 2 pi of phase, at every lambda. Now drag the wavelength slider underneath it: that card does not move, at any wavelength on the ladder. - Put the distance slider on nought. The phase card reads
0.00000 radand the sub-line changes again, tono distance, no phase: dphi is exactly 0, not an error. The span cell goes to0.00 mmand the degrees cell to0.00000 deg. A nought here is an answer rather than a refusal, which is not true of the wavelength slider. - Look at the top band’s axis labels rather than at the wave. The wave itself never changes shape, because the window is always three wavelengths wide. What changes is the unit:
0,10.00 mm,20.00 mm,30.00 mmat the anchor becomes0,500.0 nm,1.000 um,1.500 umat the green-light preset. - Read the middle band’s own caption before you read its slope. The line is labelled
slope = k = 628.319 rad/m, and underneath it the band saysthe x axis rescales with lambda, so this line never tilts. Only the number on the line moves between wavelengths; the picture cannot be used to compare two of them. - Press Reset to 1 cm when you have finished. It puts both sliders back to
10.00 mmand0.25 wavelengths, which is the state the page arrives on, and lights the third preset button again.
Dragging is the right way to find out which readings move together and a poor way to land on a particular wavelength, because the first slider steps through 801 rungs. The five preset buttons above exist for that reason, and the written wave number guide is where the subject itself is argued from scratch, with the two conventions separated and the problems worked step by step.
One thing this panel cannot do is run either definition backwards. There is no box to type a wave number into and ask for a wavelength, and no way to hand it a figure off somebody else’s spectrum axis. The wave number calculator takes typed numbers and solves in four directions, including those two.
Worked example: change one thing at a time
Nothing in the three tables below was worked out here. Each row is a state the lab was put into through its own controls and then read back from, cell by cell, so every string in them is the panel’s own. The first table moves one slider and holds the other still.
One: the wavelength slider, end to end
The distance slider is held on 0.25 wavelengths throughout and only the wavelength moves, from the short rail to the long one. Read the last two columns across before anything else.
| Wavelength | Wave number | Wavenumber per cm | Wavenumber per m | Span | Phase over the span | The ratio cell | The decade cell |
|---|---|---|---|---|---|---|---|
| 100.0 nm | 6.28319e+7 rad/m | 1.00000e+5 per cm | 1.00000e+7 per m | 25.0 nm | 1.57080 rad | 628.319 (200 pi) | 0.798180 (log10 2 pi) |
| 10.00 um | 6.28319e+5 rad/m | 1000.00 per cm | 1.00000e+5 per m | 2.50 um | 1.57080 rad | 628.319 (200 pi) | 0.798180 (log10 2 pi) |
| 10.00 mm | 628.319 rad/m | 1.00000 per cm | 100.000 per m | 2.50 mm | 1.57080 rad | 628.319 (200 pi) | 0.798180 (log10 2 pi) |
| 1.000 m | 6.28319 rad/m | 0.0100000 per cm | 1.00000 per m | 250 mm | 1.57080 rad | 628.319 (200 pi) | 0.798180 (log10 2 pi) |
| 10.00 m | 0.628319 rad/m | 0.00100000 per cm | 0.100000 per m | 2.50 m | 1.57080 rad | 628.319 (200 pi) | 0.798180 (log10 2 pi) |
The last three columns are the same string five times over, and that is the whole table. Eight decades of wavelength moved the first three columns by eight decades each, left the ratio cell on 628.319 (200 pi) and the decade cell on 0.798180 (log10 2 pi), and left the phase card on 1.57080 rad because the span was set as a fraction of a wavelength rather than as a distance.
The span column is the one that did move, and it is worth a second look. A quarter wave is 25.0 nm at the short rail and 2.50 m at the long one — a factor of a hundred million — for exactly the same 1.57080 rad of phase. That is what a wave number buys you: a rate, which has to be multiplied by a real distance before it means a real phase. Where the wavelength itself comes from is a separate question, and the wavelength formula guide is where it is answered.
Two: the five published wavelengths
These are the presets at the values their own buttons write. Four of the five sit on the quarter wave and the fifth sits on a whole one, which is why the last two columns break step on the bottom row.
| Preset | Wavelength | Wave number | Wavenumber per cm | Wavenumber per m | Distance along the wave | Span | Span in cycles | Phase in radians | Phase in degrees |
|---|---|---|---|---|---|---|---|---|---|
| Green light - 500 nm | 500.0 nm | 1.25664e+7 rad/m | 20000.0 per cm | 2.00000e+6 per m | 0.25 wavelengths | 125 nm | 0.250000 | 1.57080 rad | 90.0000 deg |
| Thermal infrared - 10 um | 10.00 um | 6.28319e+5 rad/m | 1000.00 per cm | 1.00000e+5 per m | 0.25 wavelengths | 2.50 um | 0.250000 | 1.57080 rad | 90.0000 deg |
| Microwave - 1 cm | 10.00 mm | 628.319 rad/m | 1.00000 per cm | 100.000 per m | 0.25 wavelengths | 2.50 mm | 0.250000 | 1.57080 rad | 90.0000 deg |
| Sound in air, 1 kHz - 343 mm | 343.0 mm | 18.3183 rad/m | 0.0291545 per cm | 2.91545 per m | 0.25 wavelengths | 85.8 mm | 0.250000 | 1.57080 rad | 90.0000 deg |
| FM radio - 3 m | 3.000 m | 2.09440 rad/m | 0.00333333 per cm | 0.333333 per m | 1.00 wavelengths | 3.00 m | 1.00000 | 6.28319 rad | 360.000 deg |
Rows two and three are the pair worth pressing in order. On the infrared row the per centimetre card reads 1000.00 per cm while the angular card reads 6.28319e+5 rad/m; on the microwave row they are 1.00000 per cm and 628.319 rad/m. Two conventions, one wave, and a figure that differs by more than six hundred on both rows. The infrared radiation guide is where the per centimetre convention is used in earnest rather than explained.
Row four is the only one that is not light, and it is there so this is not an optics page. A 1 kHz note in air gives 18.3183 rad/m and 0.0291545 per cm — a per centimetre figure of three hundredths, which is where the spectroscopist’s convention stops being the convenient one. The 343 metres per second behind that wavelength is a stated convention, not something measured here.
Row five is set to a whole wavelength on purpose. Its phase card reads 6.28319 rad and its cycles cell 1.00000, which is the two pi identity shown rather than claimed. Note what the panel does not have: no frequency, no speed and no way to get from 3.000 m to a radio dial. The wave speed calculator is where a wavelength meets a frequency.
Three: the distance slider at one wavelength
The wavelength is held on 10.00 mm throughout and only the second slider moves. The last column is the phase card’s own sub-line, which has exactly three forms across the whole range.
| Distance along the wave | Span | Span in cycles | Phase in radians | Phase in degrees | What the card sub-line says |
|---|---|---|---|---|---|
| 0.00 wavelengths | 0.00 mm | 0.00000 | 0.00000 rad | 0.00000 deg | no distance, no phase: dphi is exactly 0, not an error |
| 0.25 wavelengths | 2.50 mm | 0.250000 | 1.57080 rad | 90.0000 deg | the span is set in wavelengths, so this never depends on lambda |
| 0.50 wavelengths | 5.00 mm | 0.500000 | 3.14159 rad | 180.000 deg | the span is set in wavelengths, so this never depends on lambda |
| 1.00 wavelengths | 10.0 mm | 1.00000 | 6.28319 rad | 360.000 deg | one whole wavelength is exactly 2 pi of phase, at every lambda |
| 2.00 wavelengths | 20.0 mm | 2.00000 | 12.5664 rad | 720.000 deg | the span is set in wavelengths, so this never depends on lambda |
| 3.00 wavelengths | 30.0 mm | 3.00000 | 18.8496 rad | 1080.00 deg | the span is set in wavelengths, so this never depends on lambda |
The phase column is the wave number doing its one job. Each row is the span in metres multiplied by 628.319 rad/m, which is why a half wave is 180.000 deg and three wavelengths are 1080.00 deg rather than wrapping back round. The panel never reduces a phase into a single turn, because the distance it was gained over is the point.
Now repeat the table at another wavelength and only one column changes. Hold the second slider anywhere and walk the first: the span cell is the only reading in this table that moves, because it is the only one carrying a length. That is also the fence around this lab — it advances one wave along one direction and has no second wave in it, so a phase here is never a path difference. The wave interference calculator is where two routes to one point belong.
Formula and symbol reference
The band at the head of this page carries both definitions rather than the angular one alone, because the angular one on its own is exactly how a reader ends up out by a factor of six hundred. Every reading on the panel is one of those two definitions, a product of one of them with a distance, or a constant comparing the two.
The symbol column below uses the panel’s own names, spelled the way the lab’s own cards spell them in plain ASCII, with pi and lambda written out rather than drawn. Note the unit column in particular. Because the radian contributes no dimension of its own, rad/m and per m are both perfectly good readings of the same inverse-metre symbol, and the symbol is silent about which of them was meant.
| Symbol or readout | Meaning | SI unit | In this lab |
|---|---|---|---|
| lambda | The wavelength: the distance over which the wave repeats itself once. It is the one input here, and every other number on the panel follows from it | metre (m) | the first slider, a logarithmic ladder of 801 rungs from 100.0 nm to 10.00 m, opening on 10.00 mm. The label shows the wavelength formatted rather than the exponent behind it, switching unit at a micrometre, a millimetre and a metre. Three of the 801 rungs hold a published wavelength exactly, which is why the preset buttons read 500.0 nm, 343.0 mm and 3.000 m rather than the nearest grid value. |
| k | How much phase one metre of travel buys, measured in radians. This is what a physicist means by the bare phrase, and it is the slope the middle band draws | radian per metre (rad/m) | the first card, at six significant figures, in exponential form above a hundred thousand and below a thousandth. It runs from 6.28319e+7 rad/m at the short rail to 0.628319 rad/m at the long one, and reads 628.319 rad/m on the opening state — which is 200 pi exactly, at that one wavelength. |
| nu (per cm) | The spectroscopist’s wavenumber: whole cycles per centimetre, with no radians in it at all. It is the same wave as the card above, counted differently and quoted in a different length unit | per centimetre | the third card, at six significant figures and in the same exponential form. It runs from 1.00000e+5 per cm to 0.00100000 per cm across the slider, and reads 1.00000 per cm on the opening state. That is the whole reason the 1 cm wavelength is the anchor. |
| nu (per m) | The same cycles count in SI, so that it can share an axis with the angular figure. This is the quantity the bottom band marks, never the per centimetre one | per metre | the grid cell labelled Wavenumber (per m), from 1.00000e+7 per m to 0.100000 per m, reading 100.000 per m on the opening state. Compare it with the first card and the factor is 2 pi; compare the first card with the per centimetre one and it is 200 pi. |
| span | How far along the wave to travel, set as a fraction of a wavelength rather than as a distance. Setting it this way is what keeps the shaded region drawable at every wavelength on the first slider | dimensionless (wavelengths) | the second slider, 301 rungs from 0.00 wavelengths to 3.00 wavelengths in hundredths, opening on 0.25 wavelengths. Four of the five presets sit on that quarter wave and the fifth sits on a whole one. |
| dx | The span as a real distance, so the fraction above is never the only thing on screen. It is the wavelength multiplied by the span setting | metre (m) | the grid cell labelled Span dx, at three significant figures rather than the wavelength card’s four. It reads 2.50 mm on the opening state, 0.00 mm at every wavelength when the span is nought, and 30.0 m at the far corner of the two sliders. |
| dphi | The phase the wave gains over that span: the wave number multiplied by the distance. This is what a wave number is for, and it is the only reading here that can legitimately be zero | radian (rad) | the fourth card, from 0.00000 rad to 18.8496 rad. It does not depend on the wavelength at all while the span slider is left alone, which is why the first four presets all read 1.57080 rad. Its sub-line changes at a span of nought and again at a whole wavelength. |
| phase in degrees | The same phase in the unit most people picture a quarter turn in. A quarter wavelength is a right angle on every wave there is, which is the quickest sanity check on the panel | degree (deg) | the grid cell labelled Phase over the span, reading 90.0000 deg on the opening state and running to 1080.00 deg at three whole wavelengths. The cell beside it gives the same thing in cycles, from 0.00000 to 3.00000. |
| 200 pi | The fixed ratio between the angular wave number and the per centimetre wavenumber of one wave. It is 2 pi for the radian multiplied by 100 for the centimetre, and it is a fact about the two definitions rather than about any wave | dimensionless | the grid cell labelled k / (per cm figure), printing 628.319 (200 pi) in every one of the states the two sliders reach. It is computed from the constant and never by dividing the two cards above it, which is why it does not drift by a digit anywhere on the range. |
| log10 2 pi | The same comparison in decades, and in SI on both sides: how far apart the two marks on the bottom axis sit. A constant, for the same reason | decades | the grid cell labelled Decades between k and per m, printing 0.798180 (log10 2 pi) everywhere. The bottom band draws exactly that distance, measured at one value with no spread across the whole slider, and the two decades that separate per metre from per centimetre are explained in text rather than drawn. |
If you read one row twice, make it the last but one. Every other row on the panel is a quantity that depends on the wave in front of you; that one is a property of the two definitions, which is why it is computed from a constant and prints the same eight characters everywhere. A reading that never changes is the easiest one to overlook and the only one worth memorising.
The physics: why the gap on the bottom axis never moves
A sinusoidal wave gains phase in proportion to how far along it you look, so there is one constant of proportionality between distance and phase, and it has to be 2 pi per wavelength. That constant is the angular wave number, and the middle band is it drawn literally: a straight line of phase against distance whose slope is the number on the first card.
Drop the radian and count whole repeats instead, and the factor of 2 pi is simply not there: what is left is the reciprocal of the wavelength. Both numbers describe the wave on screen and both are conventionally written as inverse metres, because the radian is dimensionless and the symbol has no room to say which count is meant. The bottom band puts those two on one shared scale in per metre, and the distance between them is the logarithm of 2 pi.
That is why the gap cannot move. Both marks are placed from one settled position and that one constant, so the pair slides along the axis rigidly as the wavelength changes rather than stretching or closing. Measured from what the browser really painted, across forty-one wavelengths spanning eight decades, the distance between them came out at one value with no spread at all; how many pixels that is depends only on how wide the drawing has been given room to be. A band that captions itself x 2 pi, always has to be able to survive that measurement.
Then a centimetre gets involved and a second factor appears. Because one convention almost never leaves the centimetre behind and the other almost never leaves the metre, the two readings for one wave sit 628.319 apart instead of 6.28319 — the radian’s 2 pi with the centimetre’s 100 on top of it. Separating those two factors is the single most useful thing on the panel, and the sentence strip does it in words on every state.
The last piece is what a wave number buys. Multiply it by a distance and you have a phase, which is the fourth card and the shaded span in the first two bands. A quarter wavelength is a right angle on every wave there is, and the same relation written for time rather than distance is the angular frequency instead, which the simple harmonic motion guide sets out; dividing one by the other gives the phase speed, and the wave speed guide is where that speed comes from.
| Part of the drawing | What it paints | What it does not claim |
|---|---|---|
| the wave band | The top band, titled The wave. One sinusoid over exactly three wavelengths, with the horizontal axis ticked 0, 10.00 mm, 20.00 mm, 30.00 mm on the opening state, one wavelength bracketed and labelled one wavelength = 2 pi of phase, and the span shaded from the origin with its distance printed beside it as span dx = 2.50 mm |
it does not show the wave getting shorter or longer as you drag the first slider, because the horizontal window is always three wavelengths wide. What changes is the unit on the axis: at the green-light preset the same four ticks read 0, 500.0 nm, 1.000 um and 1.500 um. The drawing is a picture of one wavelength’s worth of phase, not of a length |
| the phase band | The middle band, titled Phase against distance. The straight line for the phase over the same horizontal window, with guides at 2 pi, 4 pi and 6 pi that climb from the bottom and stop rather than skipping, the shaded span projected across to give dphi = 1.57080 rad, and the line labelled slope = k = 628.319 rad/m |
it does not claim the drawn slope is comparable between wavelengths, and it says so on the band: the x axis rescales with lambda, so this line never tilts. Only the number on the line changes, by eight decades across the slider. Leaving that caption out would let a reader take a constant picture as evidence that the wave number is constant |
| the two-wave-numbers band | The bottom band, titled The two wave numbers, one axis. A single decade-anchored logarithmic axis in per metre, ticked 0.1 through 1e+8, carrying two marks only: nu = 100.000 per m and k = 628.319 rad/m on the opening state. Between them sits x 2 pi, always, over the note per metre, one shared scale |
it does not mark the per centimetre figure anywhere, because that is a different unit and putting it on a per metre scale would be a category error. It also does not recover the gap by subtracting the two drawn positions: both marks come from one settled fraction and the constant for the logarithm of 2 pi, which is why the gap is one width with no spread rather than a nearly constant one |
| what the picture is for | Watching three numbers that people all call the wave number move together, and watching one distance between two of them refuse to move at all. Every string in all three bands is also printed in the panel beside the drawing, so the picture can be checked against the readings instead of trusted | it is not a measurement of anything. Every pixel is arithmetic on two slider positions, so it shows the shape of two definitions rather than an observation; the wavelengths on the preset buttons are stated figures, and the speed of sound behind the 1 kHz one is a stated convention rather than something this page measured |
The anchor wavelength is exact rather than nearly exact, and that is worth knowing before you quote anything else off this panel. At 1 cm the per centimetre card is one and the angular card is two hundred pi, both exactly, and the cluster’s reference script asserts them with an exact equality. Everywhere else a reciprocal carries a floating-point residue; six significant figures hides it completely, and the printed string is correct at every round decade on the slider.
Where this lab breaks down
Every one of the states the two sliders reach is answered, and the arithmetic is not where this panel can let you down. What it cannot do is be a real wave, and what it refuses to do is treat its own idealisations as facts. The first two items below matter more than the rest put together.
- An inverse-metre figure does not record which of the two it is counting
- Read this one before any of the others. Hand somebody a number in inverse metres and you have told them the dimensions and nothing else: radians and whole cycles are both counted in that unit, because the radian brings no dimension of its own to the comparison. A university textbook defines the angular wave number and gives it inverse metres; a standards body publishes a constant in the same inverse metres and footnotes that the unit counts cycles. Neither is wrong and this lab corrects neither — it simply prints the two counts in separate cards so that nobody has to guess.
- The centimetre in the second convention is a habit rather than physics
- No law singles that length out. Spectroscopy settled on it because the numbers come out in a comfortable range when it is used, and the 1 kHz sound preset is what happens when they do not:
0.0291545 per cmis an awkward figure for an everyday sound. Leaving the habit costs a factor of one hundred, which the panel keeps visible as part of the200 pirather than burying inside a single ratio. - The panel draws one wavelength, and nothing real is ever only one
- The lab draws a single sinusoid that repeats for ever. Add wavelengths together and what you have is a pulse, which therefore owns a whole range of wave numbers instead of a single one; squeeze the pulse into less space and that range widens. Neither slider here can set a range, so a figure taken off this panel stands in for a pulse only as an average.
- A crest and a pulse need not travel at the same speed
- Take an angular frequency, divide it by the figure on the first card, and what comes out is how fast a crest moves. Where the medium makes that speed depend on wavelength, the outline of a pulse and the crests running along inside it part company and move at different rates. Neither rate can be had from this panel, which has no time axis on it at all; the distinction is named here only so nobody leaves assuming a wave has one speed.
- A plane wave along one axis is the only thing the top band can draw
- Taking the first card as a plain number is an assumption about geometry, and it is the assumption the drawing makes. The quantity really points somewhere, and the first card gives only how long that arrow is. Send the wave into a surface at a slant, or let it spread in two or three dimensions, and where it points is the half of the answer that decides what happens; nothing on these two sliders sets it.
- A lossy medium gives the wave number an imaginary part
- The fixed line under the controls says the medium is linear and lossless, which makes the wave number a real number. Put the same wave through something that absorbs it and the quantity grows a second component, one that measures how quickly the amplitude falls off rather than how quickly the phase turns. Every figure on this panel is only the turning half of that, and it has nothing to say about the falling half.
- There is only ever one wave on this panel
- The phase card follows a single wave outwards from the origin in a single direction. It has no second wave in it and no second route, so it cannot answer whether two paths to the same point arrive in step — that is a path difference and a different calculation. The wave interference guide is where two waves belong, and the interference of waves simulator draws what they do.
- The sliders are ladders, and three of their rungs are special
- The wavelength control steps through 801 fixed rungs on a logarithmic grid and the distance control through 301, so the panel reaches a finite set of states and nothing between them. That grid cannot land on 500 nanometres, 343 millimetres or 3 metres exactly, and the nearest rungs would print
501.2 nm,346.7 mmand3.020 minstead. Those three rungs therefore hold the published figure exactly, so that a button titled with one number is never contradicted by the readout beside it. - The lab runs one way only, and measures nothing
- You set a wavelength and a span and it reports what they imply. There is no box to type a wave number into, no unit menu, and no way to hand it a figure from somebody else’s spectrum. Every reading is arithmetic on two slider positions, no number here came from an instrument, and the preset names are shorthand for the wavelengths behind them rather than claims about any particular source. Verify any figure against your own before you use it.
Where the wave number simulator is actually used
- Finding out which wave number a figure you were handed actually is
- This is the question the panel exists for. Drag the wavelength until the card that matches your source’s units shows your figure, then read the other card: at
10.00 umthey are1000.00 per cmand6.28319e+5 rad/m, which is the size of the mistake available. If the source wrote the angular definition or said radians, it is the first card; if it said cycles, or the number came off a spectrum axis, it is the third. - Seeing why the ratio is a property of the definitions, not of the wave
- Press all five buttons in turn and the first card changes by seven decades while the k / (per cm figure) cell prints
628.319 (200 pi)every single time. That is the difference between a conversion factor and a measurement, drawn on the bottom band as a gap that slides but never stretches. It is also why the cell is computed from the constant rather than from the two cards above it. - Making sure the figure you are about to substitute is the right one
- Any expression for a travelling wave wants the angular figure in radians per metre alongside a distance in metres, and a number lifted off a spectrum axis is out by
200 pibefore the substitution has even been written down. Load the anchor preset and the two forms sit one card apart, which makes the check a glance rather than a calculation. The infrared radiation calculator is the sibling tool whose own wavenumber field uses the per centimetre convention throughout. - Working out how much phase a given path adds
- Set the wavelength, then set the distance slider and read the fourth card in radians with the grid giving degrees and cycles beside it. A quarter wave is
90.0000 degand a half is180.000 degon every wave the panel can reach, which is the sanity check worth doing first. Keep in mind that the span is entered in wavelengths, so the span cell is where the real distance appears. - Showing a class that a convention and a unit are two separate things
- Press the anchor button and a single wave is carrying two correct answers at once,
1.00000 per cmand628.319 rad/m. The sentence strip then splits the difference into the2 piof the radian and the100of the centimetre in plain words. One wavelength, two correct answers and one unit symbol that cannot tell them apart is the lesson in a single screen. - Getting a feel for how big a wave number is before you quote one
- Eight decades of wavelength on one slider is a quick way to find out that the angular figure for green light is tens of millions per metre and the one for a metre-scale radio wave is about two. The electromagnetic spectrum guide is where those wavelengths are laid out in order, and the frequency formula guide is the one to open if what you actually have is a frequency.
- Separating a space question from a time question
- Nothing on this panel moves, and that is deliberate: a wave number is a statement about a wave in space at one instant. If what you need is how fast a crest travels or how often it arrives, that is the other half of the subject and a different tool — the wave speed simulator moves frequency, wavelength and speed against one another, and the standing waves simulator is a case where the ends of a string choose the wavelength for you.
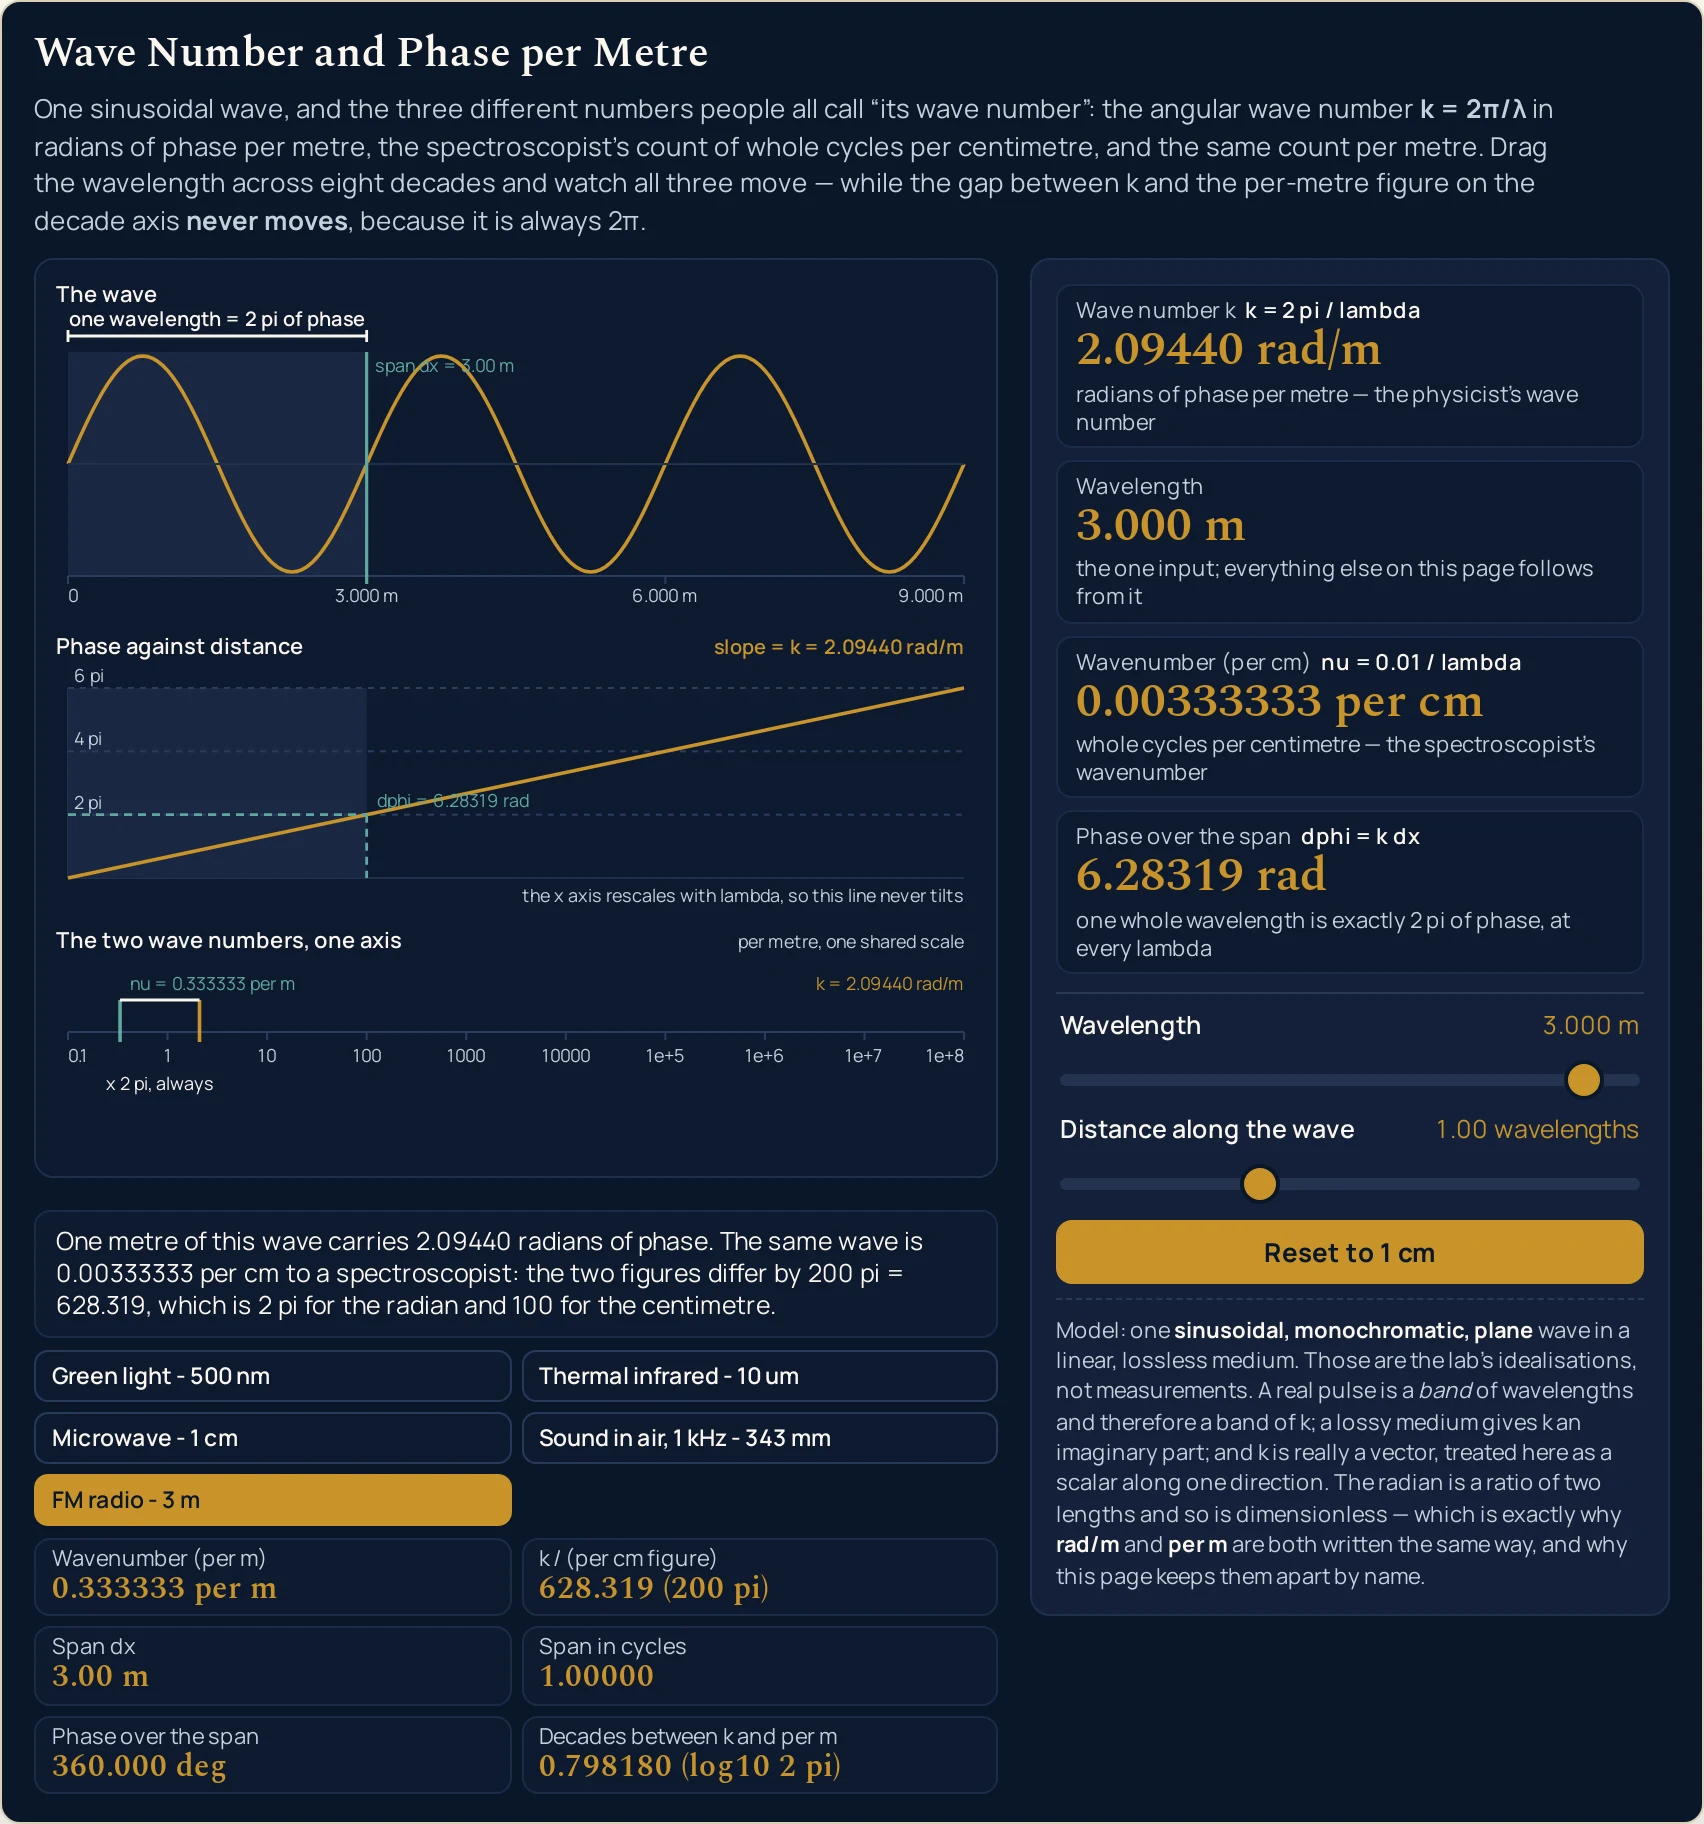
6.28319 rad and the cycles cell 1.00000, which is the 2 pi identity displayed instead of asserted, and the projected step in the middle band lands on the first guide. Band text is as drawn at this page’s width.Where to go next
A panel can put you in a state and let you move one thing at a time, and that is the end of what a panel is for. The wave number guide is where the subject is written out: what each of the two definitions counts, how the 200 pi is built from a convention and a unit, what two sources with one unit symbol between them actually say, and the problems worked step by step.
Two posts own the quantities this lab takes as given. The wavelength formula guide is where the number on the first slider comes from, and the wave speed guide is where the speed that would turn it into a frequency comes from. Neither is answered on this panel, which has no frequency and no speed on it at all.
Three more pick up what this lab names but does not develop. The infrared radiation guide is the per centimetre convention in use, the wave interference guide is where a phase becomes a path difference between two waves, and the electromagnetic spectrum guide is where the wavelengths on the preset buttons sit relative to one another.
On the tool side, the wave number calculator takes typed figures and solves in four directions, the wave speed calculator adds the frequency and the speed, the infrared radiation calculator carries the per centimetre convention through to a spectrum, and the wave interference calculator takes two waves and a path difference.
Three neighbouring pictures sit beside this one: the wave speed simulator, the interference of waves simulator and the standing waves simulator. Beyond them there is the simulation library, an index of calculators, and the blog for everything written out at length.
Frequently asked questions
Which wave number does the big card show, two pi over lambda or one over lambda?
The first card is the angular one, two pi over lambda, and it says so in its own equation line. It counts radians of phase per metre and reads 628.319 rad/m on the opening state. The third card is the other convention, one over lambda expressed per centimetre, and on that same state it reads 1.00000 per cm. Both describe the one wave on screen.
The ratio cell reads two hundred pi, so where did the extra hundred come from?
Because two separate factors are stacked. The two pi is the radian convention and the hundred is the centimetre, so the card reading k over the per centimetre figure prints 628.319 in every state the two sliders reach. Switch the comparison to the per metre figure instead and the factor is two pi alone, which the decade card prints as 0.798180 decades.
Why does the gap between the two marks on the bottom axis never change?
Because both marks are placed from one settled position and one constant, not from dividing the two displayed numbers. The lower mark is the per metre figure and the upper is the angular wave number, and the distance between them is the logarithm of two pi, which no wavelength changes. Drag the wavelength from end to end and the pair slides along the axis rigidly.
Why is the distance slider measured in wavelengths instead of in metres?
Because the wavelength slider spans eight decades, and a fixed distance in metres would be invisible at one end and millions of radians at the other. Setting the span in wavelengths keeps the shaded region drawable everywhere. The panel still prints a real distance beside it: on the opening state the span cell reads 2.50 mm, which is a quarter of 10.00 mm.
Why does the phase card read the same number at wavelengths eight decades apart?
Because the distance slider is set in wavelengths, so a quarter wave is a quarter turn whatever the wavelength is. Press the first four presets in turn and the phase card holds 1.57080 rad while the wavelength card goes from 500.0 nm at the green-light preset to 343.0 mm at the sound one, and the wave number card runs from 1.25664e+7 rad/m down to 18.3183 rad/m. The card sub-line says so.
What does the straight line in the middle band actually show?
It shows phase against distance, so its slope is the wave number itself and the band labels it with the number. The line looks identical at every wavelength because the horizontal axis is always three wavelengths wide rather than a fixed number of metres. The band states that in words, so the drawing is not read as a slope comparison across wavelengths.
Why is the per centimetre figure not marked on the bottom axis?
Because that axis is a single scale in per metre, and plotting a per centimetre number on it would be a category error. The band carries two marks only, the cycles count per metre and the angular wave number, with the caption naming the factor between them. The per centimetre figure lives in its own card and in the ratio cell instead.
What happens if I set the distance slider to zero?
The phase card reads 0.00000 rad and the card sub-line changes to say that this is exactly zero rather than an error. No distance means no phase advance, which is a real answer and not a refusal. The span cell reads 0.00 mm, the cycles cell 0.00000 and the degrees cell 0.00000 deg, at every wavelength the first slider can reach.
How many digits of the readings should I trust?
The wave number and the two wavenumber cards print six significant figures, switching to exponential form above a hundred thousand and below a thousandth. The wavelength card prints four and the span cell three. Those are display choices, not claims about precision: verify any figure against your own source before you use it, because the lab measures nothing.
References & formula source
- Every figure on this page comes from two definitions and one multiplication. A sinusoidal wave gains phase in proportion to distance, so the constant of proportionality is two pi per wavelength and that constant is the angular wave number in radians per metre. Count the same wave in whole cycles instead of radians and the two pi is gone, leaving one over the wavelength, which is conventionally quoted per centimetre. The phase over a span is the angular wave number multiplied by the distance. The relations are applied here rather than derived; the written guide derives them and works the problems.
- A university textbook chapter on the mathematics of waves, read on 13 November 2026, is one of the two sources behind the angular convention. Two things are taken from it rather than paraphrased: that the phase angle of a travelling wave grows as two pi over the wavelength multiplied by the position, and that the value two pi over the wavelength is defined as the wave number, written with the symbol k and given units of inverse metres. That is the definition the first card on the panel implements, and the unit it names is the one this whole cluster is about.
- The second source is a national metrology institute, read on 13 November 2026, which publishes the Rydberg constant in those same inverse metres and attaches a footnote to the unit rather than to the value: its full description, that footnote says, is cycles or periods per metre. Both statements are correct and this page corrects neither. The radian is built from one length divided by another, which leaves it with no dimension to contribute, so a figure in inverse metres survives a dimensional check whichever of the two counts produced it; the symbol has nowhere to record which did. Saying which one you mean is the habit this lab exists to build, and nothing here implies the two sources disagree about any physics.
- The two hundred pi is not a rounding of anything. It is two pi for the radian convention multiplied by exactly one hundred for the centimetre, which is 628.3185307179587, and the grid cell prints it from that constant rather than by dividing the two cards above it. An independent reference script, written before the simulation and sharing no code with it, measured the ratio across all 801 wavelengths the first slider reaches and found a worst relative error of 1.809 in ten thousand million million. The companion comparison in SI on both sides, which is two pi, came out at 1.414 in ten thousand million million.
- The one centimetre wavelength is the anchor because both conventions land on a round number there, and both are exact rather than nearly exact. At that wavelength the per centimetre card is one and the angular card is two hundred pi, and the reference script asserts both with an exact equality rather than a tolerance. Everywhere else the reciprocals carry a floating-point residue that six significant figures hides completely: over the nine round decades on the slider, the printed string is wrong at none of them, while the raw double differs from the clean value at two.
- The wavelength slider is a ladder of 801 rungs, not a continuous control, and three of those rungs are special. The exponent grid the slider steps on cannot reach 500 nanometres, 343 millimetres or 3 metres exactly, and the nearest rungs would print 501.2 nanometres, 346.7 millimetres and 3.020 metres instead. A button titled with one figure whose readout shows another is a caption the drawing does not honour, so those three rungs hold the published wavelength exactly and the other 798 are the reference script's own ladder value unchanged. The ladder is still strictly increasing, and the test suite asserts exactly that split.
- The simulation was gated before this page was written: a reference oracle at 37 checks with none failing, a Node tier at 132 checks with none failing, a headless Chrome tier at 127 checks with none failing over five viewports and ten narrow iframe columns, a mutation pass that killed 38 of 42 planted faults with all four survivors explained by an executed proof and ten deliberately bad mutants rejected, a height pass at a measured maximum of 910 pixels against a 1000 pixel ceiling, and a cross-browser pass comparing 129 readout values in Chrome and Firefox at four widths with every one identical. Every table cell on this page was read back out of the running simulation rather than computed here.
- What was not verified, stated as a gap rather than left to be assumed. Safari and WebKit: the build on the machine this was tested on will not start, so Safari was never exercised and nothing on this page is evidence about it. Assistive technology: both sliders carry a label and a live value text and the drawing carries a full description of all three bands, but no screen reader was driven and no real touch target was pressed. And the webfonts as a reader gets them, since there are no system faces on the test machine and the exact pixel widths a reader sees were not measured.
- Nothing on this page is a measurement, and the preset names are shorthand for the wavelengths behind them rather than claims about any particular source. The model is one sinusoidal, monochromatic, plane wave in a linear, lossless medium, and every one of those words is an idealisation the panel prints in a fixed line under its own controls. The 343 metres per second behind the sound preset is the conventional speed of sound in air near twenty degrees Celsius already used elsewhere on this site, stated as a convention rather than measured here. Verify any figure against your own source before you use it for anything that matters.
- Further reading: Wavenumber — Wikipedia