The field inside a ring falls as 1/r, and outside the ring it is nothing at all. This toroid simulator is a free interactive lab that lets you drive that one sentence: pick the turns, the current and the core, then slide a probe out from the hole to the outer edge and read what the field does. On arrival the four cards answer 5.000 mT, 1.6667x, 0 T and 5.108 mT.
The fourth of those is the one to look at first. It is the real average across the core, and the sentence under it says the mid-radius reading is 2.165% low — so the single number a quick calculation gives you is the one in the first card, and it is short. Press the fourth preset and that shortfall becomes 15.525% on a ring whose outer radius is four times its inner one.
Toroid Simulator
One ring core, seen in cross-section. Set the turns, the current and the core, then slide the probe from the inner edge to the outer edge and watch the field fall as 1/r. In the hole and outside the ring a circle links no current at all, so the ideal field there is exactly zero. The fourth readout is the point: the average field is not the mid-radius value.
Load a Real Core
Each button writes the four sliders and nothing else; the simulation does every calculation itself, exactly as it would if you had dragged them. There is no mode to pick and no animation to wait for, so each one lands on a finished state immediately.
Press the second and then the third if you only press two. They are the same core carrying the same winding at the same current, and the only thing that moves between them is where the probe sits.
Pick one of the five cores above, or drag the four sliders yourself.
What Is the Toroid Simulator?
The toroid simulator is a free interactive physics lab that runs in your browser, with nothing to install and no sign-up. One ring-shaped core is drawn in cross-section, and the panel beside it answers two questions: how strong the field is at the radius you are probing, and what it is in the hole and outside the ring, where a circle links no current at all.
Three ladders and a probe drive it. Turns N steps through eight fixed values from 10 turns to 2000 turns, Current I through eight from 0.01 A to 10.0 A, and Core through six sizes and shapes from a ferrite bead to a large transformer core. Probe radius r then runs from the inner edge to the outer edge in twenty steps, printing the radius in centimetres rather than the fraction. Every state the lab can reach is one of those 8,064 combinations, which is why any reading quoted about it can be arrived at exactly rather than approached.
Four cards carry the answer, and each has a sentence under it naming what it belongs to. Field at the probe gives the field where the probe sits and its sub-line names the radius, so nothing on this panel is ever quoted without the radius it was taken at. Inner edge vs outer edge gives the ratio of the strongest reading in the core to the weakest, and that ratio is pure geometry rather than a consequence of the winding. Field outside the ring and True average across the core are the two that catch people out.
The lab opens on 500 turns at 2.0 A on a mains transformer core with the probe at its mean radius. A compact grid under the cards adds six more readings, which at that opening state are 6.667 mT at the inner edge, 4.000 mT at the outer edge, an average sitting at 3.92 cm, a flux of 2.0433 uWb, an inductance of 510.8256 uH and 1989 turns/m on the row labelled the same ring as a solenoid.
Field outside the ring is the literal string 0 T on every one of those 8,064 states, because the lab decides that case in a branch of its own and never by dividing. That zero belongs to the ideal case and to nothing else. The lab own assumptions are printed in a fixed line under the drawing: a perfectly symmetric winding with no current running round the plane of the ring, air-cored with a relative permeability of one, a rectangular cross-section and a steady current. A real coil breaks the first two, so the honest claim about a wound toroid is that its leakage flux can be made low rather than that it is nothing.
True average across the core is the reading worth slowing down for. The area-average field across the cross-section is not the value at the middle of it, because integrating puts the average at the logarithmic mean radius, and the sentence under the card turns the shortfall into a percentage for the core on screen. A ferrite or laminated-iron core would multiply every field here by its own relative permeability, and no figure for that multiplier is assumed anywhere in this lab.
The drawing beside the panel is three labelled bands. The top band shows the core in cross-section, shaded by field strength and brightest at its inner edge, with a dashed circle for the loop through the probe and a labelled scale bar in centimetres; the winding is not drawn, and the caption says so.
The middle band plots the field against distance from the axis and marks two horizontal levels, the average above the mid-radius value; its caption states that the two step edges at the core faces are an idealisation rather than a measurement. The bottom band is one shared logarithmic field axis from one nanotesla to one tesla with a tick at every decade, and it measures a field alone, so no horizontal distance in the band above it means anything on this one.
| Control | Range | Step, default and what it moves |
|---|---|---|
| Turns N | 10 to 2000 turns | a ladder of 8 fixed rungs - 10, 25, 50, 100, 200, 500, 1000 and 2000 turns - so the slider itself steps 1 index at a time and opens on rung 5, where the label reads "500 turns". The field is exactly proportional to it, and the inductance row goes as its square: 500 turns to 2000 turns takes 510.8256 uH to 8.1732 mH |
| Current I | 0.01 to 10 A | a ladder of 8 fixed rungs from 0.01 A to 10.0 A, stepping 1 index at a time and opening on rung 5, where the label reads "2.0 A". Only the product of the turns and the current enters the relation, so a thin winding at a large current and a thick one at a small current are the same ring to this lab. The inductance row does not move when it does |
| Core | 6 cores | a ladder of six sizes and shapes - a ferrite bead, a small ferrite ring, a medium ring, a mains transformer core, a large transformer core and a wide ring - stepping 1 index at a time and opening on rung 3, where the label reads "mains transformer core". It is the only control that moves the ratio card, the flux row or the inductance row, because all three are set by the geometry alone |
| Probe radius r | inner to outer edge | step 0.05 of the way across the core, so 21 rungs, opening half way where the label reads "4.00 cm" and the sub-line reads "mid-way across the core". It prints the radius in centimetres rather than the fraction, and it is measured from the ring axis - the line through the middle of the hole - and never from the wire. Both ends are exact: rung 0 prints the inner-edge grid row and rung 20 prints the outer-edge one |
| Reset | one button | restores the opening state - 500 turns at 2.0 A on the mains transformer core with the probe at 4.00 cm - and replays the opening settle, so the scene is drawn in rather than cut to. That state reads 5.000 mT at the probe with the ratio at 1.6667x, and nothing is left animating once it has landed. There is no run button and no animation anywhere in this lab, because nothing in it evolves in time |
How to Use the Simulator
- Read the four cards before you touch anything. They are already answering for 500 turns at 2.0 A on a mains transformer core, probed at its mean radius: Field at the probe
5.000 mT, Inner edge vs outer edge1.6667x, Field outside the ring0 Tand True average across the core5.108 mT. - Read the sentence under each card, because that is where the panel shows its hand. They read
4.00 cm from the axis, mid-way across the core,exactly b/a, whatever the turns and current,a circle out here links no current at allandthe mid-radius reading is 2.165% low. - Drag Probe radius r all the way left. At
3.00 cmthe first card becomes6.667 mTand its sub-line changes to3.00 cm from the axis, at the inner edge. That is the strongest field anywhere in this core, and it is the same string the grid row at the inner edge has been printing all along. - Now drag it all the way right. At
5.00 cmthe first card reads4.000 mT, matching the at the outer edge grid row. Those two ends are exact by construction rather than by rounding, so the ladder has no off-by-one at either stop. - Watch the second card while you do all of that. It does not move. The ratio of the two edge fields is
1.6667xwherever the probe is, and that is the ratio of the two radii and nothing else. - Put the probe back in the middle and move Turns N instead. At the bottom rung,
10 turns, the first card reads100.000 uT; at the top rung,2000 turns,20.000 mT. The inductance row moves faster, because it goes as the square:510.8256 uHbecomes8.1732 mH. - Move Current I with everything else held still.
0.01 Agives25.000 uTand10.0 Agives25.000 mT, while the inductance row does not budge off510.8256 uH. Current moves the field and leaves the geometry alone. - Move Core through all six rungs. The scale bar in the top band rescales as you go and the second card changes with it, from
2.0000xon the ferrite bead to4.0000xon the wide ring. Nothing between the rungs exists: the slider steps one core at a time. - Check the third card at every setting you try. It is
0 Ton all of them. That is a branch returning a literal zero rather than a very small division, which is why it never drifts to something like a nanotesla. - Press Reset when you have finished. It puts the four sliders back to
500 turns,2.0 A,mains transformer coreand4.00 cm, and replays the opening settle so the scene is drawn in rather than cut to.
Dragging is the right way to find out which readings move together and a poor way to land on a particular state, because three of the four controls step by whole rungs. The five preset buttons above exist for that reason, and the written toroid guide is where the argument is made from scratch and the problems are worked with every step shown.
One thing this panel cannot do is take a turn count, a current or a radius that is not on a rung, and the three inverse questions are beyond it altogether. The toroid calculator takes typed figures, and it will run the relation backwards as well: the turns, the current or the radius behind a field you already have.
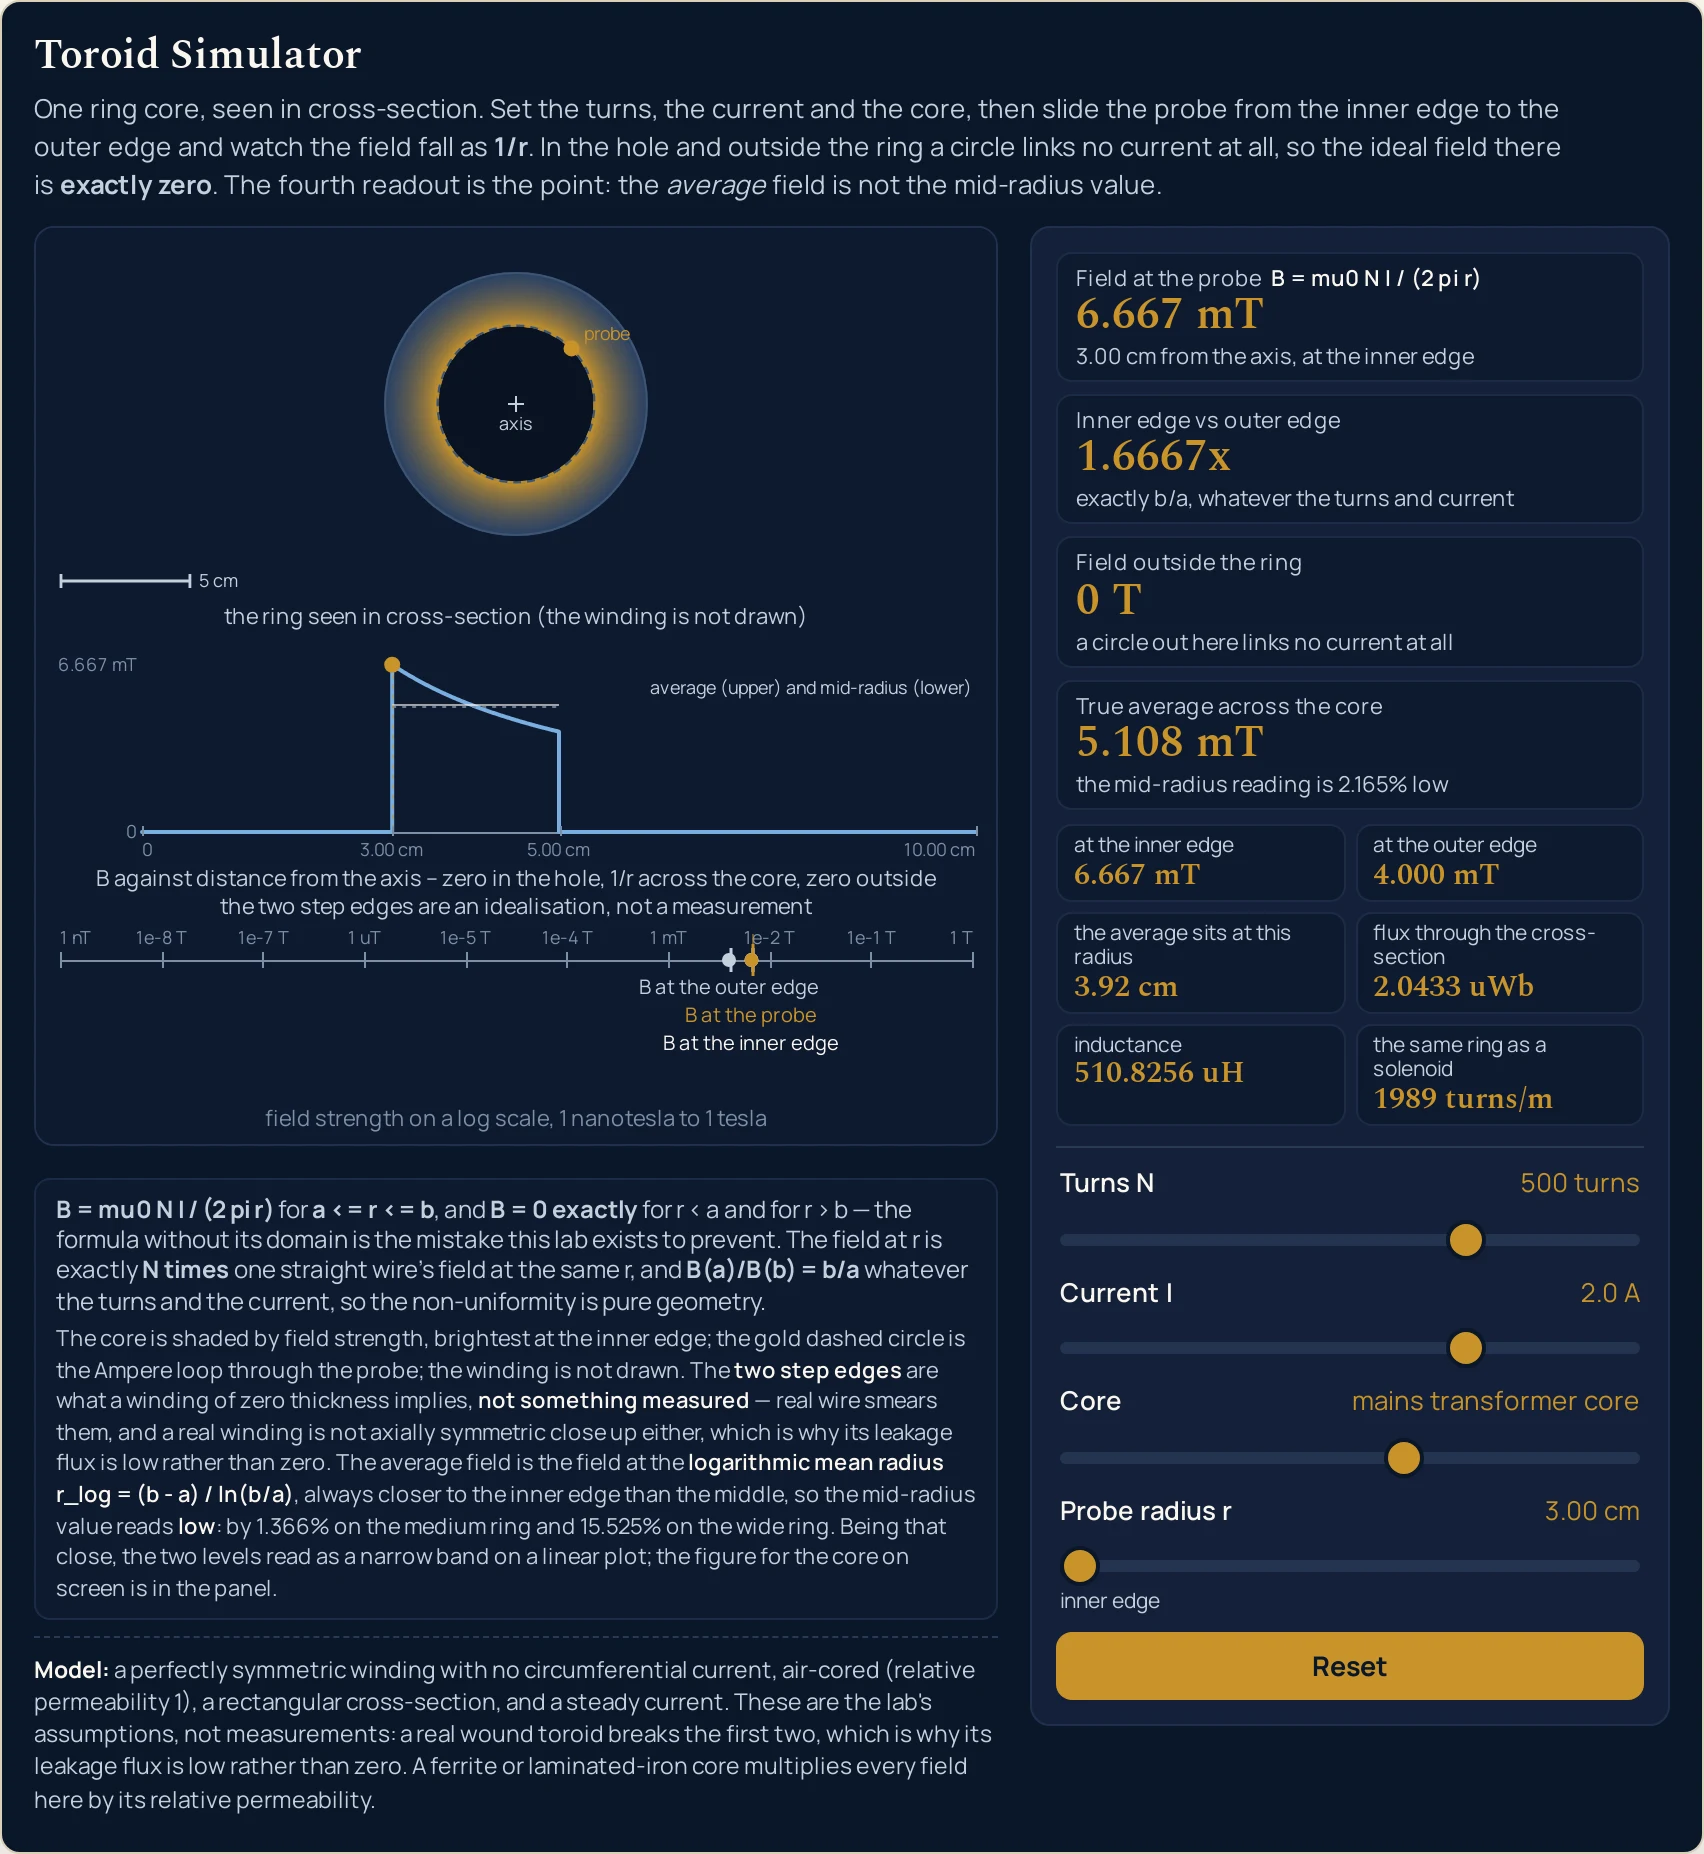
6.667 mT. The dashed Ampere circle has slid onto the inner edge of the core and the log-axis markers for the probe and the inner edge have landed on top of one another. The band text is what the drawing paints at this page’s own width; it shortens on a narrow column, band by band.Worked Example: The Same Core, 6.667 mT and 4.000 mT
Nothing in the tables below was worked out here. Each column is a setting the lab was put into through its own sliders and then read back from, cell by cell, so every string in them is the panel's own. The first table is the pair this section is named after.
One: one core, one winding, two probe positions, and the ratio between them
Press Probe the inner edge, where it is strongest and then The same core at the outer edge. Only the probe slider moves between them, so every row that does not mention the probe is the same string twice. This table is transposed, because the comparison worth making runs down a column.
| Panel reading | Probe the inner edge | The same core at the outer edge |
|---|---|---|
| Turns N | 500 turns | 500 turns |
| Current I | 2.0 A | 2.0 A |
| Core | mains transformer core | mains transformer core |
| Probe radius r | 3.00 cm | 5.00 cm |
| where the probe sits | inner edge | outer edge |
| Field at the probe | 6.667 mT | 4.000 mT |
| where that reading was taken | 3.00 cm from the axis, at the inner edge | 5.00 cm from the axis, at the outer edge |
| Inner edge vs outer edge | 1.6667x | 1.6667x |
| why that ratio is what it is | exactly b/a, whatever the turns and current | exactly b/a, whatever the turns and current |
| Field outside the ring | 0 T | 0 T |
| why it is zero | a circle out here links no current at all | a circle out here links no current at all |
| True average across the core | 5.108 mT | 5.108 mT |
| what the middle costs you | the mid-radius reading is 2.165% low | the mid-radius reading is 2.165% low |
| at the inner edge | 6.667 mT | 6.667 mT |
| at the outer edge | 4.000 mT | 4.000 mT |
| the average sits at this radius | 3.92 cm | 3.92 cm |
| flux through the cross-section | 2.0433 uWb | 2.0433 uWb |
| inductance | 510.8256 uH | 510.8256 uH |
| the same ring as a solenoid | 1989 turns/m | 1989 turns/m |
Divide the two field readings and then stop. 6.667 mT over 4.000 mT is the second card, 1.6667x, which is 5 cm over 3 cm. The ratio needs no arithmetic at all once you know the two radii, and it is the same ratio at any turn count and any current.
Fifteen of the nineteen rows are identical in both columns. The flux, the inductance, the radius the average sits at and the two edge fields all belong to the core and the winding rather than to the probe, so sliding the probe cannot touch them. Only the probe radius, its sub-line, the first card and its sub-line change.
The fourth card is below the first card in one column and above it in the other. It is 5.108 mT in both, because the average across the core does not depend on where you are standing in it. Against the 5.000 mT the panel prints at the mean radius, that is the 2.165% its sentence quotes.
Two: the five cores, and what each one is for
These are the buttons above with the readings they produce. Read the last two columns across: the average column tracks the first-card column closely on the mains core and pulls well away from it on the wide ring.
| Preset | Turns | Current | Core | Probe radius | Field at the probe | True average | Inner vs outer |
|---|---|---|---|---|---|---|---|
| A mains transformer core | 500 turns | 2.0 A | mains transformer core | 4.00 cm | 5.000 mT | 5.108 mT | 1.6667x |
| Probe the inner edge, where it is strongest | 500 turns | 2.0 A | mains transformer core | 3.00 cm | 6.667 mT | 5.108 mT | 1.6667x |
| The same core at the outer edge | 500 turns | 2.0 A | mains transformer core | 5.00 cm | 4.000 mT | 5.108 mT | 1.6667x |
| A wide ring is badly non-uniform | 500 turns | 2.0 A | wide ring | 2.50 cm | 8.000 mT | 9.242 mT | 4.0000x |
| A ferrite bead on a signal lead | 10 turns | 0.05 A | ferrite bead | 0.75 cm | 13.333 uT | 13.863 uT | 2.0000x |
Rows one and four are the cleanest pair in the table. Same turns, same current, and only the core changed: the first card goes from 5.000 mT to 8.000 mT while the ratio card goes from 1.6667x to 4.0000x. A wide ring is stronger at its mean radius and far less uniform across it.
Row five is 375 times weaker than row one and nothing about the relation has changed. Ten turns at 0.05 A on a bead gives 13.333 uT, against 5.000 mT for five hundred turns at 2.0 A on the mains core. Both land on the same bottom axis, which is why that axis is nine decades wide.
Formula and Symbol Reference
The band at the head of this page carries the relation with its domain written beside it, because the formula on its own is the error this lab exists to prevent. Every reading on the panel is that one relation read somewhere else, or a quantity the same integral produces.
The symbol column below uses the panel's own names for its readings, spelled the way the lab's own equation line spells them. What the quantity on the current slider actually is, in terms of charge and time, is the electric current guide; what a magnetic field is at all, and what it does to a moving charge, is the magnetic field guide.
| Symbol or readout | Meaning | SI unit | In this lab |
|---|---|---|---|
| B | The field at the probe: how strong the magnetic field is on the circle the probe sits on, measured round that circle. It is the thing the lab answers and never the thing you set | tesla (T) | the first card, to three decimals with the largest unit that keeps the number at or above one, so a non-zero reading carries mT, uT or nT and never a bare T. The opening state reads 5.000 mT; swept across all 8,064 states the weakest reading is 250.000 nT and the strongest is 800.000 mT, which is why nothing the sliders reach is pushed off either end of the bottom axis. An exact zero prints as the literal 0 T. |
| N | The number of complete turns the winding makes round the core. It is an exact count rather than a measurement, and the field is exactly proportional to it | dimensionless count | a ladder of eight rungs, 10 turns to 2000 turns, opening on 500 turns. The slider steps one index at a time, so no intermediate turn count exists. At 10 turns the first card reads 100.000 uT and at 2000 turns it reads 20.000 mT, with everything else held at the default. |
| I | The steady current in the wire. It enters the relation only as the product with the turns, which is why a thin winding at a large current and a thick one at a small current are the same ring to this lab | ampere (A) | a ladder of eight rungs, 0.01 A to 10.0 A, opening on 2.0 A. At the bottom rung the first card reads 25.000 uT and at the top 25.000 mT — a factor of exactly one thousand, which is the ratio of the two rungs. |
| r | The distance from the ring axis, which is the line through the middle of the hole. It is not measured from the wire and it is not the ring's own radius, and that is the single most likely reader error in this subject | metre (m), shown in centimetres | the probe slider, from the inner edge to the outer edge in twenty steps, printing the radius rather than the fraction. On the default core that is 3.00 cm to 5.00 cm, opening at 4.00 cm; on the ferrite bead it is a span whose middle prints 0.75 cm. Its sub-line reads inner edge, outer edge, mid-way across the core or a percentage across. |
| a and b | The inner and outer radii of the rectangular cross-section. They are chosen together by the core slider and never separately, because the six cores are real shapes rather than arbitrary pairs | metre (m) | a ladder of six cores — ferrite bead, small ferrite ring, medium ring, mains transformer core, large transformer core and wide ring — opening on mains transformer core. The lab shows them through the two grid rows at the inner edge and at the outer edge, which read 6.667 mT and 4.000 mT on the default core and 20.000 mT and 5.000 mT on the wide ring. |
| b/a | The ratio of the two radii, and therefore the ratio of the fields at the two edges. It is the whole of the non-uniformity and it is pure geometry | dimensionless ratio | the second card, to four decimals with an x after it. It takes one value per core — 1.6667x on the mains core, 2.0000x on the bead and 4.0000x on the wide ring — and the turns and current sliders never touch it. |
| B outside | The field anywhere a circle links none of the winding: in the hole, on the axis itself and beyond the outer edge. In the ideal case it is not small, it is nothing | tesla (T) | the third card, and it is the literal string 0 T on every reachable state. The lab own test hook returns an exact zero rather than a rounded one at the axis, at half the inner radius and at twice the outer radius, on all six cores. |
| B average | The area-average field across the cross-section. It is what "the field in the core" ought to mean, and it is not the reading at the middle | tesla (T) | the fourth card, in the same format as the first. It is 5.108 mT on the mains core, 9.242 mT on the wide ring and 13.863 uT on the bead preset. Its sentence gives the shortfall of the mid-radius reading for the core on screen, as the mid-radius reading is 2.165% low. |
| r_log | The radius the average field actually sits at: the logarithmic mean of the two radii. It is strictly inside the inner half of the core, which is why the arithmetic middle always reads low | metre (m), shown in centimetres | the third grid row, to two decimals. It is 3.92 cm on the mains core against a mean radius of 4.00 cm, 2.16 cm on the wide ring against 2.50 cm, and 0.72 cm on the bead against 0.75 cm. |
| flux | The total magnetic flux threading one cross-section of the core. It follows from the same integral the average field comes from, so it carries the same rectangular-cross-section assumption | weber (Wb) | the fourth grid row, to four decimals. It reads 2.0433 uWb on the mains core, 2.7726 uWb on the wide ring and 0.3466 nWb on the bead preset, and it does not move when the probe does. |
| L | The inductance of the winding, as the flux linkage per amp. It is well defined here because the current is steady and the geometry is fixed, and it is the one reading that goes as the square of the turns | henry (H) | the fifth grid row, to four decimals. 510.8256 uH on the mains core, 693.1472 uH on the wide ring and 69.3147 nH on the bead. Hold everything else and move the turns slider from 500 turns to 2000 turns and it goes to 8.1732 mH. |
| n | The turns per metre the same ring works out to if you unroll it: the turns divided by the circumference at the mean radius. It is the one place the straight-coil picture is allowed on this panel | per metre (1/m) | the sixth grid row, rounded to a whole turn. 1989 turns/m on the mains core, 3183 turns/m on the wide ring and 212 turns/m on the bead preset. At 500 turns on the bead it reads 10610 turns/m, and at the 2000-turn corner on that core 42441 turns/m. |
| mu0 | The magnetic constant, fixed for the whole lab and not a control. Since the 2019 revision of the SI it is a measured quantity, so no sentence here calls four pi times ten to the minus seven its exact value | newtons per ampere squared | not on the panel as a reading. It enters only through mu0 / (2 · pi), which is 2.0000000011 × 10⁻⁷ tesla metres per amp. That is why the opening state comes out as a clean 5.000 mT — a coincidence of the chosen numbers rather than a law. |
If you read one row twice, make it the fourth. The probe radius is measured from the ring axis, which is the line through the middle of the hole — not from the wire, and not as the ring's own radius. Nearly every wrong answer in this subject is that one length taken from the wrong place.
Reading the Diagram: Three Bands, Two Step Edges and a Log Axis
The drawing is laid out as three bands and each band caption strip is reserved before anything is placed in it, so no part of the picture is ever painted across another. The top band carries the core, the middle band carries the shape of the result, and the bottom band carries the one axis that is shared.
| Part of the drawing | What it paints | What it does not claim |
|---|---|---|
| the cross-section band | The top band. One ring core seen in cross-section as two concentric circles, the hole left empty, the core shaded by field strength and brightest at its inner edge, a dashed circle for the Ampere loop through the probe, a marker at the probe radius, and a labelled scale bar in centimetres | it does not show the winding, and its caption keeps saying so. A reader who expects to see wire would otherwise take the shaded annulus for the coil. The bar is a round 1, 2 or 5 centimetres, and the view rescales by a factor of sixteen across the core ladder, so no two cores may be compared by eye |
| the profile band | The middle band. The field against distance from the ring axis on a linear horizontal axis running out to twice the outer radius, drawn as a polyline: flat zero, a step up at the inner edge, a one-over-r fall, a step down at the outer edge, flat zero again. Two horizontal levels are marked, the average above the mid-radius value | it does not claim the two step edges were measured. They are what a winding of zero thickness implies, and the caption says that at every width the band is drawn at. The two levels also sit very close together on most cores, so the gap between them is a figure to read off the panel rather than to estimate off the picture |
| the log axis band | The bottom band. One shared logarithmic field axis anchored on its decades from one nanotesla to one tesla, a tick at every decade, and three labelled markers on it: the field at the inner edge, the field at the probe and the field at the outer edge | it does not measure a length. The band above plots a field against a distance and this one plots a field alone, so nothing horizontal in one means anything in the other. Every reachable state lands inside the nine decades, so no marker is ever clamped at either end |
| what the picture is for | Seeing the shape. The step up, the fall and the step down are the whole result in one line, and the two flat stretches either side are the part a reader will not believe until they have seen the third card agree with them | it is not evidence. The drawing is made from the numbers the sliders set, so it shows the shape of the model rather than discovering it. Where a real winding departs from the model is set out below and is not visible in the picture at all |
The winding is not drawn, and that is a decision rather than an omission. The lab treats the coil as a smooth current sheet of zero thickness, so there is no wire diameter to draw and no pitch to draw it at. The top band caption says the winding is not drawn at every width the band survives, because a shaded annulus with no wire on it reads as a coil to anyone who is not told otherwise.
The two step edges in the middle band are the same idealisation showing its hand. A current sheet with no thickness takes the field from nothing to its inner-edge value over no distance at all, so the plot has a corner. Real wire has a diameter and smears both edges, which is why the band's second caption line calls them an idealisation and not a measurement.
The bottom band is nine decades because it has to hold everything the sliders can reach. One nanotesla to one tesla with a tick at every decade covers everything the four controls can reach, so no marker is ever pushed off either end. The three markers on it are the inner edge, the probe and the outer edge, and on a narrow core they crowd together — which is the picture of a nearly uniform ring.
The same field drawn round a straight coil instead of a ring looks quite different at the ends, and the solenoid simulator is where to see that. Which way round the field points is a separate question from how big it is, and this lab answers only the second; the right-hand rule guide is the first.
The Physics: Why It Is Exactly Zero Outside
Take a circle concentric with the ring axis and walk round it. The field is circumferential and the same strength all the way, so the loop integral of the field is just the field times the circumference, and Ampere circuital law sets that equal to the magnetic constant times the current the circle links. Rearranged, the field is the constant times the turns times the current, divided by two pi r.
Now ask what happens when the circle links nothing. Inside the hole the circle passes under every turn and threads none of them; outside the ring it passes outside every turn and threads none of them either. In both cases the enclosed current is zero, so the field is zero — not small, not approximately nothing, but zero, which is why the third card prints the literal 0 T instead of a number.
The best sentence on this panel is the one about a single wire. The field at a radius r is exactly the turns times what one straight wire carrying the same current would give at the same r, because the ring is nothing more than N wires' worth of linked current threading the same circle. The two formulas that get written in textbooks as separate cases are one law.
There is one place the straight-coil picture earns its keep here, and then it stops. Unroll the ring at its mean radius and the winding becomes a coil of N divided by two pi r_mean turns per metre; run the straight-coil relation on that expression and the first card comes back exactly. The sixth grid row prints the same spacing rounded to a whole turn, 1989 turns/m on the default core, so the exactness belongs to the expression rather than to the rounded readout — the toroid calculator carries the unrounded 1989.44 turns/m beside its own answer. That is the equals sign between the two shapes, and the solenoid guide is where the straight coil and its own formula belong.
The sharpest result on the panel is the fourth card, and the probe ladder below is where to see it. Hold the turns, the current and the core still and walk the probe from one edge to the other: twenty-one rungs, read straight off the panel.
| Probe radius | Where the probe sits | Field at the probe |
|---|---|---|
| 3.00 cm | inner edge | 6.667 mT |
| 3.10 cm | 5% across the core | 6.452 mT |
| 3.20 cm | 10% across the core | 6.250 mT |
| 3.30 cm | 15% across the core | 6.061 mT |
| 3.40 cm | 20% across the core | 5.882 mT |
| 3.50 cm | 25% across the core | 5.714 mT |
| 3.60 cm | 30% across the core | 5.556 mT |
| 3.70 cm | 35% across the core | 5.405 mT |
| 3.80 cm | 40% across the core | 5.263 mT |
| 3.90 cm | 45% across the core | 5.128 mT |
| 4.00 cm | mid-way across the core | 5.000 mT |
| 4.10 cm | 55% across the core | 4.878 mT |
| 4.20 cm | 60% across the core | 4.762 mT |
| 4.30 cm | 65% across the core | 4.651 mT |
| 4.40 cm | 70% across the core | 4.545 mT |
| 4.50 cm | 75% across the core | 4.444 mT |
| 4.60 cm | 80% across the core | 4.348 mT |
| 4.70 cm | 85% across the core | 4.255 mT |
| 4.80 cm | 90% across the core | 4.167 mT |
| 4.90 cm | 95% across the core | 4.082 mT |
| 5.00 cm | outer edge | 4.000 mT |
Multiply any row radius by its field and you get the same product every time. That is what a one-over-r fall is, and it is the reason the column drops by a third over two centimetres rather than falling off a cliff. The two end rows are the two grid rows above, to the last digit.
The average of that column is not the middle of it. Integrating across the rectangular cross-section puts the area-average field at the logarithmic mean radius, which the third grid row prints as 3.92 cm — inside the inner half of a core running from 3.00 to 5.00 cm. The fourth card therefore reads 5.108 mT where the mid-radius rung reads 5.000 mT.
How much the middle costs you depends on the ratio of the radii and on nothing else. One sentence under the fourth card serves every turn count and every current on a given core, which is why it reads the mid-radius reading is 2.165% low on the mains core and the mid-radius reading is 15.525% low on the wide ring. A narrow annulus is nearly uniform; a wide one is not, and that is why real cores are built fat rather than wide.
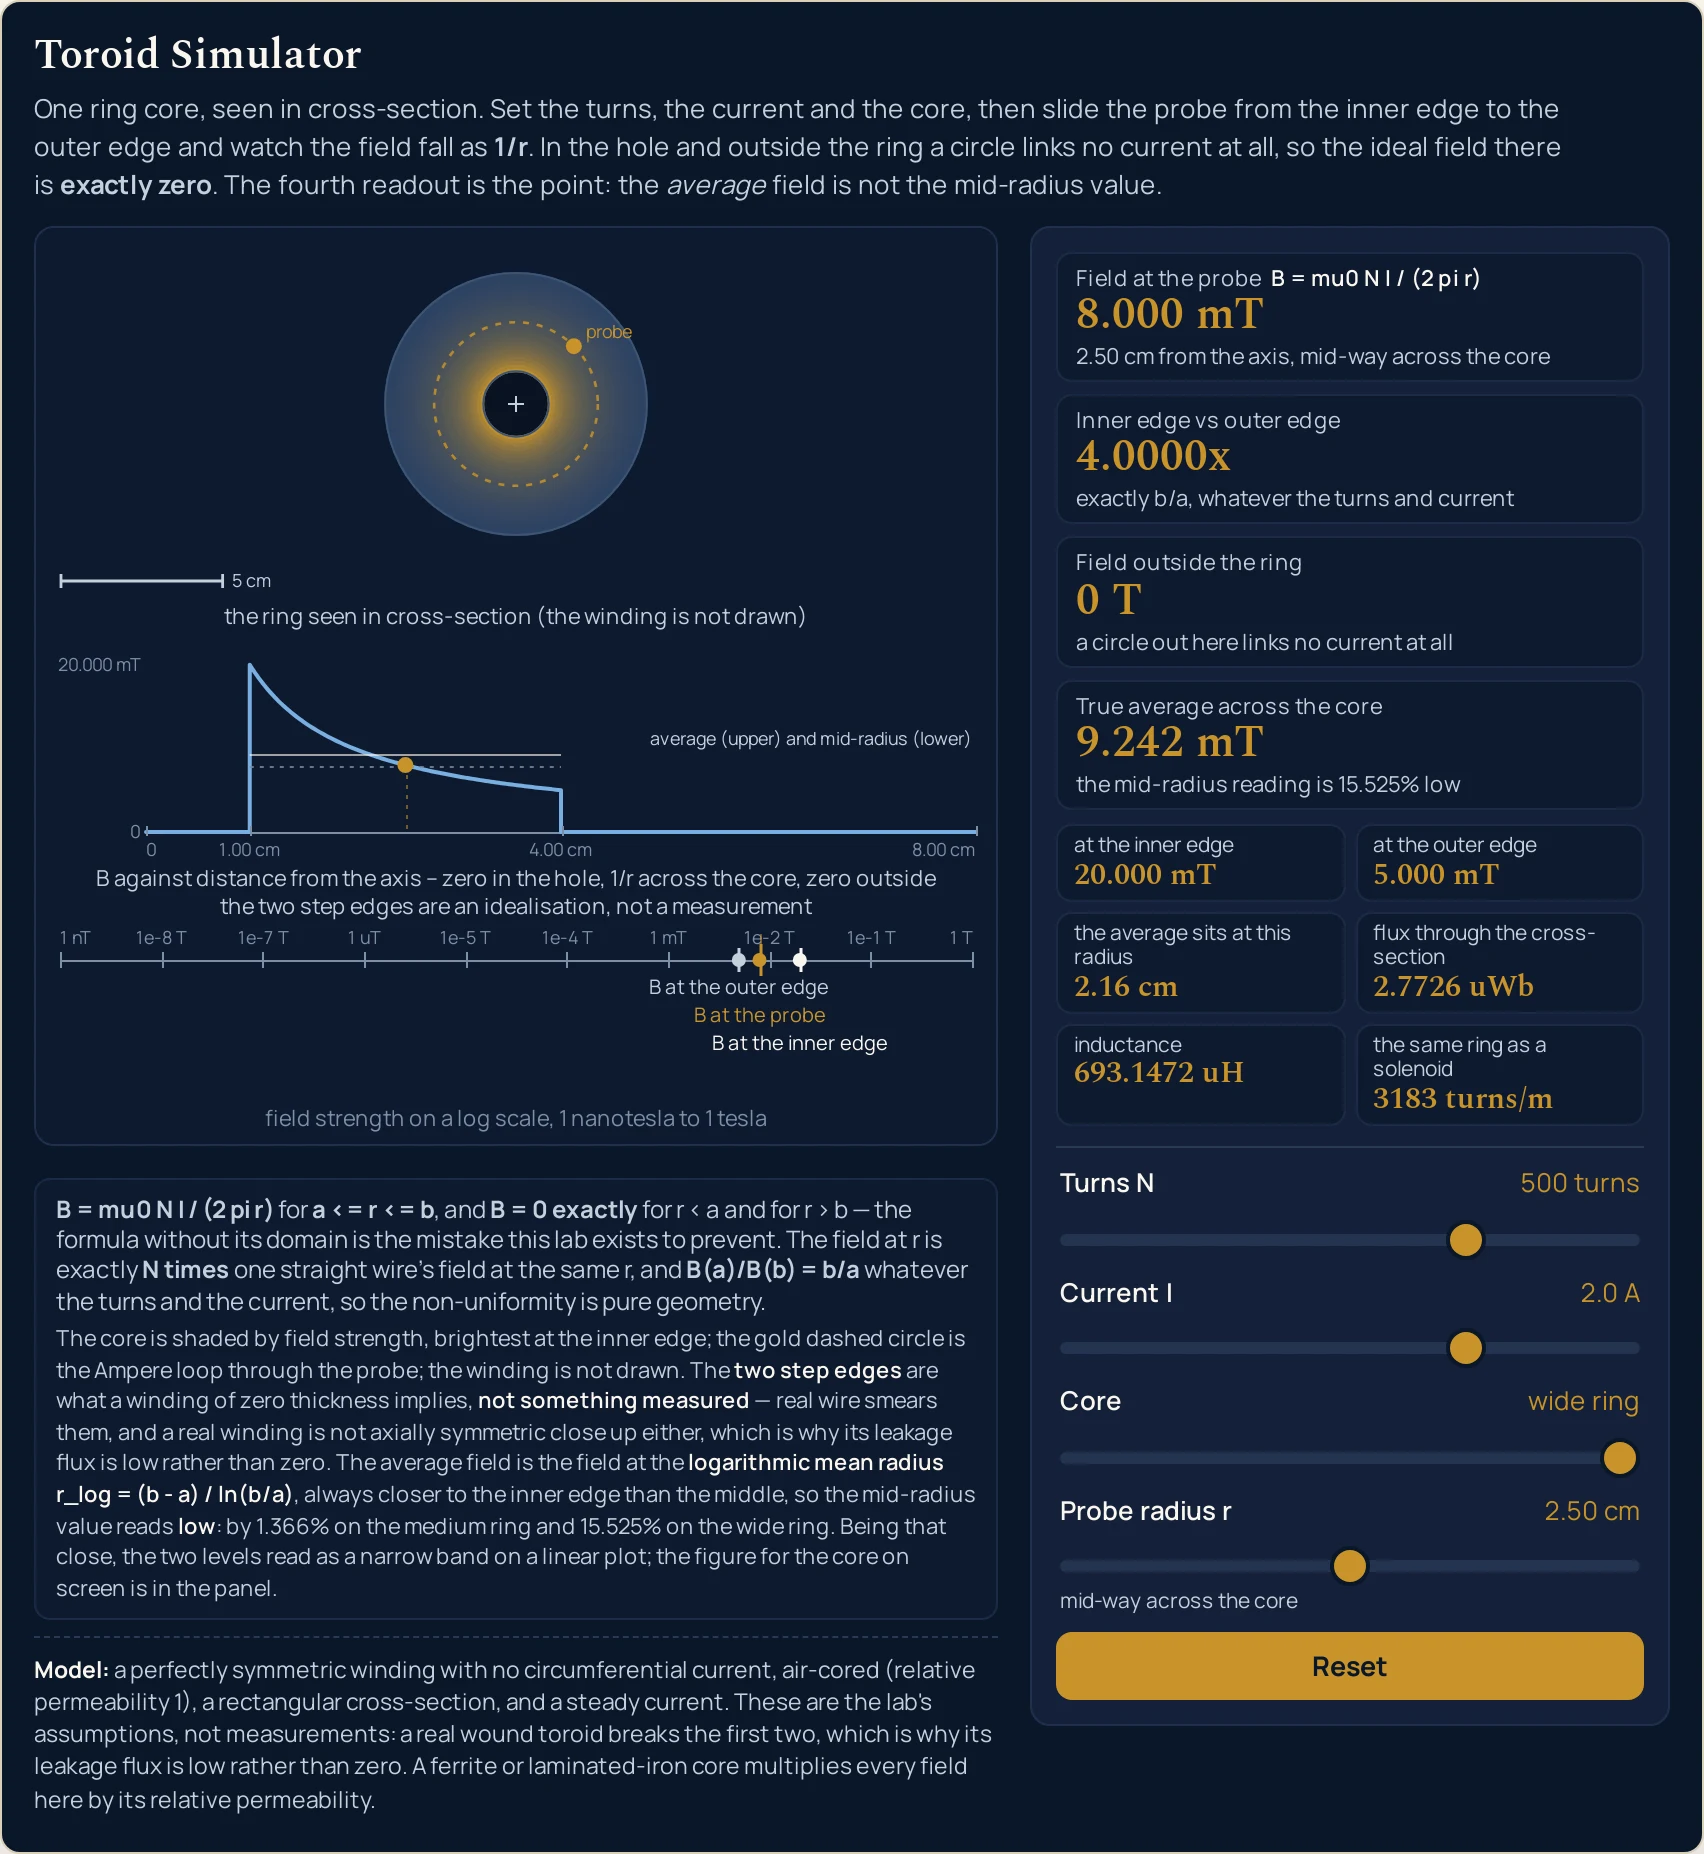
2.0 A give 20.000 mT at the inner edge and 5.000 mT at the outer, so the ratio card reads 4.0000x and the average pulls clear of the mid-radius value — the mid-radius reading is 15.525% low. Compare the gap between the two horizontal levels here with the same gap in the first figure, where it is 2.165%.Where It Breaks Down
Every state the four sliders can reach is answered, and the arithmetic is not where this lab can let you down. What it cannot do is model a real wound core, and what it chooses not to do is treat its own idealisations as facts. The first item below is the one a reader is most likely to get wrong, and it is the source's own correction rather than ours.
- A real winding breaks both of the conditions the zero rests on, so the leakage is low rather than zero
- The source cleared for this cluster puts it in two sentences of its own. Looking out from the axis the wire is sometimes on the inside of the core and sometimes on the outside, so a real winding is not axially symmetric close in; and however thin the wire, the winding still includes one loop of current in the plane of the ring. Both of the conditions the exact zero depends on are therefore broken by any real coil, so the source's claim is that the leakage flux can be made low, with a return wire, a return winding or a split return winding. The word exactly on this page always belongs to the ideal case.
- There is no single number for the field in the core, and the panel refuses to pretend there is
- The first card is the field at one radius and nowhere else, which is why its sub-line always names the radius it belongs to. Across the mains core the reading runs from
6.667 mTto4.000 mT, and on the wide ring from20.000 mTto5.000 mT— a factor of four across one piece of ferrite. Quoting a toroid field without the radius it was taken at is the same mistake as quoting the formula without its domain. - Everything here is air-cored, with a relative permeability of one
- A ferrite or laminated-iron core multiplies every field on this page by its own relative permeability, and no figure for that multiplier is published or assumed anywhere in this lab. That is one sentence rather than a section: cores and the coils wound on them have a page of their own in the electromagnet guide. The six cores on the slider differ in size and shape only.
- The current is steady, so nothing here evolves in time
- This is magnetostatics and there is deliberately no play button: nothing on the panel changes unless you move a slider. The inductance row is still well defined, because it is the flux linkage per amp of a fixed geometry. What happens once the current stops being steady belongs to the electromagnetic induction guide, and the losses a changing field drives in the core itself belong to the eddy currents guide.
- The flux and the inductance rows carry the cross-section with them
- Both come from integrating the field across a rectangle whose inner radius, outer radius and height the core slider sets, so they are properties of that shape and not of the turns alone. Change the core and they change even at the same turns and current:
2.0433 uWband510.8256 uHon the mains core become2.7726 uWband693.1472 uHon the wide ring. A real core with rounded corners or a non-rectangular section would not give these numbers. - Four pi times ten to the minus seven is not the exact value of the magnetic constant any more
- Since the 2019 revision of the SI the magnetic constant is measured rather than defined, and the older expression is no longer exactly equal to it. The two agree to nine significant figures and nothing on this page is printed to anything like that precision, so the choice never shows in a reading — but no sentence here calls the older expression exact. The lab uses the measured value throughout.
- The sliders are ladders, and three of the four questions run only one way
- The turns slider has eight rungs, the current slider eight and the core slider six, so with the probe the lab reaches 8,064 states and nothing in between. It also runs forwards only: you set the turns, the current and the radius and read the field. The toroid calculator takes typed figures and runs the relation in all four directions, including the radius at which a given winding produces a field you have measured.
- On a narrow phone the bottom axis stops labelling all of its decades
- At eight viewport widths between 250 and 320 pixels the nine-decade axis carries only one of its ten decade labels, because the label budget is measured against a shorter string than the longest one it has to fit. All ten ticks are still drawn and the caption still gives the range in words, so nothing drawn is untrue and the ladder stops rather than skipping. On a narrow screen take the figures from the cards, which are unaffected, rather than off that axis.
Where Toroids Are Actually Used
- Mains transformers
- Load A mains transformer core and you have the shape: a ring with a 3 cm hole and a 5 cm outer edge, 500 turns, 2.0 A. The panel gives
5.000 mTat the mean radius, a flux of2.0433 uWbthrough one cross-section and an inductance of510.8256 uH. The reason the geometry is chosen at all is the third card: a ring keeps its field inside itself in a way a straight coil cannot. - Power supplies, inverters and amplifiers
- The source cleared for this cluster lists power supplies, inverters and amplifiers as the places toroidal inductors and transformers turn up. Walking the current slider is the quickest way to see why a power part is specified by its ampere-turns rather than by either number alone:
0.01 Agives25.000 uTand10.0 Agives25.000 mTat the same five hundred turns. - Ferrite beads on signal leads
- Load A ferrite bead on a signal lead and every reading on the panel collapses:
13.333 uTat the probe,0.3466 nWbof flux and69.3147 nHof inductance from ten turns at0.05 Aon a ring with a 0.5 cm hole and a 1 cm outer edge. The second card reads2.0000x, so a bead is twice as strong at its inner edge as at its outer one — worse than the mains core's1.6667x, because its outer radius is twice its inner one rather than five thirds of it. - Choosing a core that is fat rather than wide
- The second card is a specification in one number. Press A wide ring is badly non-uniform and the fourth card sentence becomes
the mid-radius reading is 15.525% low, against2.165%on the mains core. If a design needs the field across the core to be nearly the same everywhere, the ratio of the two radii is the thing to shrink, and making the core taller rather than wider is how that is done. - Keeping the field out of the neighbours
- The third card is why a ring is wound in the first place. In the ideal case there is no field outside it at all, so nothing nearby is driven by it and nothing nearby drives it — and the honest version of that, which the first breakdown item above sets out, is that a real winding gets the leakage low rather than to nothing. What the flux through a flat loop in that leakage field would be is a separate calculation, and the magnetic flux calculator is where it lives.
- Reading a core at the right radius in the first place
- The commonest practical use of this panel is as a check on a number somebody else quoted. Set the turns and the current, slide the probe to the radius the figure was supposedly taken at, and see whether the first card agrees. If the quoted figure has no radius attached to it, the probe ladder in the section above shows how much room there is for it to be wrong: a third of the value across two centimetres on an ordinary mains core.
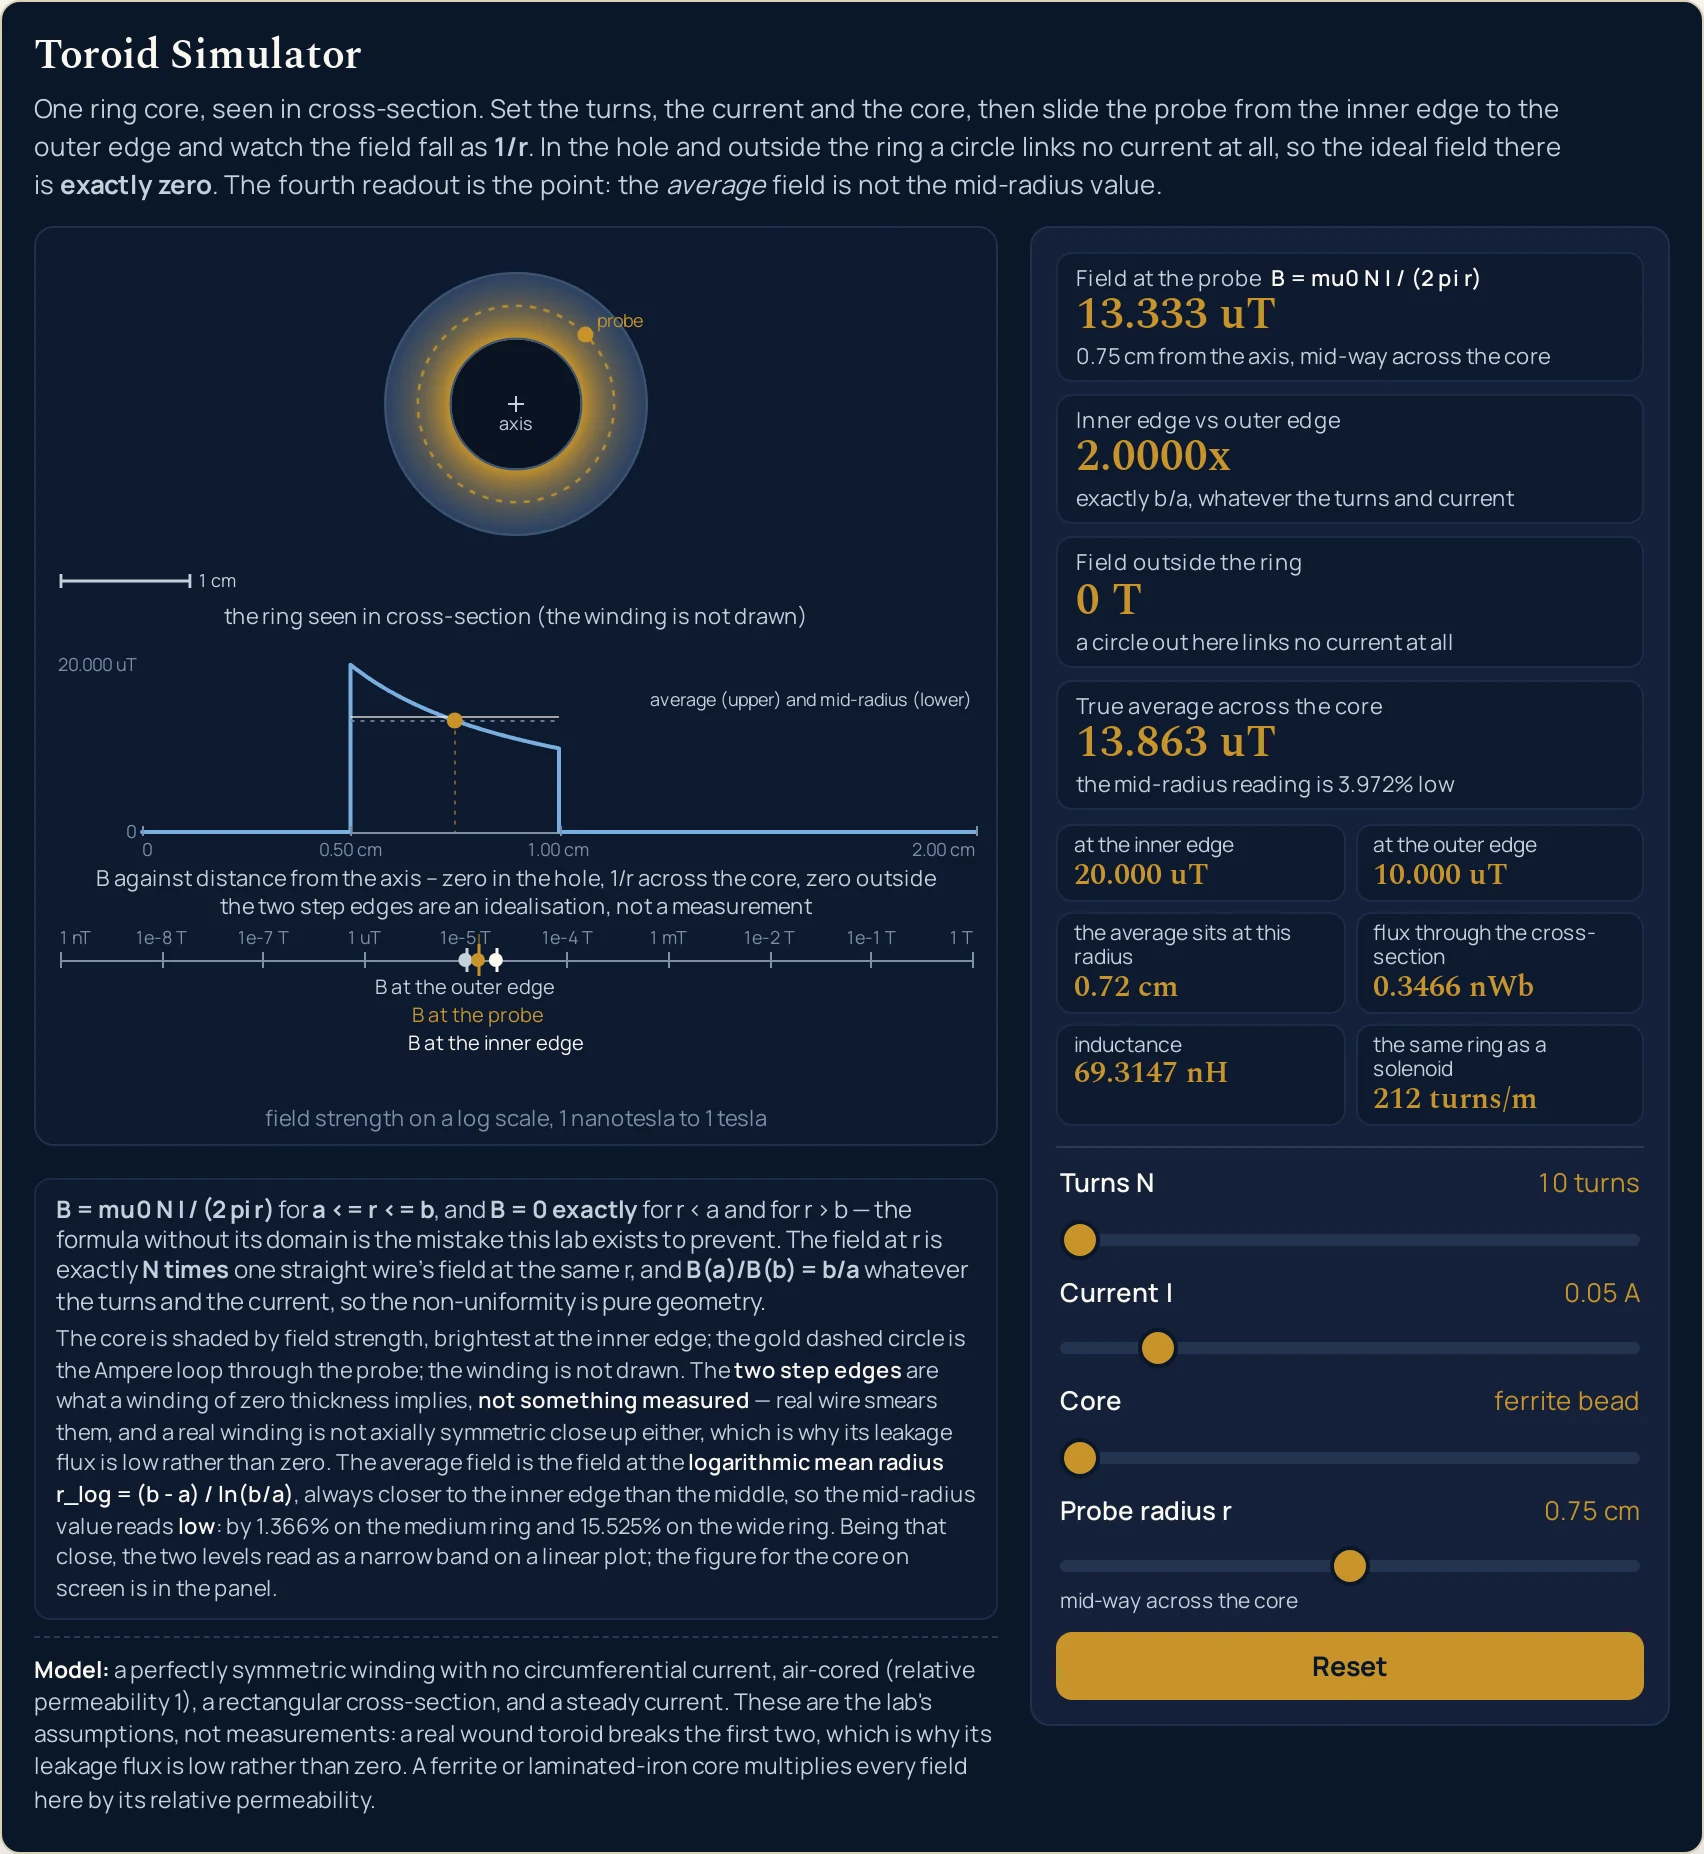
0.05 A on a bead give 13.333 uT, and the three markers have walked a little over two and a half decades to the left of where the first figure put them while the scale bar in the top band has changed from 5 cm to 1 cm. The fourth card still reads above the first, at 13.863 uT, because the bead’s outer radius is twice its inner one.Where to Go Next
A panel can put you in a state and let you move one thing at a time, and that is the end of what a panel is for. The toroid guide is where the subject itself is written out: why the field outside is exactly zero, what the one-over-r fall costs, and why the average sits at the logarithmic mean, with problems worked step by step.
Two posts sit either side of this one. The solenoid guide owns the straight coil and its turns-per-metre formula, and the magnetic field guide owns the field itself and the force it puts on a moving charge.
Five more pick up what this lab uses but does not explain. The electric current guide is the quantity on the current slider, the electromagnet guide is what a core made of something other than air does, the magnetic flux guide is the integral behind the fourth grid row, the right-hand rule guide is which way the field points, and the eddy currents guide is what a changing field does inside the core. The electromagnetic induction guide, Faraday's law and Lenz's law are where a ring like this one stops being static.
On the tool side, the toroid calculator takes typed turns, currents, radii and fields and runs the relation in all four directions, the magnetic field calculator does the straight-coil version, the magnetic flux calculator gives the flux through a flat loop, the electric current calculator gives the current in the winding, and the Faraday law calculator picks up when it changes. The solenoid simulator, the electromagnet simulator and the magnetic field simulator are the three neighbouring pictures. Beyond them there is the simulation library, an index of calculators, and the blog for everything written out at length.
Frequently asked questions
Why does the field outside the ring read exactly 0 T rather than a very small number?
Because the lab returns a literal zero from its own branch rather than dividing by anything. A circle drawn outside the ring, or inside the hole, threads none of the winding, so the enclosed current is nothing and the ideal field is nothing. The third card prints 0 T on every state the four sliders can reach, and its sentence says why.
Why does the Inner edge vs outer edge card refuse to move when I drag the turns or the current?
Because that ratio is set by the two radii alone and neither slider is in it. The card reads 1.6667x on the mains transformer core at every one of the sixty-four turns-and-current combinations the two ladders offer, and its sentence states the reason outright: exactly b/a, whatever the turns and current. Change the core and it becomes 2.0000x or 4.0000x.
Why is the true average across the core larger than the reading at the middle of it?
Because the average sits at the logarithmic mean radius, which is always closer to the inner edge than the arithmetic middle. On the mains transformer core the fourth card reads 5.108 mT against 5.000 mT at the mean radius, and its sentence puts the gap at 2.165% low. The grid row below gives that radius as 3.92 cm.
Why do the turns, current and core sliders step through fixed rungs instead of moving smoothly?
Because a ladder makes every reading on this page reproducible rather than approximate. The turns slider has eight rungs from 10 turns to 2000 turns, the current slider eight from 0.01 A to 10.0 A, and the core slider six cores, so the lab reaches 8,064 states with the probe and nothing between them. The companion calculator takes typed figures.
Why is no winding drawn round the ring in the top band?
Because the lab models the winding as a smooth current sheet with no thickness, and drawing wire would suggest a geometry it does not use. The band own caption says the winding is not drawn, and that clause stays on screen at every width the drawing survives. What the shading in that band shows is field strength, brightest at the inner edge.
Why does the middle band jump straight up at the inner edge instead of rising gradually?
Because a winding of zero thickness implies a step, and the band says so rather than smoothing it. Its caption carries the clause that the two step edges are an idealisation and not a measurement, on every width at which the band is drawn. Real wire has a diameter and smears both edges out, so the corner is the model and not a reading.
What is the Probe radius r slider measured from?
From the ring's own axis, which is the line through the middle of the hole, and never from the wire. The slider runs from the inner edge to the outer edge in twenty steps and prints the radius in centimetres rather than the fraction: 3.00 cm at one end, 4.00 cm in the middle and 5.00 cm at the other on the default core.
Why is the bottom axis nine decades wide when one core covers so little of it?
Because the same four sliders span six decades of field, and one shared axis is the only honest way to show that. The ferrite bead preset reads 13.333 uT, and the same bead at 2000 turns and 10.0 A reads 533.333 mT. Both have to sit on one scale before they can be compared, and every one of the ten decade ticks is drawn.
What does the Reset button put back?
All four sliders, to 500 turns, 2.0 A, the mains transformer core and a probe radius of 4.00 cm. It replays the opening settle rather than cutting to it, so the scene is drawn in, and the panel lands on 5.000 mT with the ratio back at 1.6667x. Nothing is left animating once it has finished.
References & formula source
- Every figure on this page is the relation for the field inside a ring-shaped winding, read somewhere different. Ampere circuital law is applied to a circle concentric with the ring axis; symmetry makes the field circumferential and constant on that circle, so the loop integral is the field times two pi r, the linked current is the turns times the current, and the field is the magnetic constant times that product divided by two pi r for any radius between the inner and outer edges. A circle in the hole or outside the outer edge links no current at all, so the ideal field there is exactly zero. The relation is applied here rather than derived.
- Six things are this lab stated assumptions and not measurements of any part: the winding is a perfectly symmetric current sheet, it carries no current round the plane of the ring, the core is air with a relative permeability of one, the cross-section is a rectangle with the inner radius, outer radius and height the core slider sets, the current is steady, and the turns are an exact count of complete loops. The panel prints that list in a fixed line under the drawing and labels it as the model rather than as a finding.
- The word exactly belongs to the ideal case only, and the source cleared for this cluster says so in its own words. A real winding is not axially symmetric close in, because looking out from the axis the wire is sometimes on the inside of the core and sometimes on the outside; and however thin the wire and however many times it goes round, the winding still includes one loop of current in the plane of the ring. Both of the conditions the zero rests on are therefore broken by any real coil, and the honest claim is that the leakage flux can be made low rather than that it is nothing. The practical consequence is less interference, not none.
- The one-over-r fall is the price of confining the field, and the panel gives it as a number rather than an impression. The ratio of the fields at the two edges is exactly the ratio of the two radii, for every turn count and every current, so the non-uniformity is pure geometry. The area-average field is the field at the logarithmic mean radius, which is strictly closer to the inner edge than the arithmetic middle, so the mid-radius reading always understates the average. How badly depends on the ratio of the radii and on nothing else, which is why one sentence under the fourth card serves every turn-and-current combination on a given core.
- Nothing in this lab is measured. The turns, the current, the core and the probe radius are given, every reading follows from the relation, and the drawing is those numbers plotted rather than evidence for them. What the four controls are genuinely for is the opposite job: holding three still, moving the fourth, and watching which readings move with it and which do not. The second card is the clearest case, because it is the one that stays put while two of the sliders are swept end to end.
- The drawing promises three things and refuses a fourth. The cross-section band draws the core with a labelled scale bar in centimetres and states that the winding is not drawn. The profile band draws the field against a distance and states that its two step edges are an idealisation rather than a measurement. The bottom band draws one shared logarithmic field axis anchored on its decades. No horizontal distance in the profile band means anything in the band below it, the three are captioned separately, and no sentence on this page invites comparing them.
- Every figure quoted on this page is a string the simulation printed. The cluster simulation report is where those strings are recorded, and it is not a sample: it harvests all five presets with all nineteen of their readouts, both ends of all four sliders, the four corners of the grid, every one of the twenty-one probe rungs on the default core, all three hundred and eighty-four core-turns-current states at the mean radius, the exact zeros on all six cores, and the Reset button before and after, from a real browser against a digest-pinned file. The independent reference script, written separately from the simulation, runs 244,739 checks against the same relations with none failing.
- One stage-one figure in the specification for this cluster was wrong and was corrected by that harvest before this page was written. The average field for the ferrite bead preset reads 13.863 uT, which is the 13.333 uT at the mean radius raised by the 3.972 per cent that core geometry demands; the earlier figure contradicted the same specification own table of what the one-over-r fall costs. Forty-six cells were compared byte for byte against what the simulation printed and that was the only one that moved. The corrected string is the one every table, caption and alt on this page carries.
- Two browser engines were compared reading by reading rather than assumed to agree: the same slider positions were driven in Chrome and in Firefox and 129 readout values were compared, every one identical, with the desktop height agreeing to the pixel. There is a hole in that and it is Safari. The WebKit build on the machine this was tested on will not start, so Safari was never exercised and nothing on this page is evidence about it. Touch and pointer dragging were likewise not exercised: both test harnesses drive the sliders by dispatching events rather than by moving a finger.
- Two limits of the drawing are recorded rather than hidden. At eight viewport widths between 250 and 320 pixels the bottom band nine-decade axis carries only one of its ten decade labels, because the label budget is measured against a shorter string than the longest one; all ten ticks are still drawn and the caption still states the range in words, so nothing drawn is untrue, but a reader on a narrow phone should take the figures from the cards rather than from that axis. Separately, the document overflows horizontally by between one and seven pixels at widths below 170 pixels, which is below the narrowest real phone viewport and below every width this site tests at.
- Further reading: Toroidal inductors and transformers — Wikipedia