The infrared radiation simulator is a free interactive lab built around one awkward fact: infrared is a single band name stretched over a factor of 1428.57 in wavelength, and there is no agreed way to divide it up. Slide one wavelength along a logarithmic axis from 0.70 to 1000 µm and the same photon is named twice, on ISO 20473 above and on the commonly used detector scheme below. Nine readouts answer, headed by the Wavelength, Photon energy and Wavenumber cards and by the two band chips, which print their own edges — Mid infrared (MIR), 3 to 50 um against LWIR, 8 to 15 um — and decide nothing.
Infrared Radiation
Infrared is one band name stretched over a factor of 1,429 in wavelength, and there is no agreed way to divide it up. Slide one wavelength from 0.70 to 1000 um and read the same photon twice: the ISO 20473 scheme on the upper strip, the commonly used detector scheme on the lower one. At 1.55 um the first calls it near infrared and the second calls it short-wave. The arithmetic never changes at a band edge — only the label does.
Load a real infrared wavelength onto the log axis
Each button presses one of the lab’s own five preset buttons and then writes the temperature slider. Those two together are the entire state, so a load never inherits anything from the one before it. Work down the list in order: the first is the state the page opens in, the next two walk the schemes from one shared name into two different ones, and the last two leave a photon alone while the body radiating changes.
Pick a wavelength above, or drag the two sliders yourself.
What Is the Infrared Radiation Simulator?
The infrared radiation simulator is a free interactive physics lab that runs in your browser, with nothing to install and no sign-up. It slides one wavelength across the whole infrared band, 0.70 to 1000 µm, and names that single wavelength twice over: once on ISO 20473 and once on the commonly used detector scheme. Those two published schemes cut the band differently and share only the 3 µm edge and the 1000 µm long edge of infrared itself, so most of the band has two correct names at once, and watching them part company is what the lab is for.
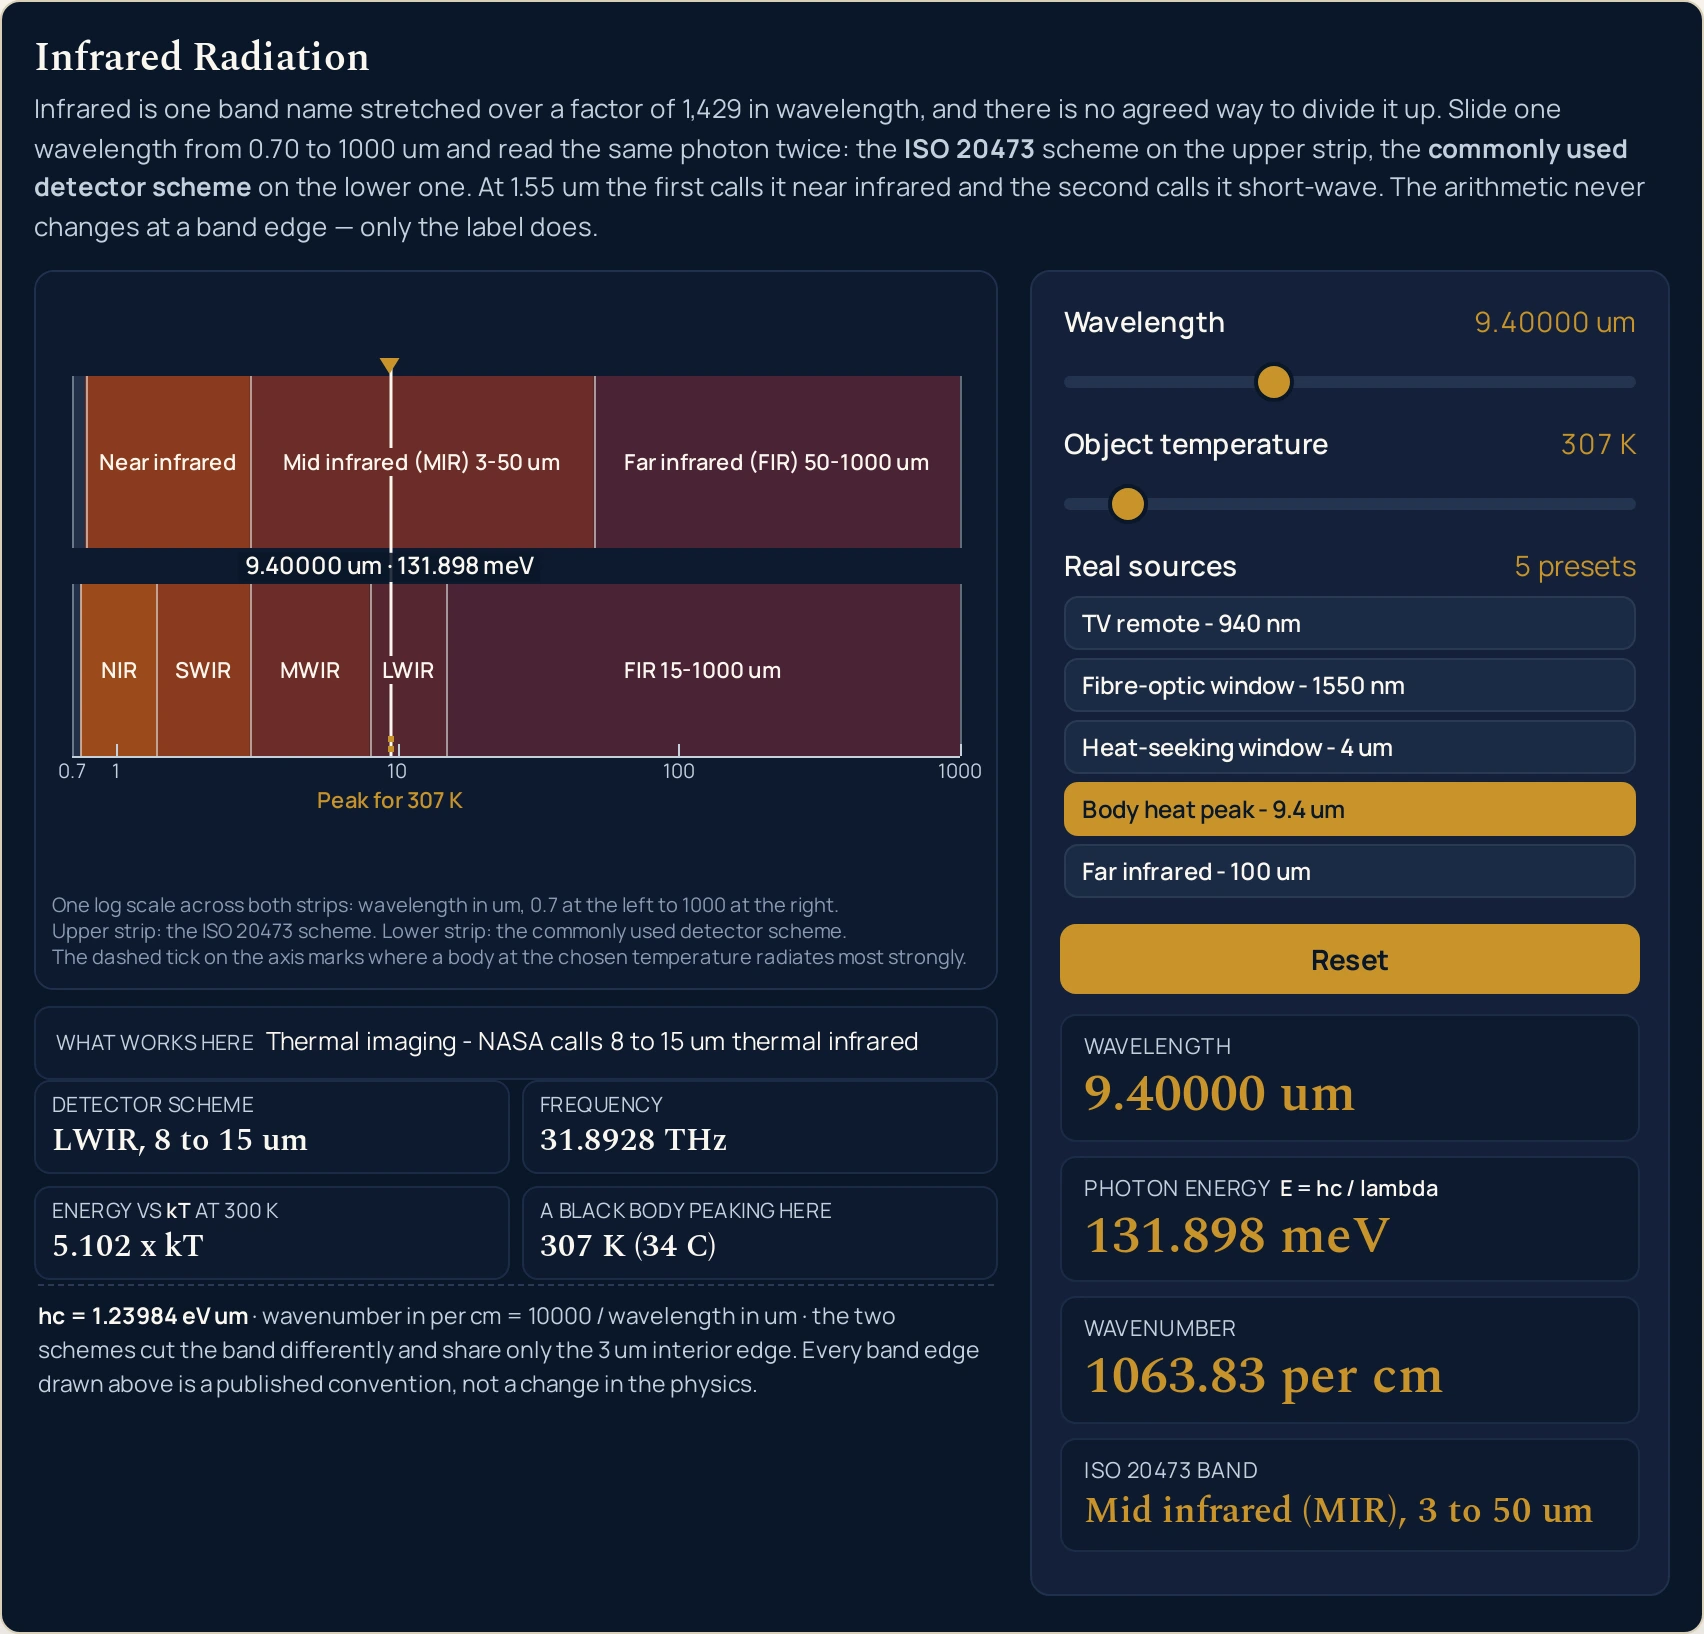
One logarithmic scale carries the whole drawing: wavelength in micrometres, 0.7 at the left edge and 1000 at the right, with nothing placed anywhere that scale did not put it. Two filled strips are stacked against it, ISO 20473 above and the detector scheme below, each band labelled inside itself with its own edges where there is room. A marker crosses both strips at the chosen wavelength carrying a label such as 9.40000 um · 131.898 meV, and a short dashed tick on the axis marks where a body at the chosen temperature radiates most strongly.
The controls are few. A 1001-position slider sets the wavelength on that log scale, a second slider sets an object temperature from 200 to 1500 K in steps of 1 K, five buttons pin real sources from a television remote at 0.94 µm to the far infrared at 100 µm, and Reset returns 9.4 µm at 307 K. Nine readouts answer. Four cards give the Wavelength, the Photon energy, the Wavenumber in per cm and the ISO 20473 band; a compact grid adds the Detector scheme band, the Frequency, the photon energy against kT at 300 K and the temperature chip; and a sentence strip under the drawing makes the ninth.
Two things on the panel are quoted rather than computed, and the lab says so. Every band edge it draws is a convention agreed by committee, not a change in the physics: at 2.99 µm the chips read Near infrared (NIR), 0.78 to 3 um and SWIR, 1.4 to 3 um, at 3 µm they read Mid infrared (MIR), 3 to 50 um and MWIR, 3 to 8 um, and the printed energy has moved by about one part in three hundred. The What works here strip under the drawing is one of five fixed sentences chosen by the band, each a named convention from a published table rather than a measurement the lab has made.
There is deliberately no verdict chip: both schemes print their own edges and the lab adjudicates between neither. The one temperature chip is Wien's displacement law, which has its own calculator on this site, and nothing here computes how much a body radiates.
| Control | What it sets | Range or default |
|---|---|---|
| Wavelength | 0.70 to 1000 um, log | 1001 positions |
| Object temperature | 200 to 1500 K | steps of 1 K |
| Preset buttons | five, 0.94 to 100 um | one press each |
| Reset | 9.4 um at 307 K | one button |
How to use the infrared radiation simulator
- Read the panel before you touch it. The lab boots at rest on the body-heat photon, so every reading is already on screen: Wavelength 9.40000 um, Photon energy 131.898 meV, Wavenumber 1063.83 per cm and ISO 20473 band Mid infrared (MIR), 3 to 50 um. Nothing is animating and nothing needs a click to appear.
- Find that state in the drawing. The marker crosses both strips a little over a third of the way across, carrying the label 9.40000 um · 131.898 meV — the panel’s own two strings, so the picture can never disagree with the cards. Above the marker the upper strip is in its mid-infrared block; below it, the lower strip has already moved into LWIR.
- Read the two band chips as a pair, not a verdict. ISO 20473 band says Mid infrared (MIR), 3 to 50 um and Detector scheme says LWIR, 8 to 15 um. Each prints its own name and its own edges, which is the only way to see that one band runs over forty-seven micrometres and the other over seven.
- Drag the wavelength slider left and count what moves. The control is a position from 0 to 1000 on a logarithmic scale, not a wavelength, so every step multiplies the wavelength by the same ratio, 1.0072909. Five readouts move on every step — the wavelength, the photon energy, the wavenumber, the frequency and the energy ratio — while the two chips and the sentence strip sit still for long stretches and then change outright.
- Stop on position 200 and take one more step. At 200 the cards read 2.99281 um and 414.274 meV, with the chips on Near infrared (NIR), 0.78 to 3 um and SWIR, 1.4 to 3 um. At 201 they read 3.01463 um and 411.276 meV, and both chips have turned over to Mid infrared (MIR), 3 to 50 um and MWIR, 3 to 8 um.
- Press a preset when you want a round figure. No stop of the slider lands on 3, 8, 15 or 50 µm, and only two land on a round number at all: 0 gives 700.000 nm and 1000 gives 1000.00 um. The five preset buttons therefore pin a wavelength rather than writing a position — which is why Body heat peak - 9.4 um reads 9.40000 um where dragging to the same thumb position reads 9.43090 um.
- Now move the second slider and watch eight readouts refuse. Object temperature runs 200 to 1500 K in steps of 1, and it changes exactly two things: the A black body peaking here chip and the short dashed tick on the axis. That chip is Wien’s displacement law in one readout, and the Wien’s law calculator is where the peak itself is worked out as a number.
- Read the sentence strip under the drawing. What works here prints one of five fixed sentences chosen by the band; on the boot state it reads Thermal imaging - NASA calls 8 to 15 um thermal infrared. It measures nothing, which is exactly why it can be quoted.
- Read the last cell of the grid as a number. Energy vs kT at 300 K prints 5.102 x kT on the default and 0.4796 x kT at 100 µm. It never substitutes the words “less than kT” for the figure, because the figure is the useful part.
- Press Reset when you have lost track. It pins 9.4 µm again, returns the temperature to 307 K and replays the settle from the left-hand edge of the axis, so the marker and the tick slide back into place rather than jumping. Exactly one preset button carries the pressed state at a time, and after a reset it is the body-heat one.
- Read the fixed line last of all. It says hc = 1.23984 eV um · wavenumber in per cm = 10000 / wavelength in um · the two schemes cut the band differently and share only the 3 um interior edge. Every band edge drawn above is a published convention, not a change in the physics. That is the whole of what the panel assumes, in one line.
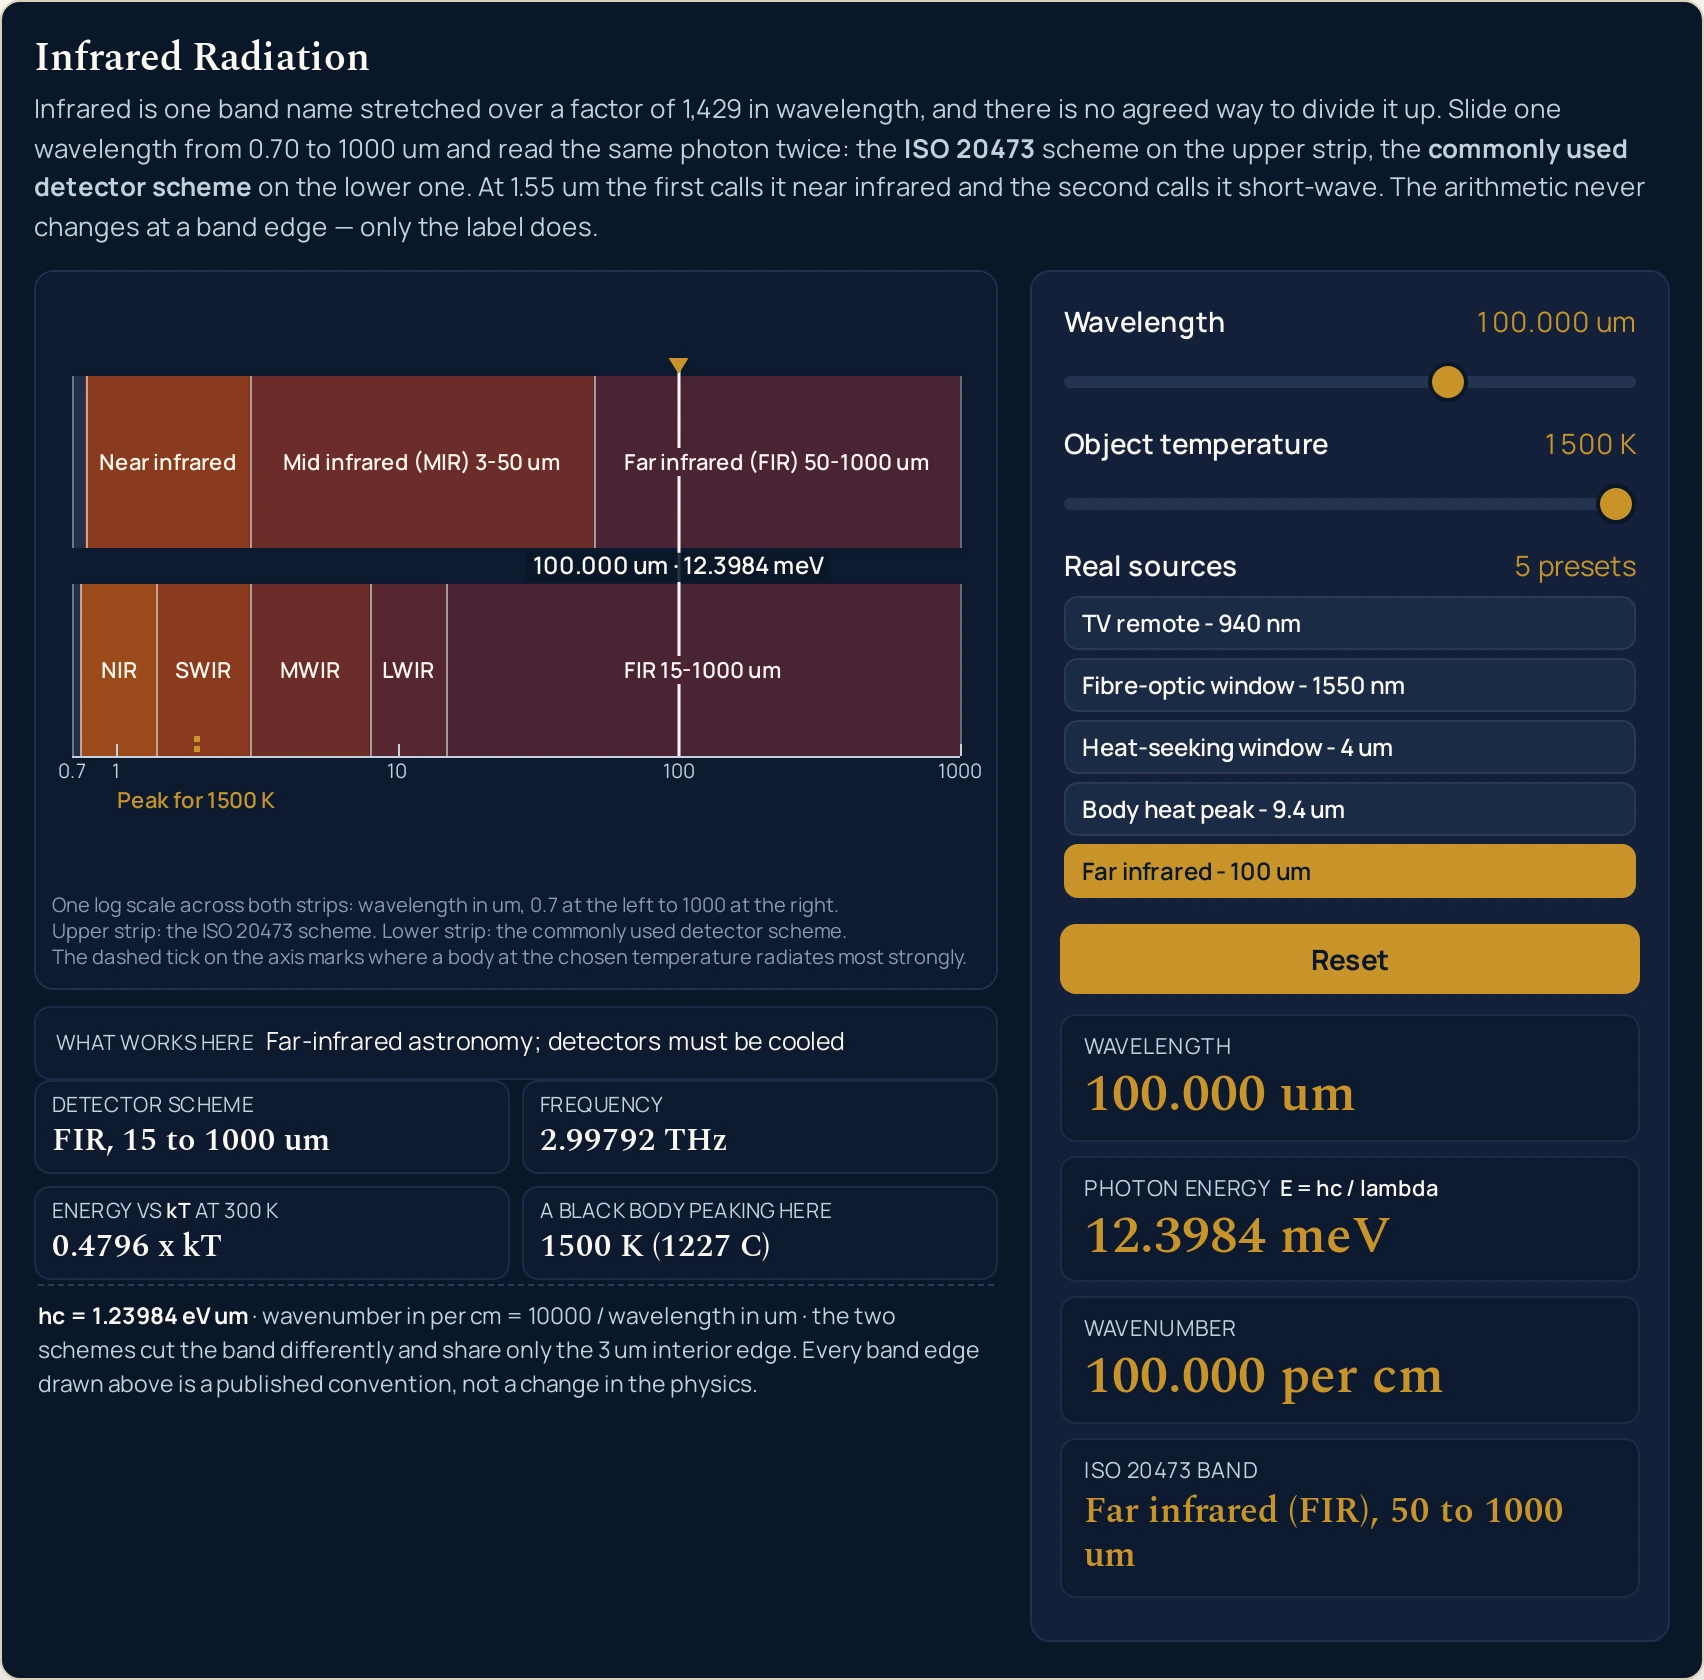
The step worth repeating is the seventh one. Load Far infrared - 100 um and then drag Object temperature from end to end without touching anything else. The chip runs from 200 K (-73 C) to 1500 K (1227 C) and the dashed tick walks the length of the axis, while Photon energy does not move off 12.3984 meV. Nothing about the photon has changed; only the body you asked about has.
If typing suits you better than dragging — or if the figure you have is a wavenumber off a spectrum rather than a wavelength — that is the job of the infrared radiation calculator, which takes any one of four units and returns the other three. For what infrared is, all five published schemes side by side, what sits in each part of the band and seven problems worked end to end, read the full guide to infrared radiation.
Worked example: change one thing at a time
Every row below is one wavelength, and every cell is a string the running lab printed there. These eleven are the settings this cluster publishes, so they are also the ones the lab’s own tests pin. Six of them are reachable from the panel — the five preset buttons and the 0.70 µm stop — while 0.76, 2.99, 3 and 50 µm fall between two slider positions and are pinned the same way a preset pins one.
| Setting | Wavelength | Photon energy | Wavenumber | ISO 20473 band | Detector scheme |
|---|---|---|---|---|---|
| 0.7 um | 700.000 nm | 1771.20 meV | 14285.7 per cm | Below the ISO 20473 floor (0.78 um) | Below the detector scheme (0.75 um) |
| 0.76 um | 760.000 nm | 1631.37 meV | 13157.9 per cm | Below the ISO 20473 floor (0.78 um) | NIR, 0.75 to 1.4 um |
| 0.94 um | 940.000 nm | 1318.98 meV | 10638.3 per cm | Near infrared (NIR), 0.78 to 3 um | NIR, 0.75 to 1.4 um |
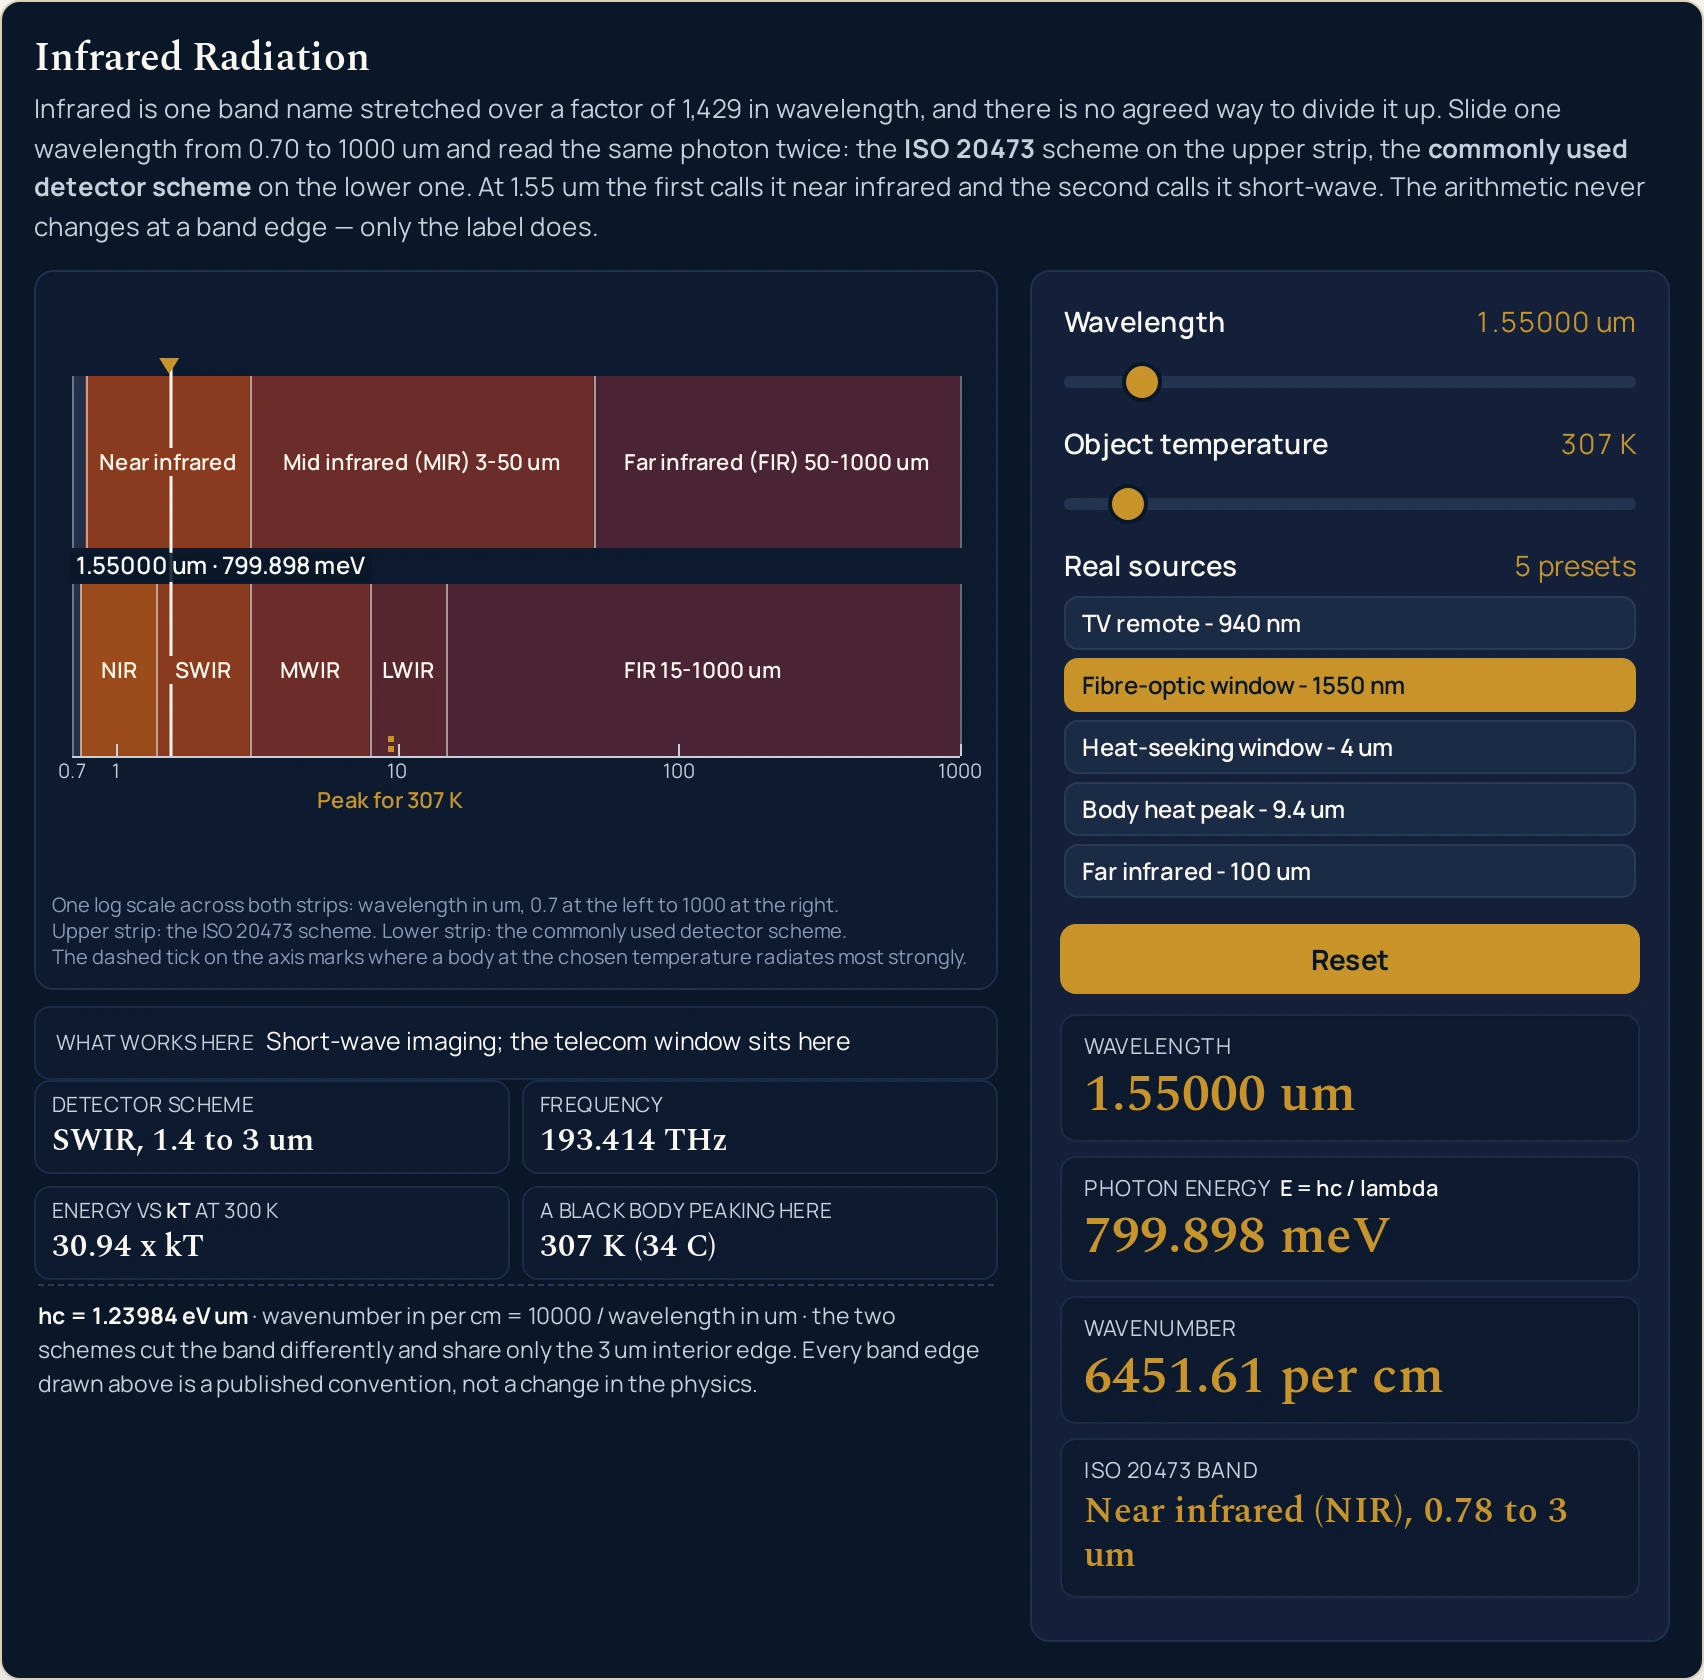
| 1.55 um | 1.55000 um | 799.898 meV | 6451.61 per cm | Near infrared (NIR), 0.78 to 3 um | SWIR, 1.4 to 3 um |
| 2.99 um | 2.99000 um | 414.663 meV | 3344.48 per cm | Near infrared (NIR), 0.78 to 3 um | SWIR, 1.4 to 3 um |
| 3 um | 3.00000 um | 413.281 meV | 3333.33 per cm | Mid infrared (MIR), 3 to 50 um | MWIR, 3 to 8 um |
| 4 um | 4.00000 um | 309.960 meV | 2500.00 per cm | Mid infrared (MIR), 3 to 50 um | MWIR, 3 to 8 um |
| 9.4 um | 9.40000 um | 131.898 meV | 1063.83 per cm | Mid infrared (MIR), 3 to 50 um | LWIR, 8 to 15 um |
| 50 um | 50.0000 um | 24.7968 meV | 200.000 per cm | Far infrared (FIR), 50 to 1000 um | FIR, 15 to 1000 um |
| 100 um | 100.000 um | 12.3984 meV | 100.000 per cm | Far infrared (FIR), 50 to 1000 um | FIR, 15 to 1000 um |
| 1000 um | 1000.00 um | 1.23984 meV | 10.0000 per cm | Far infrared (FIR), 50 to 1000 um | FIR, 15 to 1000 um |
Read the last two columns down the page rather than across it. The upper strip changes name three times over the eleven rows and the lower one five times, and only between 2.99 and 3 µm do both turn over together, 3 µm being the one interior edge they share. That is the lab’s argument in a table: a photon can be near infrared and short-wave at once, and both labels are correct in the publication they come from. The electromagnetic spectrum guide treats infrared as one undivided block, which is the right level for a survey and exactly what this lab takes apart.
Rows 1 and 2 are the disputed short edge. At 0.70 µm both chips decline to name a band and give a floor instead, so the wavelength is infrared and outside both tables at the same time. Six hundredths of a micrometre later only one of them has started, which is the sliver between 0.75 and 0.78 µm where exactly one scheme has an opinion.
Rows 5 and 6 are the proof of the boundary rule. Both chips turn over between 2.99 and 3 µm, so 3 µm belongs to the band above it rather than the band below. Compare what the arithmetic does over the same step: 414.663 to 413.281 meV, about one part in three hundred, while two band names change completely. Nothing in the physics happens at a committee’s line.
Rows 9 and 10 straddle the point where one photon stops being worth more than its surroundings. At 50 µm the grid reads 0.9592 x kT and at 100 µm 0.4796 x kT, so the crossing falls between the two rows. The cell keeps printing a figure rather than a verdict on either side of it.
The other four readouts, at eight of the same wavelengths
The first table holds the four cards. The grid and the sentence strip hold the rest, and they are worth a table of their own because two of them change unit or wording across the band while the cards do not.
| Setting | Frequency | Energy ratio at 300 K | What works here |
|---|---|---|---|
| 0.7 um | 428.275 THz | 68.51 x kT | Fibre optics and night-vision image intensifiers |
| 0.94 um | 318.928 THz | 51.02 x kT | Fibre optics and night-vision image intensifiers |
| 1.55 um | 193.414 THz | 30.94 x kT | Short-wave imaging; the telecom window sits here |
| 4 um | 74.9481 THz | 11.99 x kT | The 3 to 5 um atmospheric window; heat-seeking sensors |
| 9.4 um | 31.8928 THz | 5.102 x kT | Thermal imaging - NASA calls 8 to 15 um thermal infrared |
| 50 um | 5.99585 THz | 0.9592 x kT | Far-infrared astronomy; detectors must be cooled |
| 100 um | 2.99792 THz | 0.4796 x kT | Far-infrared astronomy; detectors must be cooled |
| 1000 um | 299.792 GHz | 0.04796 x kT | Far-infrared astronomy; detectors must be cooled |
The frequency cell is the one that changes unit, dropping out of terahertz below one of them: 5.99585 THz, 2.99792 THz, then 299.792 GHz at the long stop. The sentence strip repeats itself on purpose — three of the eight rows share one sentence, because the strip has five sentences for a band the two schemes between them cut into eight pieces.
Every boundary, dragged one position at a time
Park the thumb on a published edge and the lab will not let you: there is no position there. The table below is every pair of consecutive stops that straddles an edge, read off the running lab after a real drag, which clears whatever a preset had pinned.
| Position | Wavelength | Photon energy | ISO 20473 band | Detector scheme |
|---|---|---|---|---|
| 9 | 747.295 nm | 1659.11 meV | Below the ISO 20473 floor (0.78 um) | Below the detector scheme (0.75 um) |
| 11 | 758.232 nm | 1635.18 meV | Below the ISO 20473 floor (0.78 um) | NIR, 0.75 to 1.4 um |
| 15 | 780.587 nm | 1588.34 meV | Near infrared (NIR), 0.78 to 3 um | NIR, 0.75 to 1.4 um |
| 200 | 2.99281 um | 414.274 meV | Near infrared (NIR), 0.78 to 3 um | SWIR, 1.4 to 3 um |
| 201 | 3.01463 um | 411.276 meV | Mid infrared (MIR), 3 to 50 um | MWIR, 3 to 8 um |
| 335 | 7.97977 um | 155.373 meV | Mid infrared (MIR), 3 to 50 um | MWIR, 3 to 8 um |
| 336 | 8.03795 um | 154.249 meV | Mid infrared (MIR), 3 to 50 um | LWIR, 8 to 15 um |
| 421 | 14.9043 um | 83.1868 meV | Mid infrared (MIR), 3 to 50 um | LWIR, 8 to 15 um |
| 422 | 15.0130 um | 82.5847 meV | Mid infrared (MIR), 3 to 50 um | FIR, 15 to 1000 um |
| 587 | 49.7766 um | 24.9081 meV | Mid infrared (MIR), 3 to 50 um | FIR, 15 to 1000 um |
| 588 | 50.1395 um | 24.7278 meV | Far infrared (FIR), 50 to 1000 um | FIR, 15 to 1000 um |
Two of those four pairs move only the lower chip. Positions 335 to 336 cross 8 µm, 421 to 422 cross 15 µm, and the upper chip holds at Mid infrared (MIR), 3 to 50 um through both of them — ISO 20473 simply has no line there. Positions 587 to 588 are the mirror image: the upper chip finally moves to Far infrared (FIR), 50 to 1000 um while the lower one has been reading FIR, 15 to 1000 um since position 422, more than a hundred and sixty stops earlier.
Positions 9, 11 and 15 are the short edge in three readings. At 747.295 nm neither scheme has begun; at 758.232 nm the detector scheme has and ISO 20473 has not; at 780.587 nm both have. Thirty-three nanometres, inside the first fifteen positions of a 1001-position control, hold the whole of a dispute that the guide to the band on the other side of visible light never has to deal with, because that guide has one set of boundaries to report and this band has at least five competing sets in print.
Formula and symbol reference
The panel prints its relation on itself, inside the label of the card it feeds: E = hc / lambda sits above the Photon energy card, so the answer never arrives without the rule that produced it. The fixed line adds the constant in the units the lab works in and the definition of the wavenumber beside it. Neither is derived here; where E = hf comes from belongs to the guide to the photon energy formula.
Everything else on the screen is that one relation plus a lookup. The two band chips are table lookups against published edges, the sentence strip is a lookup against the same tables, and the temperature chip answers a question about a different object altogether. The table below is where to look up what each symbol means and the range this lab moves it over.
| Symbol | Meaning | SI unit | In this lab |
|---|---|---|---|
| lambda | Wavelength of the light, and what the first slider sets. It is also the horizontal axis of the whole drawing, so every mark on the canvas is placed through it | metre (the card is in micrometres, or nanometres below 1) | 0.70 to 1000 across 1001 positions, printed to six significant figures: “700.000 nm” at the short stop, “9.40000 um” on the shipped default, “1000.00 um” at the long stop. |
| E | Energy carried by one photon, on the Photon energy card. The card’s own label prints the relation it applies | joule (the card is in milli-electronvolts) | six significant figures, falling across three decades: “1771.20 meV” at 0.70 µm down to “1.23984 meV” at 1000 µm. |
| wavenumber | One over the same wavelength, on the Wavenumber card. The unit is written out as per cm, never as a superscript |
per metre (the card is in per cm) | six significant figures: “14285.7 per cm” at the short stop, “1063.83 per cm” on the default, and “100.000 per cm” at 100 µm. |
| f | Frequency of the same light, in the Frequency cell. It carries no information the wavelength does not | hertz (the cell is in terahertz, or gigahertz below 1) | six significant figures with a unit switch at the long end: “428.275 THz”, “31.8928 THz”, then “299.792 GHz” at 1000 µm. |
| E / kT | The photon energy as a multiple of the thermal energy scale at 300 K, in the Energy vs kT at 300 K cell. It is a ratio of two energies and nothing else | dimensionless | four significant figures, and below one it is still a number: “68.51 x kT” at the short stop, “5.102 x kT” on the default, “0.04796 x kT” at the long stop. |
| T | Temperature of a body somewhere else entirely — the thing doing the radiating, not the photon. It feeds the one chip and the dashed tick and nothing else | kelvin | 200 to 1500 in steps of 1, printed beside the slider and again in the chip with a Celsius figure: “200 K (-73 C)”, “307 K (34 C)” (the default), “1500 K (1227 C)”. |
| hc | The Planck constant times the speed of light, divided by the elementary charge. The fixed line under the controls prints it rather than hiding it | electronvolt micrometre | a constant: the lab’s own line reads hc = 1.23984 eV um, which is this cluster’s contract figure and the same number the site already publishes in electronvolt nanometres. |
The row worth reading twice is the temperature. It is the only symbol in the table that is not a property of the light, and the panel keeps it visibly apart: one chip, one dashed tick, and no influence on any of the other eight readouts. Mixing the two up is the commonest way to misread a thermal-imaging specification.
The physics: one axis, two strips, and a control coarser than a boundary
Everything on the left of the screen comes out of one map, and it is a logarithmic one. Wavelength goes to a horizontal position with 0.7 µm at the left edge and 1000 at the right, and nothing is drawn anywhere that map did not put it: not the band edges, not the marker, not the dashed tick, not the decade labels. Two strips share that single axis, which is the only honest way to show that they disagree.
A logarithmic axis is the right choice and it has a cost. It gives each decade the same width, so the near infrared is not crushed against the left-hand edge the way a linear scale would crush it — but it also means the slider’s resolution is a ratio rather than a length. One of the 1001 steps is worth 5.104 nm at the short end and 7.238 µm at the long one, and that is why a round micrometre figure almost never has a position of its own.
That single fact explains the preset buttons. A control that cannot land on 3 µm cannot be used to demonstrate what happens at 3 µm, so each preset pins the exact wavelength and then moves the thumb to the nearest of the 1001 positions. Drag the thumb and the pin is dropped at once, which is honest: the wavelength then really is whatever the position says it is, and the card prints that instead.
The two strips give their labels up in a fixed order as the canvas narrows, and the lower one always goes first. Five bands over a log axis makes SWIR, which runs 1.4 to 3 µm, a thin slice of the picture, so there is no room to write inside it long before the upper strip is in trouble. A label that will not fit is dropped, never shrunk into illegibility and never cut off mid-word.
| Viewport | Canvas in CSS pixels | Upper strip writes | Lower strip writes | Caption lines | Decade labels |
|---|---|---|---|---|---|
| 1280 | 610 by 358 | Near infrared · Mid infrared (MIR) 3-50 um · Far infrared (FIR) 50-1000 um | NIR · SWIR · MWIR 3-8 um · LWIR · FIR 15-1000 um | three | all four, and 0.7 |
| 860 | 490 by 358 | Near infrared · Mid infrared (MIR) 3-50 um · Far infrared (FIR) 50-1000 um | NIR · SWIR · MWIR · LWIR · FIR 15-1000 um | three | all four, and 0.7 |
| 380 | 346 by 288 | NIR · Mid infrared · Far infrared | NIR · MWIR · FIR 15-1000 um, with two gaps | three | all four, and 0.7 |
| 320 | 286 by 288 | NIR · Mid infrared · Far infrared | FIR 15-1000 um alone | three | all four, and 0.7 |
| 240 | 214 by 288 | NIR · MIR · Far infrared | FIR 15-1000 um alone | two | all four, no 0.7 |
Two things in that table are worth naming. The four decade labels survive every width, because they are what makes the axis readable at all; the 0.7 label at the crowded left-hand end is the one that goes, and only in the narrowest column tested. The caption is trimmed before the drawing is, which is why the narrowest column has two caption lines and still draws the dashed tick. The guarantee runs the other way: if the tick row is ever squeezed out, the caption line describing it goes with it, so the drawing never describes something it is not drawing.
The marker label is the last thing standing, at every width tested. That ordering is deliberate, because the band name is the redundant part: the number beside the marker already says which band it is in for anyone who has read either chip. When a band name and the marker label would collide, it is the band name that gives way.
Narrow the viewport far enough and the lower strip is reduced to FIR 15-1000 um alone — one label out of five. The Detector scheme chip in the panel is unaffected and still prints the full string, which is the division of labour the whole lab is built on: the picture argues, the panel answers. The electromagnetic spectrum lab is the other end of that scale, where this entire band is one block with one name.
Where the infrared radiation simulator breaks down
The lab solves its own model exactly, so nothing on the screen ever fails. Everything below is a limit of that model, of a 1001-position control, or of what two published tables and one log axis can carry — and each item says what this lab does about it.
- Every edge drawn in both strips is a committee’s line, not an edge in the physics
- Nothing in the arithmetic jumps as the marker crosses 3 µm. The table of consecutive positions proves it on the lab’s own output: the printed energy moves from 414.274 to 411.276 meV across that one step while both band names change outright. The edges are drawn because they are the language the subject is written in, not because the lab has found something there, and the fixed line under the controls says exactly that.
- Only two strips are drawn, and at least five schemes are in print
- What you can see here is ISO 20473 on top and the detector scheme underneath. Three more published divisions exist — the CIE one, the astronomers’ one and the one organised by what a sensor responds to — and none of them is on the canvas, so a band name taken from any of those three will match neither strip. These two earned the space because each covers the band end to end with no unnamed gaps in it. All five are tabulated side by side in the guide to this topic.
- The lab hands down no verdict on the two strips, and the drawing is why
- Ask it to compare the two names and 4 µm defeats the question at once: both strips are offering a word beginning “mid”, over two stretches of axis that look nothing alike. Ask it to compare the two intervals instead and the answer would be “different” at all 1001 positions, because no wavelength in the band is handed the same pair of edges by both strips — they meet at 3 µm, but never at both ends of a band at once. A chip saying so at every stop would teach nothing. Two strips drawn to the same scale make the point without a rule that can be got wrong.
- The slider cannot reach most round figures, and it does not pretend to
- Of the 1001 positions, exactly two land on a round number: 0 gives 700.000 nm and 1000 gives 1000.00 um. Everything between is whatever the ratio produces, so position 683 reads 99.9761 um rather than 100, and position 358 reads 9.43090 um rather than 9.4. The preset buttons exist for that reason and pin the figure instead; a drag always clears the pin, so the card and the thumb can never quietly disagree.
- The picture gives up before the panel does
- At a canvas of 286 px the lower strip has lost four of its five names and the upper strip has shortened all three of its own. Both chips in the panel are unaffected and go on printing the full strings, so a reading taken on a phone is the same reading taken on a desktop. What you lose on a narrow screen is the argument the drawing makes, not any of the answers, and the caption shortens with it rather than describing labels that are no longer there.
- The temperature slider answers a question about something else entirely
- It describes a body that might be radiating, not the photon on the axis, which is why eight of the nine readouts ignore it completely. The lab prints only the temperature you set and never a peak wavelength, so there is nothing here to re-derive and nothing to contradict: the number itself belongs to the Wien’s displacement law calculator, and how much that body radiates belongs to the Stefan-Boltzmann law guide, not to any readout on this panel.
- The sentence strip is a quoted convention, not a measurement
- Real atmospheric transmission is a smooth function of wavelength that depends on the water vapour overhead, the altitude and the path length. This strip reduces the useful parts of it to five fixed sentences chosen by the band, paraphrased from the scheme tables and, for the 8 to 15 µm line, from NASA. Treat them as the shape of an answer rather than a figure, and note that no transmission number, no percentage and no curve is printed anywhere in the lab.
- How bright anything is never comes into it
- The last cell of the grid sets one energy against another and stops there; it is not a detector specification and not a signal-to-noise figure. Look along the canvas and there is no curve on it and no intensity axis either, so nothing drawn or printed can say how strongly a thing radiates, over what area, or with what emissivity. That is a different question with a tool of its own: the blackbody radiation guide is where a band fraction gets worked out, and this lab never touches one.
- Read the card, never the thumb
- Three different wavelengths can leave the thumb in exactly the same place. Position 200 is where the pinned 2.99000 um sits, where the pinned 3.00000 um sits, and what a drag turns into 2.99281 um — and the first two of those are on opposite sides of a band edge. Only the Wavelength card tells them apart, which is why every figure quoted on this page is a card string and never a slider position. Each one is rounded once from the exact value, so take a reading from the card that publishes it rather than rebuilding it from a neighbour.
- One idealised photon in a vacuum, and no real source anywhere
- The marker is a single position on the axis, and nothing that actually radiates is that narrow. Point a spectrometer at any of the five preset sources and you get a spread, so the figure printed on the button is a centre and not the whole story — which is also why a preset name is only a label for the wavelength it pins. Refractive index is absent too: these are vacuum wavelengths, and one measured inside glass or a fibre is shorter than the one that belongs on this axis.
- Nothing on this panel was measured by anybody
- Two slider positions go in, two published tables are consulted, and the rest is arithmetic. That makes the lab a good place to settle what a band name covers and a poor place to find out what any particular device does. Start from the calculator for this band instead when the figure you hold is in per cm, in meV or in terahertz. Then check it against a source of your own before you quote it anywhere.
Where infrared band names are actually used
- Pinning down what a supplier means by “NIR”
- A camera sold as “NIR” and a filter sold as “near infrared” may not overlap at all: load Fibre-optic window - 1550 nm and read both chips, Near infrared (NIR), 0.78 to 3 um against SWIR, 1.4 to 3 um. The edges in those two strings are what to ask a supplier for, because the name on its own does not fix a range. This is the single most useful thing the two-strip drawing does.
- Explaining why a thermal camera is built for one stretch of the band
- Load Body heat peak - 9.4 um and read the sentence strip and the lower chip together: Thermal imaging - NASA calls 8 to 15 um thermal infrared and LWIR, 8 to 15 um. Then run the temperature slider upwards and watch the dashed tick walk out of that block altogether. Two readouts and one tick carry the whole engineering argument for a long-wave sensor.
- Seeing how lopsided the two divisions really are
- The strips are drawn to scale on a log axis, which makes a point no list of boundaries does. ISO 20473 gives mid infrared a block running from 3 to 50 µm while the detector scheme cuts the same stretch into MWIR, LWIR and part of FIR; drag the marker from 3 to 50 µm and the upper chip never changes while the lower one takes three different names. Walk it across once and the asymmetry stops being an abstraction.
- Settling whether a figure is even inside the band
- Both chips answer honestly at the short end rather than guessing. Drag to position 0 and they read Below the ISO 20473 floor (0.78 um) and Below the detector scheme (0.75 um), which together say the useful thing: 0.70 µm is in the band and in neither scheme’s table. That is exactly the situation the 700-against-780 nm disagreement creates, and it is why the slider starts where it does.
- Teaching the difference between a convention and a calculation
- Five readouts on this panel are computed and three are lookups, and telling students which is which is half the lesson. Wavelength, Photon energy, Wavenumber, Frequency and the energy ratio come out of the arithmetic; both band chips and the sentence strip are lookups against a published table, and the ninth readout only repeats the temperature slider. Drive the slider across position 200 and the two kinds behave visibly differently: one set inches, the other jumps.
- Comparing the two sides of visible light
- The ultraviolet band next door, at 100 to 400 nm, covers a factor of four from end to end; this one covers 1428.57, which is why ultraviolet needs three band names and infrared has at least five competing sets of them. Drag this slider from stop to stop and the photon energy card falls by the same factor of 1428.57, from 1771.20 to 1.23984 meV. The ultraviolet radiation calculator is the tool for the other side.
- Catching a wrong conversion before you pass it on
- Multiply the Photon energy card in electronvolts by the Wavelength card in micrometres and you get the constant the fixed line prints, 1.23984. It works at every position of the slider, catches a factor-of-ten slip instantly, and catches a misquoted band name immediately afterwards — because once the wavelength is right, both chips are decided by the table rather than by whoever wrote the figure down.
Where to go next
The topic itself — what infrared radiation is, all five published schemes attributed side by side, what sits in each part of the band, the two different things both sold as night vision, and seven problems worked end to end — is in Infrared Radiation: Uses and Properties. If typing suits you better than dragging, the infrared radiation calculator heads the list below and takes a wavenumber, an energy or a frequency as readily as a wavelength.
The neighbouring questions have tools of their own. The electromagnetic spectrum guide puts this band back among the other six; the guide to wavelength units covers the micrometre and the nanometre themselves; and the guide to frequency and period is worth a look if the terahertz cell is the unfamiliar one.
Further out on the thermal side, the guide to heat against temperature is worth reading before anyone calls this band “heat”, and the guide to the three modes of heat transfer is where radiation sits beside conduction and convection. The rest is in the library of physics simulations, the calculator index and the blog.
Frequently asked questions
Why is the wavelength slider a position from 0 to 1000 rather than a wavelength?
Because the long edge of the band is 1428.57 times the short edge, and a linear control would spend almost all of its travel in the far infrared. Each of the 1001 positions multiplies the wavelength by the same ratio, 1.0072909, so one step is worth 5.104 nm at the 0.70 micrometre end and 7.238 micrometres at the 1000 micrometre end. The Wavelength card prints the figure itself, to six significant figures.
I pressed Body heat peak - 9.4 um and the slider moved to 358. Why does dragging to 358 give something else?
Because a preset pins a wavelength where the slider only derives one. Position 358 on its own is 9.43090 um, the nearest of the 1001 positions to 9.4 micrometres, and that is exactly what the card prints if you drag there by hand. Each of the five preset buttons pins the round figure and then moves the thumb to the nearest position, so the card reads 9.40000 um. Touching the slider clears the pin.
Can I put the marker exactly on the 3 micrometre boundary by dragging?
No, and watching that fail is the useful part. Position 200 reads 2.99281 um and position 201 reads 3.01463 um, so the boundary falls between two neighbouring stops and no drag lands on it. Both chips change across that one step: Near infrared (NIR), 0.78 to 3 um and SWIR, 1.4 to 3 um become Mid infrared (MIR), 3 to 50 um and MWIR, 3 to 8 um, while the printed energy moves by about seven parts in a thousand.
I moved the object temperature slider and the photon readouts did not change. Is the lab stuck?
No, and it is the cleanest single result on the panel. A temperature describes the body doing the radiating, not the wavelength you picked, so that slider moves exactly two things: the A black body peaking here chip and the short dashed tick on the axis. Park the marker on 9.4 micrometres and run the slider the whole way: the chip goes from 200 K (-73 C) to 1500 K (1227 C) while Photon energy holds at 131.898 meV.
Why does the lab not say which of the two schemes is right?
Because no honest rule for that survives contact with the band tables, so the question was deliberately left unanswered. Each strip prints its own band name together with its own edges, so at 9.4 micrometres one reads Mid infrared (MIR), 3 to 50 um and the other reads LWIR, 8 to 15 um, and each is correct in the publication it comes from. The lab draws the disagreement and decides nothing about it.
Why do the detector strip labels disappear on a narrow screen while the ISO ones stay?
Because five bands over one logarithmic axis makes some of them very thin, and the drawing drops a label rather than squashing it or cutting it off mid-word. On a 346 pixel canvas the detector strip writes NIR, MWIR and FIR 15-1000 um and leaves two gaps; by 286 pixels only FIR 15-1000 um survives, while the upper strip still writes all three of its names. The Detector scheme chip in the panel never goes.
What does the What works here strip actually measure?
Nothing at all, and that is deliberate. It prints one of five fixed sentences chosen by the band, paraphrased from the scheme tables that this cluster cites and taken from NASA for the 8 to 15 micrometre line. There is no transmission figure, no percentage and no curve anywhere in this lab, so read the strip as the shape of an answer rather than as a measurement of anything.
Can the slider leave the infrared band at either end?
No. It is hard-limited to 0.70 and 1000 micrometres, the only two positions of the 1001 that land on a round figure, so the two out-of-band strings the chips can print are reachable only through the test hook. The 0.70 um stop is the interesting one: neither scheme has begun there, so both chips print the floor they are waiting for rather than a band name, as the first two rows of the worked table show.
References & formula source
- The arithmetic behind the four cards uses five constants and fits nothing. The Planck constant, the speed of light, the elementary charge and the Boltzmann constant are all exact by the 2019 definitions of the SI units, so the conversion constant the lab prints on itself, hc = 1.23984 eV um, is exact too; in electronvolt nanometres the same number is the 1239.842 this site already publishes in its Bohr model and Schrodinger labs, and this cluster introduces no second version of it. The wavenumber card is one over the wavelength with the centimetre written out, and the last cell of the grid divides the photon energy by the thermal energy scale at 300 K, which is 25.8520 meV.
- Both sets of band edges come from the Wikipedia article on infrared, retrieved for this cluster on 2026-10-12, which reports them as published definitions and states that the divisions are not precise and can vary depending on the publication. The upper strip is ISO 20473: near infrared 0.78 to 3, mid infrared 3 to 50 and far infrared 50 to 1000 um. The lower strip is the commonly used detector scheme: NIR 0.75 to 1.4, SWIR 1.4 to 3, MWIR 3 to 8, LWIR 8 to 15 and FIR 15 to 1000 um. Those two were drawn rather than the CIE, astronomy or sensor-response schemes because both are gapless across the whole band.
- Every band edge the lab draws is a CONVENTION agreed by committee and not a physical edge. Nothing in the arithmetic changes at 0.78, 3, 8, 15 or 50 um: the table of consecutive slider positions above proves it on the lab's own output, where one step across the 3 um line moves the printed energy from 414.274 to 411.276 meV while both band chips change completely. The rule this cluster fixes, so that the lab, the calculator and the guide cannot disagree, is that each band owns its SHORT edge and not its long one, with 1000 um, the long edge of the whole band, kept inside far infrared by a stated exception.
- The 0.70 um short edge of the slider is this cluster's deliberate choice and not a fourth scheme. The short edge of infrared is genuinely disputed, with 700, 750 and 780 nm all in print, and the lab reports the consequence rather than hiding it: below the shorter of the two scheme floors both chips decline to name a band and print the floor they are waiting for instead, which the first rows of the two tables above show position by position. The 700 nm to 1 mm band itself is the figure this site already publishes in its electromagnetic spectrum guide, and this lab does not move it.
- The five sentences in the What works here strip are quoted conventions rather than measurements. The 8 to 15 um line follows NASA, whose page on infrared waves, retrieved for this cluster on 2026-10-12, says that region is referred to by Earth scientists as thermal infrared; the same page is where the 940 nanometre television remote on the first preset button comes from. The other four sentences paraphrase the characteristics column of the scheme table cited above. The atmosphere enters this lab only through that strip, as a named convention and never as a measurement, which is the scope limit the questions above spell out.
- The one temperature chip is Wien's displacement law. The lab prints only the temperature you set and never a peak wavelength, so there is no figure here for this page and the guide to this topic to disagree about, and the dashed tick is placed from the whole-number kelvin the slider is on. How strongly a body of that temperature radiates, and what share of its output lands in a chosen band, are separate questions with separate tools on this site, linked above.
- Every readout figure quoted on this page is a string this simulation printed for the preset button or the slider position named beside it, read back out of the running lab in a browser rather than worked out by hand. Each is computed from the exact value and rounded once, so re-deriving one printed figure from another will not always reproduce it. The 1001 positions, the ratio of 1.0072909 that one of them represents, and the 5.104 nm and 7.238 um it is worth at the two ends, all come from the lab's own axis function. Where a figure here and the lab part company, believe the lab, and verify anything you rely on before quoting it.
- Further reading: Infrared — Wikipedia