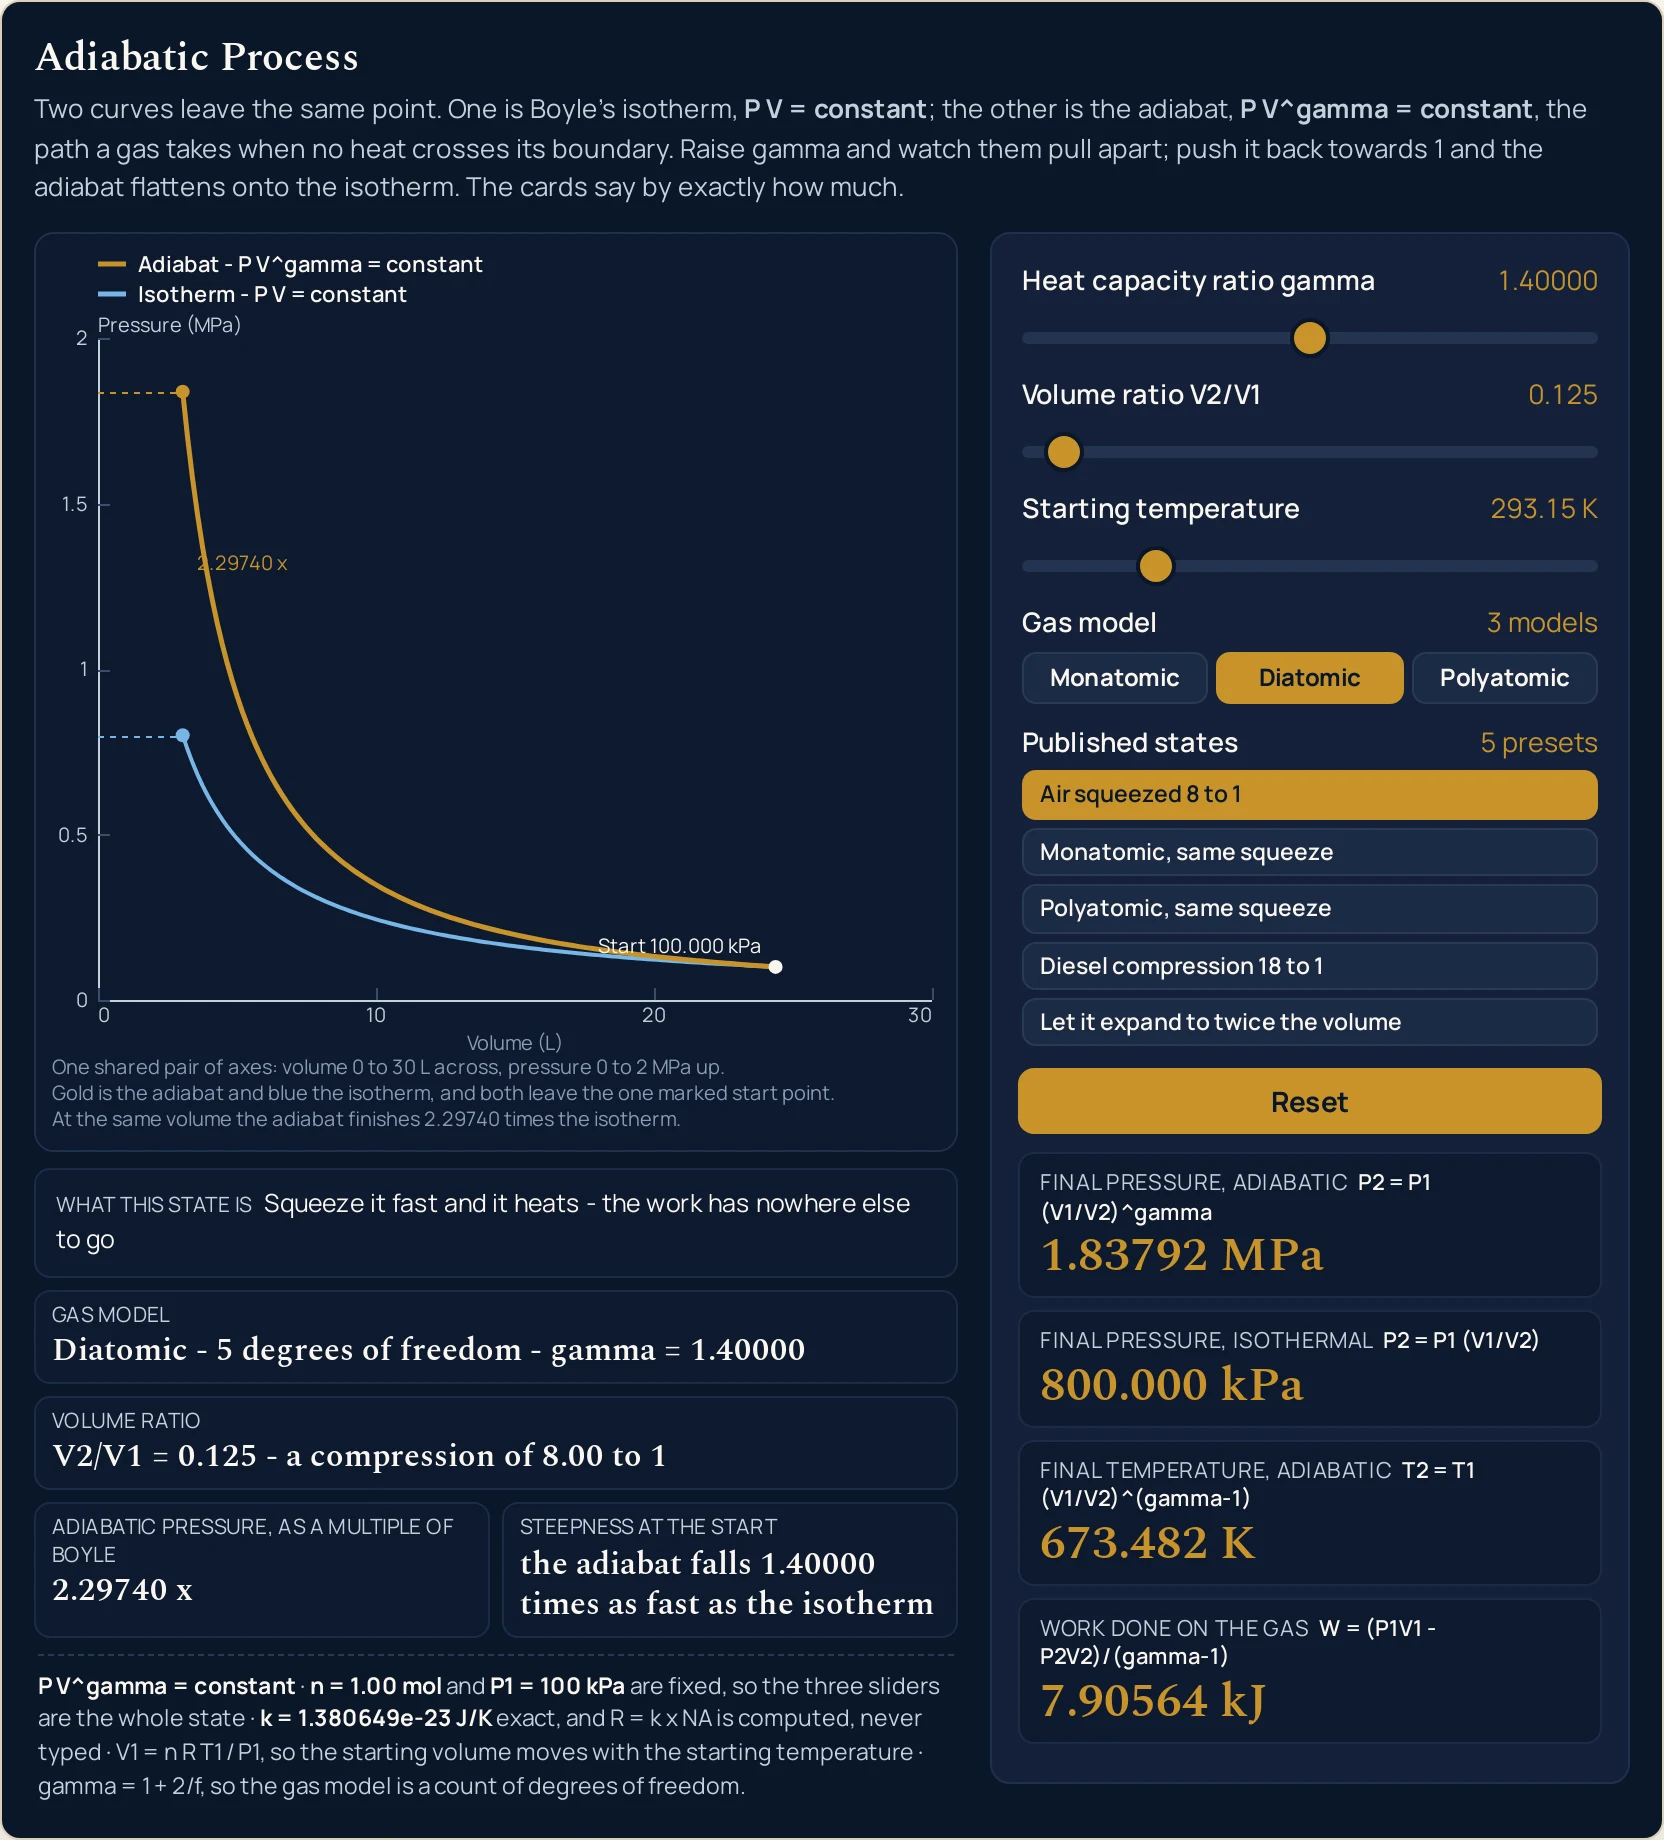
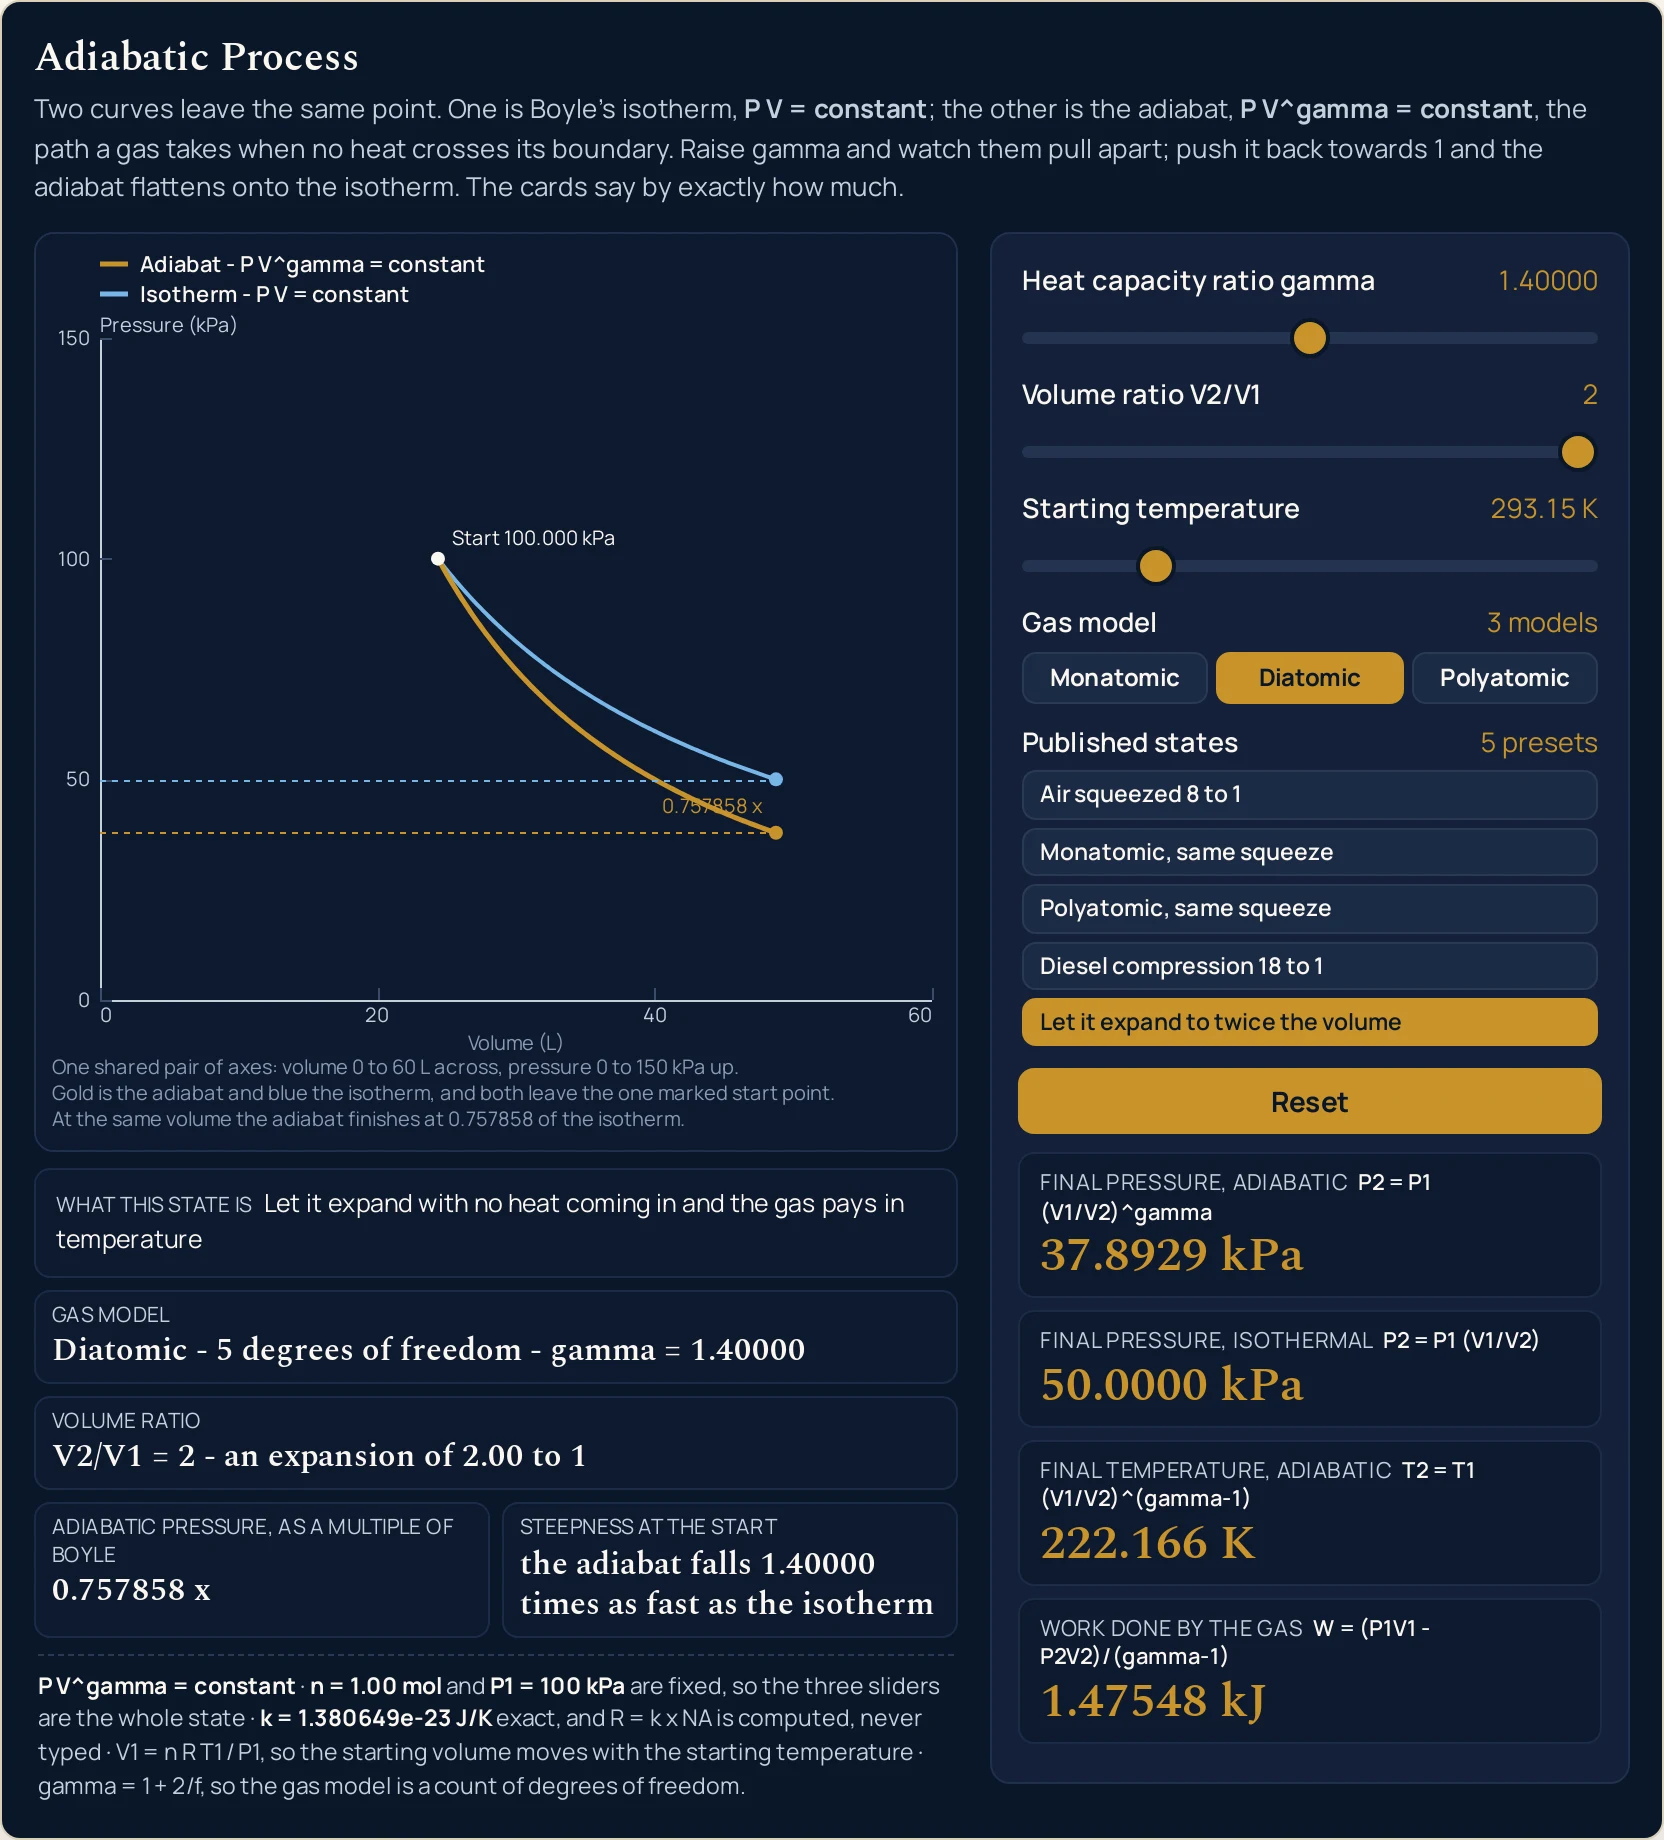
The adiabatic process simulator is a free interactive lab built around a comparison two of our own pages make without ever putting a number on it. Squeeze a gas with no heat crossing its boundary and the pressure climbs the gold curve; squeeze it slowly instead and the pressure climbs the blue one. Both leave the same point on the same pair of axes, and the panel says how far apart they finish: 1.83792 MPa against 800.000 kPa on the state it opens in, which the grid reports as 2.29740 x. Then move gamma and watch the gap open and close.
Adiabatic Process
Two curves leave the same point. One is Boyle's isotherm, P V = constant; the other is the adiabat, P V^gamma = constant, the path a gas takes when no heat crosses its boundary. Raise gamma and watch them pull apart; push it back towards 1 and the adiabat flattens onto the isotherm. The cards say by exactly how much.
Load a real squeeze onto the two curves
The first five buttons press the lab’s own five preset buttons, which are the only way to reach the three exact values its published figures belong to: each pins gamma, the volume ratio and the starting temperature, then derives all three thumbs. The last two press a preset and move one slider, exactly as you would by hand. Work down the list: buttons two and three change only the gas, button four only the squeeze, button five the direction, and the last two push one control towards a limit.
Pick a squeeze above, or drag the three sliders yourself.
What Is the Adiabatic Process Simulator?
The adiabatic process simulator is a free interactive physics lab that runs in your browser, with nothing to install and no sign-up. It plots pressure against volume and draws two curves out of one shared start state: the adiabat, P V^gamma = constant, which is the path of a gas that exchanges no heat with anything, and Boyle’s isotherm, P V = constant, which is the path of the same squeeze taken slowly. The vertical distance between the two ends is what the lab exists to put a number on.
Three sliders and two button rows drive it. Heat capacity ratio gamma runs 1.10 to 1.70 in steps of 0.01, Volume ratio V2/V1 runs 0.05 to 2.00 in steps of 0.01, and Starting temperature runs 100 to 1000 K in steps of 1. Three buttons choose the gas model — Monatomic, Diatomic, Polyatomic — five load a published state, and Reset restores the opening one. The amount of gas and the starting pressure are held at n = 1.00 mol and P1 = 100 kPa, which is what keeps the control count down to three.
Nine readouts answer. Four cards give Final pressure, adiabatic, Final pressure, isothermal, Final temperature, adiabatic and the work, each printed under the relation that produced it and each to six significant figures; a compact grid adds the Gas model with its degrees of freedom, the Volume ratio in both of its forms, the adiabatic pressure as a multiple of Boyle and the steepness at the start; and a sentence strip beneath the drawing makes the ninth. On the opening state the four cards read 1.83792 MPa, 800.000 kPa, 673.482 K and 7.90564 kJ.
One of those nine is the argument of the lab rather than an output of it. Steepness at the start reads the adiabat falls 1.40000 times as fast as the isotherm, and that multiplier is gamma. The qualifier in the label is load-bearing: at the one point the two curves share, where their pressures are equal as well as their volumes, the adiabat’s slope is exactly gamma times the isotherm’s. The other chip, 2.29740 x, is a quite different ratio — the two pressures where the squeeze ends.
Press Monatomic and the two pressure cards open to 3.20000 MPa against 800.000 kPa; press Polyatomic and they close to 1.60000 MPa against the same 800.000 kPa. The isothermal card has no exponent to change, so it does not move for any gas.
What the picture does not contain, it says. Nothing is shaded and nothing is filled, there is no closed loop, no piston and no bouncing molecules: the drawing is two curves, one marked start point, two end dots at the chosen final volume and a dashed guide from each dot out to the pressure axis. The work card prints a magnitude and names its direction in its own heading, flipping to Work done by the gas on an expansion, so no reading is ever a bare negative number. Nothing here computes an entropy, an efficiency, a heat capacity for a named gas or a speed of sound.
| Control | Range | Step or default |
|---|---|---|
| Heat capacity ratio gamma | 1.10 to 1.70 | step 0.01; opens pinned at 1.40000 |
| Volume ratio V2/V1 | 0.05 to 2.00 | step 0.01; opens pinned at 0.125 |
| Starting temperature | 100 to 1000 K | step 1; opens pinned at 293.15 K |
| Buttons | three gas models, five presets, Reset | one press each |
How to use the adiabatic process simulator
- Read the panel before you touch it. The lab opens at rest on air squeezed 8.00 to 1, so every reading is already there: Final pressure, adiabatic 1.83792 MPa, Final pressure, isothermal 800.000 kPa, Final temperature, adiabatic 673.482 K and Work done on the gas 7.90564 kJ. Each card prints the relation that produced it in its own label.
- Find those two pressures in the drawing. One point is marked Start 100.000 kPa and two curves leave it. Two dots sit at the chosen final volume, one on each curve, with a dashed guide from each dot out to the pressure axis. The vertical distance between those dots is the 2.29740 x the grid reports, and the third caption line under the plot says exactly that.
- Read the compact grid as four separate answers. Gas model gives Diatomic - 5 degrees of freedom - gamma = 1.40000, Volume ratio gives V2/V1 = 0.125 - a compression of 8.00 to 1, Adiabatic pressure, as a multiple of Boyle gives 2.29740 x, and Steepness at the start gives the adiabat falls 1.40000 times as fast as the isotherm. The last two are different claims about different places.
- Press a gas-model button and count what moves. With the opening preset loaded, Monatomic takes the adiabatic card to 3.20000 MPa and Polyatomic takes it to 1.60000 MPa. The temperature card and both grid chips move with it, the pressure axis rescales, and Final pressure, isothermal does not move off 800.000 kPa for any of the three.
- Drag the volume ratio and watch both pressures answer. From 0.05 to 2.00 the adiabatic card runs from 6.62891 MPa to 37.8929 kPa and the isothermal one from 2.00000 MPa to 50.0000 kPa. This is the one slider that moves every card on the panel, because it is the only one either curve needs.
- Drag the starting temperature and watch the pressures ignore you. Take it from 100 K to 1000 K and the two pressure cards hold at 1.83792 MPa and 800.000 kPa to the last digit, while Final temperature, adiabatic runs from 229.740 K to 2297.40 K and the work from 2.69679 to 26.9679 kJ. The volume axis stretches with it, because the lab computes the starting volume from the temperature.
- Now take gamma to each end, which is what the lab is for. At the bottom stop the adiabatic card reads 984.916 kPa against the same 800.000 kPa and the two curves nearly coincide; at the top stop it reads 3.42968 MPa and they are far apart. The grid chip follows, from 1.23114 x to 4.28709 x, and the isothermal card never moves.
- Watch the sentence strip change over at two places. The strip labelled What this state is reads As gamma approaches 1 the adiabat flattens onto the isotherm up to a gamma of 1.15 and switches at 1.16; it reads Squeeze it fast and it heats - the work has nowhere else to go up to 1.59 and switches at 1.60 to Few ways to store energy, so nearly all the work becomes heat. One step of the slider decides which sentence has priority.
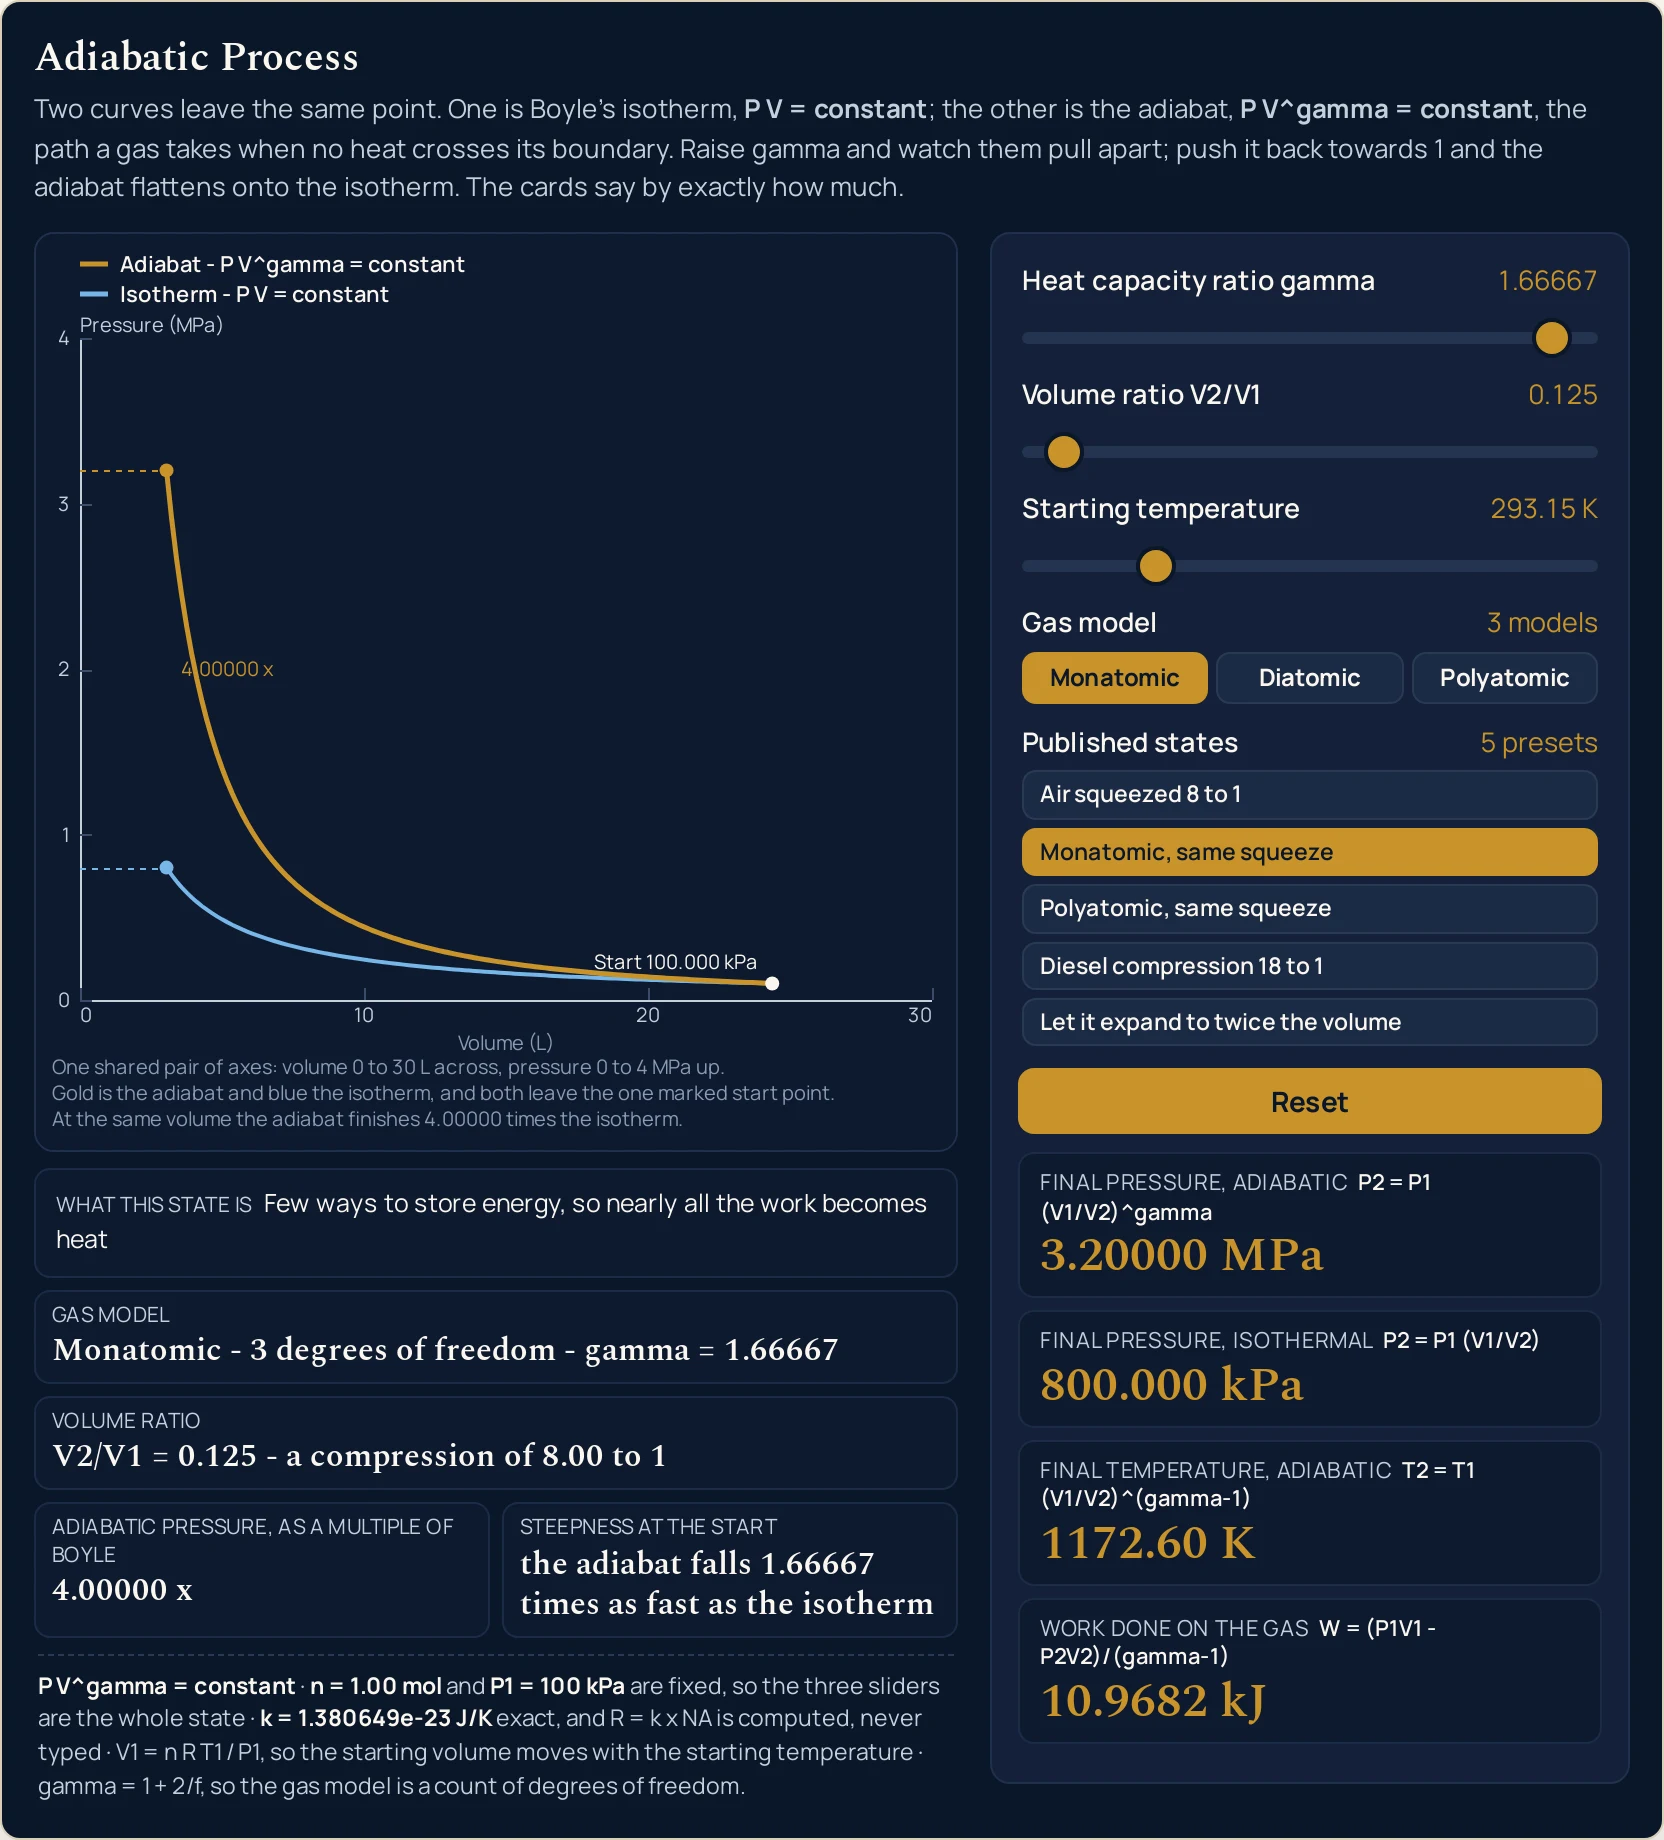
- Send the volume ratio past 1 and read the work card’s heading. At 2.00 the adiabat ends below the isotherm, 37.8929 kPa against 50.0000 kPa, the chip falls under one to 0.757858 x, the gas cools to 222.166 K, and the heading flips to Work done by the gas. Exactly at 1.00 both cards read 100.000 kPa and the work is 0.00000 J.
- Use the preset buttons when you want a published state. None of the three sliders can land on the values the figures belong to: 0.125 falls between two of the volume ratio’s hundredths, 293.15 is not a whole kelvin, and the exact doubles for five thirds and four thirds are not on a grid of hundredths either. A preset pins all three and derives the thumbs; touching a slider drops that slider’s pin alone.
- Press Reset when you have lost track. It restores the pinned opening state and replays the settle from the isotherm, so gamma starts at 1 and climbs and you watch the adiabat separate from the curve it began on. At most one preset button carries the pressed state at a time, and moving any slider by hand clears it.
- Read the fixed line last of all. It gives the relation the gold curve obeys, the two quantities held fixed at n = 1.00 mol and P1 = 100 kPa, the exact Boltzmann constant, the relation the starting volume comes from, and the one tying gamma to the count of degrees of freedom. That is the whole of what the panel assumes, in one line.
If typing suits you better than dragging — or if the quantity you hold is a pressure rather than a volume ratio — that is the job of the adiabatic process calculator, which solves the same relation for either pressure or either volume. For what an adiabatic process is, where gamma comes from and seven problems worked end to end, read the full guide to the adiabatic process.
Worked example: change one thing at a time
Every row below is one button or one drag, and every cell is a string the running lab printed there. The five presets come first because they are the states this cluster publishes; the tables after them hold two of the three sliders still and move the third, which is the only way to see which readouts a given control is allowed to touch.
| Preset button | Final pressure, adiabatic | Final pressure, isothermal | Final temperature | Work card | Multiple of Boyle |
|---|---|---|---|---|---|
| Air squeezed 8 to 1 | 1.83792 MPa | 800.000 kPa | 673.482 K | on the gas, 7.90564 kJ | 2.29740 x |
| Monatomic, same squeeze | 3.20000 MPa | 800.000 kPa | 1172.60 K | on the gas, 10.9682 kJ | 4.00000 x |
| Polyatomic, same squeeze | 1.60000 MPa | 800.000 kPa | 586.300 K | on the gas, 7.31215 kJ | 2.00000 x |
| Diesel compression 18 to 1 | 5.71981 MPa | 1.80000 MPa | 931.534 K | on the gas, 13.2696 kJ | 3.17767 x |
| Let it expand to twice the volume | 37.8929 kPa | 50.0000 kPa | 222.166 K | by the gas, 1.47548 kJ | 0.757858 x |
Read the third column down the page rather than across it. Rows 1 to 3 hold the squeeze and the temperature fixed and change only the molecule: the adiabatic pressure doubles from 1.60000 to 3.20000 MPa and the isothermal one does not move off 800.000 kPa. That flat column is the whole reason the second card is on the panel at all. A slow squeeze cannot tell one gas from another, which is the behaviour the guide to Boyle’s law sets out on its own terms.
Two of those rows land on round numbers, and one deliberately does not. At 8.00 to 1 the monatomic gas finishes at exactly 3.20000 MPa and the polyatomic one at exactly 1.60000 MPa, because the two exponents come out whole. The diatomic case does not: 1.83792 MPa is not a rounded version of anything tidier, and the card prints all six figures for that reason.
Row 5 is the row to stop on. It is the only one where the adiabatic card finishes below the isothermal one, 37.8929 against 50.0000 kPa, so the chip falls under one to 0.757858 x and the work heading changes to by the gas. The temperature card is where the bill is paid, 222.166 K from a start of 293.15 K, and the strip under the drawing puts it in the lab’s own words: Let it expand with no heat coming in and the gas pays in temperature.
The three gas-model buttons at one squeeze and one temperature
Press a preset first and then a gas-model button: the preset’s volume-ratio and temperature pins survive, so the only thing that changes down these three rows is the count of ways the molecule can store energy. The volume ratio cell holds V2/V1 = 0.125 - a compression of 8.00 to 1 throughout and the temperature row holds 293.15 K.
| Gas model button | What the grid cell prints | Final pressure, adiabatic | Final pressure, isothermal | Final temperature | Steepness at the start |
|---|---|---|---|---|---|
| Monatomic | Monatomic - 3 degrees of freedom - gamma = 1.66667 | 3.20000 MPa | 800.000 kPa | 1172.60 K | the adiabat falls 1.66667 times as fast as the isotherm |
| Diatomic | Diatomic - 5 degrees of freedom - gamma = 1.40000 | 1.83792 MPa | 800.000 kPa | 673.482 K | the adiabat falls 1.40000 times as fast as the isotherm |
| Polyatomic | Polyatomic - 6 degrees of freedom - gamma = 1.33333 | 1.60000 MPa | 800.000 kPa | 586.300 K | the adiabat falls 1.33333 times as fast as the isotherm |
The second column is the reason and the third is the result. Three degrees of freedom give the largest gamma and the largest finishing pressure; six give the smallest of each. More ways to store energy means less of the work ends up in the motion that pressure and temperature measure, which is why the polyatomic row heats least. The guide to specific heat capacity is where how a gas stores energy is answered on its own.
Quote the grid cell, never the slider. The gas buttons pin the doubles nearest five thirds and four thirds and then derive thumbs of 1.67 and 1.33, so the cell reads gamma = 1.66667 while the slider shows 1.67. Drag the slider to 1.67 by hand and you get a different state: the cell reads Custom - 2.98507 degrees of freedom - gamma = 1.67000 and the card reads 3.22226 MPa rather than 3.20000.
One preset, then one slider
This is the table to read if a figure here and your own screen ever disagree. It starts from a preset and moves a single control, which is how a pin gets dropped: the three pins are separate, and moving one slider clears only its own. Row 2 is the position the opening preset leaves the thumb in, and it is not the state the preset loaded.
| What you do | What the volume ratio cell prints | Final pressure, adiabatic | Final pressure, isothermal | Final temperature | Work card |
|---|---|---|---|---|---|
| Press Air squeezed 8 to 1 | V2/V1 = 0.125 - a compression of 8.00 to 1 | 1.83792 MPa | 800.000 kPa | 673.482 K | on the gas, 7.90564 kJ |
| then drag the volume ratio to 0.13 | V2/V1 = 0.13 - a compression of 7.69 to 1 | 1.73972 MPa | 769.231 kPa | 662.999 K | on the gas, 7.68773 kJ |
| press the preset again, drag the ratio to 0.05 | V2/V1 = 0.05 - a compression of 20.0 to 1 | 6.62891 MPa | 2.00000 MPa | 971.632 K | on the gas, 14.1030 kJ |
| press the preset again, drag the ratio to 0.5 | V2/V1 = 0.5 - a compression of 2.00 to 1 | 263.902 kPa | 200.000 kPa | 386.814 K | on the gas, 1.94691 kJ |
| press the preset again, drag the ratio to 1 | V2/V1 = 1 - no change in volume | 100.000 kPa | 100.000 kPa | 293.150 K | on the gas, 0.00000 J |
| press the preset again, drag the ratio to 2 | V2/V1 = 2 - an expansion of 2.00 to 1 | 37.8929 kPa | 50.0000 kPa | 222.166 K | by the gas, 1.47548 kJ |
| press the preset again, drag the temperature to 100 | V2/V1 = 0.125 - a compression of 8.00 to 1 | 1.83792 MPa | 800.000 kPa | 229.740 K | on the gas, 2.69679 kJ |
| press the preset again, drag the temperature to 1000 | V2/V1 = 0.125 - a compression of 8.00 to 1 | 1.83792 MPa | 800.000 kPa | 2297.40 K | on the gas, 26.9679 kJ |
Rows 1 and 2 are the same thumb position and two different answers. The preset leaves the thumb at 0.13 while pinning 0.125, so the card reads 1.83792 MPa; touch the slider and the pin goes, the cell reads a compression of 7.69 to 1, and the card reads 1.73972 MPa. That is 98.2 kPa on the headline card, from a thumb that has not visibly moved. Read the card, never the thumb.
Row 5 is the identity state and it is the only honest zero on the panel. With the volume ratio at 1 both pressure cards read 100.000 kPa, the temperature card reads the starting temperature back, and the work reads 0.00000 J exactly. In the drawing the two end dots become one dot and the gap annotation is empty, because there is no gap to name.
The last two rows change the temperature by a factor of ten and both pressure cards ignore it. 1.83792 MPa and 800.000 kPa are byte-identical at 100 K and at 1000 K, while the temperature card scales exactly with the start and the work scales with it too. That surprises people, and the reason is in the relations the cards print on themselves: two of them are pure ratios of volumes.
Gamma from one end of its slider to the other
The squeeze is 8.00 to 1 in every row below, because the opening preset’s volume-ratio and temperature pins survive a drag of the gamma slider. The isothermal card is not in the table for a reason: it reads 800.000 kPa in all nine rows. The two rows marked as buttons are there because the exact doubles for five thirds and four thirds are not on a grid of hundredths.
| Gamma setting | What the grid cell prints | Final pressure, adiabatic | Multiple of Boyle | Sentence strip |
|---|---|---|---|---|
| 1.10000 (drag, the bottom stop) | Custom - 20.0000 degrees of freedom - gamma = 1.10000 | 984.916 kPa | 1.23114 x | As gamma approaches 1 the adiabat flattens onto the isotherm |
| 1.15000 (drag) | Custom - 13.3333 degrees of freedom - gamma = 1.15000 | 1.09283 MPa | 1.36604 x | As gamma approaches 1 the adiabat flattens onto the isotherm |
| 1.16000 (drag) | Custom - 12.5000 degrees of freedom - gamma = 1.16000 | 1.11579 MPa | 1.39474 x | Squeeze it fast and it heats - the work has nowhere else to go |
| 1.33333 (Polyatomic button) | Polyatomic - 6 degrees of freedom - gamma = 1.33333 | 1.60000 MPa | 2.00000 x | Squeeze it fast and it heats - the work has nowhere else to go |
| 1.40000 (Diatomic button, and the opening state) | Diatomic - 5 degrees of freedom - gamma = 1.40000 | 1.83792 MPa | 2.29740 x | Squeeze it fast and it heats - the work has nowhere else to go |
| 1.59000 (drag) | Custom - 3.38983 degrees of freedom - gamma = 1.59000 | 2.72843 MPa | 3.41054 x | Squeeze it fast and it heats - the work has nowhere else to go |
| 1.60000 (drag) | Custom - 3.33333 degrees of freedom - gamma = 1.60000 | 2.78576 MPa | 3.48220 x | Few ways to store energy, so nearly all the work becomes heat |
| 1.66667 (Monatomic button) | Monatomic - 3 degrees of freedom - gamma = 1.66667 | 3.20000 MPa | 4.00000 x | Few ways to store energy, so nearly all the work becomes heat |
| 1.70000 (drag, the top stop) | Custom - 2.85714 degrees of freedom - gamma = 1.70000 | 3.42968 MPa | 4.28709 x | Few ways to store energy, so nearly all the work becomes heat |
The two pairs of adjacent rows are the switch-over points. Between 1.15000 and 1.16000 the strip stops saying the adiabat is flattening onto the isotherm, and between 1.59000 and 1.60000 it starts saying the molecule has few ways to store energy. One hundredth of a slider step decides each, and the flattening sentence outranks the other three whenever it applies.
The first row is the degenerate limit, approached rather than reached. At the bottom stop the finishing pressures are 984.916 and 800.000 kPa, close enough that the two curves are hard to tell apart on the plot, and the chip reads 1.23114 x. The advantage shrinks continuously towards nothing as gamma falls; it does not switch off. A gamma of exactly 1 would need infinitely many degrees of freedom and is below the slider’s stop.
Formula and symbol reference
The panel prints its relations on itself, inside the label of the card each one feeds, and the fixed line under the drawing carries the one the gold curve obeys. No answer arrives here without the rule that produced it. Nothing on this page is derived either: where gamma comes from, and why it is a count rather than a measurement, belongs to the guide to this topic.
Two of the nine entries below are not quantities you set. The degrees of freedom arrive with gamma, and the starting volume is computed from the starting temperature. Everything else is a slider or a card, and the last column gives the range this lab moves it over with the strings it prints at the ends of that range.
| Symbol | Meaning | SI unit | In this lab |
|---|---|---|---|
| gamma | Heat capacity ratio, and what the first slider sets. It is the exponent on the gold curve and the only control the isothermal card ignores | dimensionless | 1.10 to 1.70 in steps of 0.01, printed beside the slider to six figures: “1.10000”, “1.40000”, “1.70000”. A preset or a gas button can pin a value off that grid, and three do: 1.66667, 1.40000 and 1.33333. |
| V2/V1 | Volume ratio, the final volume over the starting one, and what the second slider sets. Below 1 it is a compression and above 1 an expansion | dimensionless | 0.05 to 2.00 in steps of 0.01. The grid cell gives it both ways at once: “V2/V1 = 0.05 - a compression of 20.0 to 1”, “V2/V1 = 1 - no change in volume”, “V2/V1 = 2 - an expansion of 2.00 to 1”. Two presets pin values off the grid, 0.125 and 0.0555556. |
| T1 | Starting temperature, and what the third slider sets. It moves the final temperature and the work, and the volume axis with them, but neither pressure card | kelvin | 100 to 1000 in steps of 1, printed beside the slider: “100 K”, “293 K”, “1000 K”. Every preset pins 293.15 K, which is off that grid, and derives the thumb 293. |
| f | Degrees of freedom, shown in the Gas model cell beside the gamma it implies. You cannot set it; the gas buttons and the gamma slider do | dimensionless | the cell names the model when gamma is one of the three pinned doubles and reads Custom otherwise: “Monatomic - 3 degrees of freedom”, “Diatomic - 5 degrees of freedom”, “Polyatomic - 6 degrees of freedom”, and “Custom - 20.0000 degrees of freedom” at the bottom stop. |
| P2 adiabatic | Final pressure on the gold curve, on the first card, under the relation it comes from: P2 = P1 (V1/V2)^gamma |
pascal | six significant figures, and the unit follows the rounded figure. The smallest the controls reach is “30.7786 kPa” and the largest is “16.2836 MPa”, both at a gamma of 1.70. The formatter has a pascal range and these sliders never reach it. |
| P2 isothermal | Final pressure on the blue curve, on the second card, under P2 = P1 (V1/V2). The volume ratio is the only control that touches it |
pascal | six significant figures on the same formatter: “50.0000 kPa” at the top of the ratio slider and “2.00000 MPa” at the bottom, and nothing between those two depends on gamma or on the temperature. |
| T2 | Final temperature on the gold curve, on the third card, under T2 = T1 (V1/V2)^(gamma-1) |
kelvin | six significant figures: “673.482 K” on the opening state, and the two corners the controls reach are “61.5572 K” and “8141.81 K”. It is the one card the temperature slider scales exactly. |
| W | Work, on the fourth card, under W = (P1V1 - P2V2)/(gamma-1). The heading above it is part of the reading |
joule | six significant figures, with the unit following the rounded figure and the heading flipping with the direction: “0.00000 J” where the volume does not change, “7.90564 kJ” on the opening state, and “84.8290 kJ” at the largest the three sliders reach. |
| V1 | Starting volume. There is no control for it — the lab computes it from the fixed line it prints on itself, V1 = n R T1 / P1, so it moves with the starting temperature |
cubic metre | not a card. It is why the volume axis runs to 10, 30 and 100 L at starting temperatures of 100, 293.15 and 1000 K. Derived, not a readout: 24.3738 L at the opening state. |
The row worth reading twice is the last one. There is no volume control on this panel, and the starting volume it computes is why the volume axis runs to 10 L at the coldest start and 100 L at the hottest while both pressure cards hold still. Both end states on the plot still satisfy the equation of state, and the guide to the ideal gas law is where that relation is set out; the ideal gas law calculator will check any one of them against this panel with a different tool.
The physics: two chips that both sound like “steeper”
The panel reports the distance between the two curves twice, and the two figures are not the same claim. Steepness at the start compares the two gradients; Adiabatic pressure, as a multiple of Boyle compares the two pressures at the final volume. On the opening state they read 1.40000 and 2.29740 x, and confusing one for the other is the commonest mistake made with this picture.
Take the gradients first. On the blue curve the product of pressure and volume is constant, so its gradient is minus the pressure over the volume; on the gold curve the product of pressure and volume to the power gamma is constant, so its gradient is minus gamma times the pressure over the volume. Dividing one by the other always cancels the volume. It cancels the pressure only where the two pressures are equal.
On this panel there is exactly one such place, and it is the marked start point: both curves pass through it, so both have the same pressure and the same volume there. That is why the chip is labelled Steepness at the start and not something more general. Press the three gas buttons and it reads 1.66667, 1.40000 and 1.33333 — the gamma of the moment, and nothing else.
Away from that point the gradient ratio is larger, and it grows with the squeeze. It is gamma multiplied by the ratio of the two pressures, which is the second chip. Derived from the lab’s own cards, not a readout: at the end of the opening 8.00-to-1 squeeze the ratio is 1.40000 times 2.29740, which is 3.21636, and at the end of the diesel squeeze it is 1.40000 times 3.17767, which is 4.44874.
There is a statement about steepness that holds wherever you stand on either curve, and it is about fractional change rather than gradient. A given percentage squeeze lifts the pressure on the gold curve by gamma times as many per cent as on the blue one. The panel will show you this directly: drag the volume ratio to 0.99 and the two cards read 101.417 kPa and 101.010 kPa.
Derived from those two cards, not a readout: on a start of 100.000 kPa those are gains of 1.417 per cent and 1.010 per cent, a ratio of 1.4030. A one per cent step is finite rather than infinitesimal, so the ratio sits a shade above gamma; shrink the step and it approaches 1.40000. That is the version of the claim that holds wherever you stand on either curve, and the panel’s two chips are its local forms.
The isothermal card has nothing for a gas model to change. Its relation carries no exponent at all, which is why 800.000 kPa sits unmoved through every gas button and every gamma position while the card above it travels from 984.916 kPa to 3.42968 MPa. Two of our own pages already say the adiabat is the steeper of the two, the guide to the isothermal process among them, and this panel is where that sentence acquires a figure.
The condition behind all of it is one line. No heat crosses the boundary, so every joule of work has to come out of the gas’s own internal energy, which is the special case of the general bookkeeping that the guide to the first law of thermodynamics sets out in full. The panel does not print that bookkeeping, and there is no heat term on it anywhere.
Three things the drawing refuses to do are worth naming. No area is shaded, because an area under a pressure-volume curve is the subject of the isothermal process lab rather than of this one. No closed loop is drawn, because the area inside a loop is a different subject again. And no piston, cylinder or bouncing molecule appears, because that picture belongs to the lab on the first law.
One shared pair of axes carries both curves, and the caption strip says what they run over rather than leaving you to guess. Both axes auto-scale to hold the start point and both end points on round-number ticks, and the pressure axis follows the same unit rule as the cards: the title reads Pressure (MPa) on the opening squeeze and Pressure (kPa) on the expansion, while Volume (L) never changes its unit. The caption’s third line names the factor between the two end dots, or says there is none.
The third column below is the canvas’s own wording, not the cards’. Each curve gets its own reserved band and each band spends its own width, so the two are rarely on the same rung of the ladder. The adiabat has the longer name to fit, so it is the band that gives wording up first, and at the two narrowest widths here the isotherm is still carrying words the adiabat has already dropped.
| Viewport | Canvas in CSS pixels | The two curve bands write | Caption lines |
|---|---|---|---|
| 1280 | 480 by 458 | Adiabat - P V^gamma = constant · Isotherm - P V = constant | three, every one in its longest form |
| 860 | 440 by 458 | Adiabat - P V^gamma = constant · Isotherm - P V = constant | three; the third line has shortened |
| 380 | 296 by 318 | Adiabat - P V^gamma = constant · Isotherm - P V = constant | three, all three shortened |
| 320 | 236 by 318 | Adiabat - P V^gamma · Isotherm - P V = constant | three, shorter again |
| 240 | 164 by 318 | Adiabat · Isotherm - P V | three, in their shortest forms |
The caption strip is trimmed before either band is. At 380 px all three caption lines have already shortened — the third from The two end dots share a volume, and the adiabat finishes 2.29740 times the isotherm pressure to The gap is 2.29740 x — while both bands are still writing their longest form. Only at 320 px does the adiabat’s band give up its = constant, and only at 240 px is it down to the bare word Adiabat with the isotherm still reading Isotherm - P V.
Narrower than any width in that table, a band label that cannot fit even its shortest form is clipped rather than squashed into illegibility, and the lab’s own tests reach that clip with the isotherm’s band alone at a canvas 112 px wide and with both bands gone at 48 px. Whatever the drawing has had to drop, the cards in the panel go on printing their labels in full, which is why every figure quoted on this page is taken from a card rather than read off the picture.
Where the adiabatic process simulator breaks down
The lab solves its own model exactly, so nothing on the screen ever fails. Everything below is a limit of that model, of three sliders with finite stops, or of what one pair of axes can carry — and each item says what this lab does about it.
- None of the three sliders can land on the state the published figures belong to
- The volume ratio steps in hundredths, so 0.125 falls between 0.12 and 0.13; the temperature steps in whole kelvin, so 293.15 is not one of its 901 positions; and the exact doubles for five thirds and four thirds are not on a grid of hundredths either. Every preset therefore pins its three exact values and derives three thumbs. The gap this closes is real: the thumb’s 0.13 prints 1.73972 MPa where the pinned 0.125 prints 1.83792 MPa, which is 98.2 kPa on the headline card.
- A slider thumb is not a gamma, and the panel draws the distinction on purpose
- The monatomic button pins the double nearest five thirds and leaves the thumb at 1.67, and the grid cell prints the pin at six figures as gamma = 1.66667. Drag to 1.67 by hand and the cell reads Custom - 2.98507 degrees of freedom - gamma = 1.67000, because the lab’s tolerance for recognising a model is 1e-9, while six significant figures put the last printed digit of any gamma on this slider at 1e-5 — ten thousand times coarser. Quote the cell, never the thumb, and never write 1.67 or 1.33 as a gamma this lab used.
- Gamma is held constant here and it is not a constant of the gas
- Dry air measures 1.404 at minus 15 degrees Celsius, 1.400 at 20 degrees and 1.365 at 1000 degrees, a drift of 0.039 across that span, and the slider has no temperature coupling at all. So a reading taken at the opening gamma and carried to the top of a hot compression is wrong in the second decimal place. Run the panel at both ends of the range you care about and treat the spread as the uncertainty rather than trusting one figure.
- Any real squeeze lands between the two curves, so read the pair of cards as a bracket
- Which of these two paths a gas follows is settled by how fast you move the piston, not by what the walls are made of, and no wall is a perfect insulator anyway. The gold curve is the fast limit and the blue one the slow limit, so a genuine compression finishes somewhere between 1.83792 MPa and 800.000 kPa rather than on either. The slow end has its own page in the guide to the isothermal process, so this panel shows it rather than arguing it.
- Both curves assume you can undo them, and one famous counter-example cannot be drawn here
- What the gold curve traces is the reversible case, the one also called isentropic. Let a gas burst into a vacuum and no heat crosses its boundary either, yet it follows nothing on this canvas, so a pressure quoted for that experiment will not be found on any of these cards at any slider position. Where shock, turbulence or friction is involved, treat a reading here as a limit the real process falls short of.
- The work card hides its sign, and that is a choice rather than an omission
- It prints a magnitude and puts the direction in its own heading, so there is never a bare minus sign under an ambiguous label. The consequence is that the signed value appears nowhere on the screen: a page that writes the work of the opening state as a negative number is describing the lab’s test hook, while the card itself reads Work done on the gas 7.90564 kJ. Both describe the same joules going the same way.
- The pressure cards change unit on the rounded figure, and one of their ranges is unreachable
- The formatter switches from kilopascals to megapascals on the figure it has already rounded, which is why a volume ratio of 0.19 reads 1.02269 MPa and 0.20 reads 951.827 kPa one step later. It also has a pascal range, and these three sliders never reach it: a sweep of every volume-ratio position crossed with the gamma range found no state below a kilopascal. No reading in pascals is therefore a state of this lab.
- Nothing is shaded, so no area on this canvas is a quantity
- The picture is two open curves, one start marker, two end dots and two dashed guides. It would be easy to fill the region under the gold curve and call it the work, but an area under a pressure-volume curve is the neighbouring lab’s picture, and the area inside a closed loop is a third page’s subject. Measure nothing on this canvas with a ruler: what it supports is reading the two end dots and the factor printed between them.
- Nothing on this panel was measured by anybody
- Three slider positions go in, one relation is evaluated at a few hundred points to draw each curve, and the rest is arithmetic on two exact constants. That makes the lab a good place to settle how far apart the two curves finish and a poor place to find out what any real compression did. The same gamma also fixes how fast sound travels through the gas, which is a different question with its own tools in the guide to the speed of sound; no figure for it appears here.
- Two browsers were checked against each other, and a third was never exercised
- Chrome and Firefox agree on 134 readouts at each of four viewport widths, which is what the cluster’s cross-browser gate reports. Safari was not among them: the test harness can download that engine on this machine but cannot launch it, so nothing here is a claim about it. If a reading on your screen differs from one on this page, that is worth knowing about, and the lab rather than the page is the thing to believe.
Where the adiabatic process simulator is actually used
- Putting a number on a comparison a textbook leaves as an adjective
- Pages say an adiabat is steeper than an isotherm and stop there, which leaves a reader with no way to tell whether that means five per cent or five times. Load Air squeezed 8 to 1 and the two cards read 1.83792 MPa and 800.000 kPa, a factor of 2.29740 at the finish. That takes about two seconds and settles the question for whatever squeeze you care about.
- Showing that a slow squeeze cannot tell one gas from another
- This is the demonstration the three gas-model buttons exist for. Press them in turn under the opening preset and the adiabatic card reads 3.20000, 1.83792 and 1.60000 MPa while the isothermal card stays on 800.000 kPa throughout. Students who expect the molecule to matter in both cases usually need to see the second card refuse to move rather than be told it will.
- Sizing the temperature a compression ratio buys you before arguing about ignition
- Press Diesel compression 18 to 1 and the temperature card reads 931.534 K from a start of 293.15 K, with the pressure at 5.71981 MPa. None of that comes from a flame or a spark: it is the squeeze alone, and the isothermal card beside it shows what the same squeeze would have managed at constant temperature. Drag the ratio and watch how fast the temperature answers.
- Getting the direction right, which is where most mistakes are made
- Ask someone what happens to a gas let out with no heat coming in and a good fraction will say nothing, or will say it warms. Press Let it expand to twice the volume: the gold curve finishes below the blue one, the gas cools to 222.166 K, and the work heading changes to Work done by the gas. One button settles both halves of that, the sign and the size.
- Separating the two senses of “steeper” before quoting either
- The panel prints both on purpose, side by side. Steepness at the start is a gradient ratio where the curves share a point and reads 1.40000 whatever the squeeze; the multiple-of-Boyle chip is a pressure ratio at the finish and reads 2.29740 x at 8.00 to 1 but 3.17767 x at 18.0 to 1. Anyone about to write that an adiabat is 1.4 times steeper should read both chips first.
- Watching the two curves merge, so adiabatic and isothermal stop sounding like a switch
- Drag gamma to its bottom stop with the opening squeeze loaded and the two cards read 984.916 and 800.000 kPa, close enough that the curves are hard to separate by eye. The strip says so in words. The advantage is continuous in gamma and shrinks towards nothing rather than switching off, which no pair of static diagrams makes obvious.
- Setting up the next question, which is what a pair of these legs can do in a loop
- Once the gap between the two curves is a number, the obvious follow-up is what a machine built out of such legs can achieve. That is a different subject with its own tools: the guide to Carnot efficiency is where two adiabatic legs already do a job on this site, and the Boyle’s law calculator is where the gentler of the two curves can be worked on its own. Neither a cycle nor an efficiency appears on this panel.
Where to go next
Everything this panel assumes rather than shows is in Adiabatic Process Explained: the definition stated from the beginning, gamma derived from a count of degrees of freedom, the measured values beside the modelled ones, and seven problems worked through from their own figures. If typing suits you better than dragging, the calculator for the same relation heads the list below.
The two curves have pages of their own. The guide to the isothermal process is the blue one taken seriously, the guide to Boyle’s law is the same relation as a law in its own right, and the guide to the gas laws sets out the five pressure, volume and temperature relations together.
Further out, the guide to the first law of thermodynamics is the bookkeeping this panel is a special case of and the guide to the laws of thermodynamics is where that law sits among the four, while the guide to heat against temperature is worth reading before anyone calls this squeeze a heating. The rest is in the library of physics simulations, the calculator index and the blog.
Frequently asked questions
Why does the isothermal pressure card not move when I press Monatomic or Polyatomic?
Because an isotherm has no exponent to change. Press all three gas buttons under the opening preset and the adiabatic card reads 3.20000 MPa, 1.83792 MPa and 1.60000 MPa while Final pressure, isothermal holds at 800.000 kPa for every one of them. The isotherm does not know what the molecule is, and watching it refuse to move is what the three buttons are for.
The volume ratio slider steps in hundredths, so how does the lab open on 0.125?
The preset pins the exact value and then derives the thumb. That slider runs 0.05 to 2.00 in steps of 0.01, so its grid goes 0.12, 0.13 and never lands on 0.125; Air squeezed 8 to 1 pins 0.125 and puts the thumb at 0.13. Touch the slider and the pin drops: the ratio really is 0.13 from then on, and the card falls to 1.73972 MPa.
What is the difference between the steepness chip and the multiple-of-Boyle chip?
They are two different claims, which is why the panel prints both. Steepness at the start compares the two gradients where the curves share a point, and that ratio is gamma exactly. Adiabatic pressure, as a multiple of Boyle compares the two pressures at the final volume, and that ratio grows with the squeeze: 2.29740 at 8.00 to 1 and 3.17767 at 18.0 to 1.
Why does the work card never show a negative number?
Because a bare minus sign under an unlabelled heading tells you nothing. The card prints a magnitude and puts the direction in its own heading, so a compression reads Work done on the gas 7.90564 kJ and an expansion reads Work done by the gas 1.47548 kJ. The signed value exists only in the lab test hook, and no reading on the panel is ambiguous about which way the energy went.
Why is the slider the volume ratio rather than the compression ratio?
Because a linear compression-ratio slider has almost no resolution below one to one. From 0.05 to 2.00 the volume ratio gives even steps across a 20.0 to 1 squeeze and a doubling alike, which no single compression-ratio range manages. Nothing is hidden by the choice: the grid cell prints both forms at once, for example V2/V1 = 0.125 - a compression of 8.00 to 1.
The adiabatic pressure card switched from kPa to MPa. What are its limits in this lab?
The card picks its unit from the rounded figure, and the three sliders between them fix how far it can go. The smallest reading the controls can reach is 30.7786 kPa, at a gamma of 1.70 with the volume doubled, and the largest is 16.2836 MPa, at the same gamma with the volume ratio at 0.05. Its pascal range is never reached, so no reading here is in pascals.
Why does the starting temperature move the volume axis but not the final pressure?
Because the pressure relation is a ratio and the starting volume is not. Drag the temperature from 100 K to 1000 K and the adiabatic card stays on 1.83792 MPa to the last digit while Final temperature, adiabatic runs from 229.740 K to 2297.40 K. The volume axis moves because the lab computes the starting volume from the temperature, so the whole picture is drawn ten times wider.
Does the drawing shade the area under either curve?
No, and deliberately not. What is drawn is two open curves on one pair of axes, one marked start point, two end dots at the chosen final volume and a dashed guide from each dot out to the pressure axis. Nothing is shaded, nothing is filled, there is no closed loop, no piston and no molecules. The lab on the isothermal process is the one with a shaded area in it.
References & formula source
- Every figure on this panel comes out of two exact constants and three slider positions, and nothing is fitted. The Boltzmann constant is 1.380649e-23 J/K and the Avogadro constant is 6.02214076e23 per mole, both exact by the 2019 definitions of the SI units; the lab prints the first of them on itself and computes the molar gas constant from the pair rather than typing it, which is why its 8.314 agrees with the figure our own gas pages already publish. That constant enters this lab only through the starting volume and therefore through the work: the two pressure cards and the temperature card are ratios and are free of it.
- The relation the gold curve obeys is the definition of a reversible adiabatic process rather than a measurement, and the wording is the Wikipedia article on the adiabatic process, retrieved for this cluster on 2026-10-14, which gives it as pressure times volume to the power gamma held constant, with gamma the ratio of the two heat capacities. The same article gives the two rewritten forms this panel uses for its temperature card, and states that the reversible case is also called isentropic. The three gas models here, with gamma at five thirds, seven fifths and four thirds, are that article's own values for a monatomic and a diatomic gas and the same counting argument carried to six degrees of freedom.
- Gamma is treated as a constant by these three sliders and it is not one. The Wikipedia article on the heat capacity ratio, retrieved for this cluster on the same date, measures dry air at 1.404 at minus 15 degrees Celsius, 1.400 at 20 degrees and 1.365 at 1000 degrees, a drift of 0.039 across that span. That table is where the drift figure in the breaks-down section above was taken from, and the limits it puts on a reading from this panel are set out there rather than here.
- The opening state is one mole of dry air at 100 kPa and 293.15 K, and 20 degrees Celsius rather than 300 K is chosen because the measured gamma of 1.400 for dry air is quoted at that temperature in the source table. 100 kPa rather than one standard atmosphere is the reference pressure this site standardises on across its gas tools, so this panel cannot disagree with the others on a headline figure. The arithmetic behind the gold curve was checked independently against the worked example on the Wikipedia article itself, a ten-to-one squeeze of air at a gamma of seven fifths, and the two agree at 25.1 bar.
- The work shown is the work of the process the gold curve describes, and it is computed two ways that share no step: from the two pressure-volume products, and from the two temperatures. Across 280 states those two routes agree to within two parts in a hundred million million, which is why the panel prints one work card rather than a pair that could never disagree. The card reports a magnitude and names its direction in its own heading, so a reading of 7.90564 kJ under the heading Work done on the gas and a reading of 1.47548 kJ under Work done by the gas are opposite signs of the same quantity.
- What this panel will not tell you is as deliberate as what it will. It computes no entropy, no efficiency, no heat capacity for any named gas, no polytropic index other than gamma, no real-gas or van der Waals correction and no speed of sound, and it shades no area under either curve, because an area under a pressure-volume curve is the neighbouring lab's picture and a closed loop is a third page's subject. No history is claimed here either: no person, no date and no priority.
- Every readout figure quoted on this page is a string this simulation printed for the button or the slider position named beside it, read back out of the running lab in a browser rather than worked out by hand. Each is computed from the exact value and rounded once, so re-deriving one printed figure from another will not always reproduce the last digit, and the fractional-rate figures in the physics section are a worked case of exactly that. The five figures here that are not readouts say so where they appear. Where a figure here and the lab part company, believe the lab, and verify anything you rely on before quoting it.
- Further reading: Adiabatic process — Wikipedia