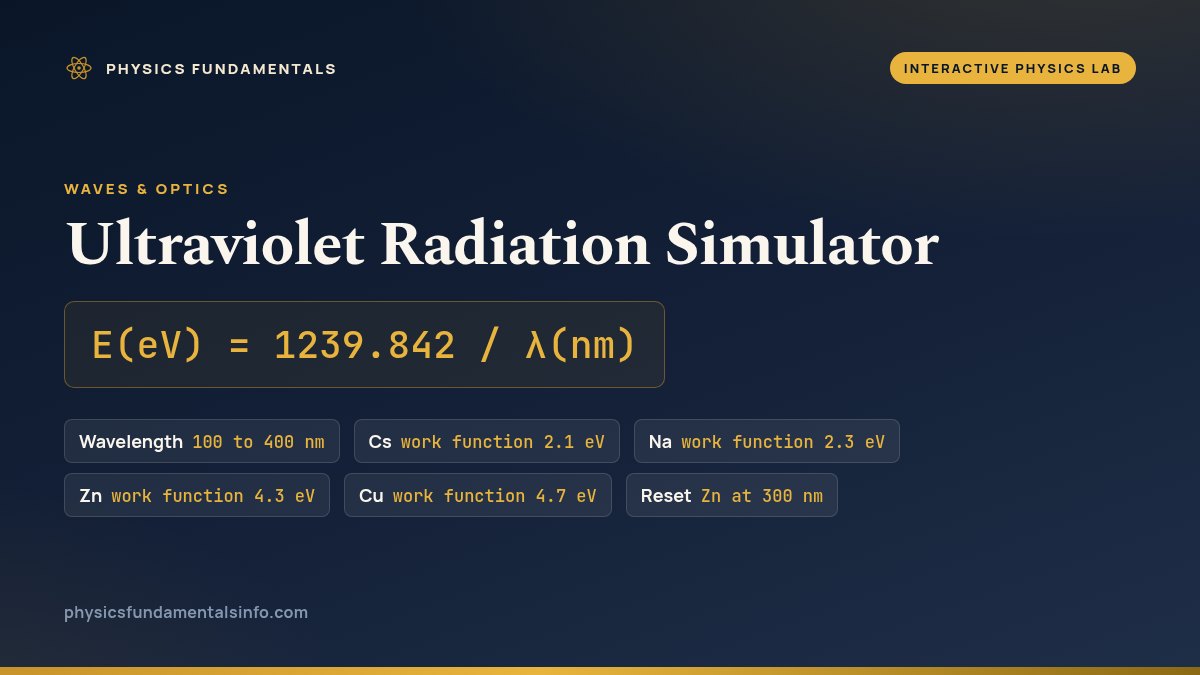
The ultraviolet radiation simulator is a free interactive lab built around one relation, E = hc / lambda with hc = 1239.842 eV·nm, and around what that energy then turns out to be enough for. Drag a single wavelength across the whole ultraviolet range, 100 to 400 nm, and three things move together: the energy one photon carries, which of the three conventional bands it lands in, and whether it can strip an electron from caesium, sodium, zinc or copper. Ten readouts answer, headed by the Photoelectron card, which holds at No electron until the wavelength crosses the chosen metal’s threshold and then prints a Kmax.
Ultraviolet Radiation
Slide one wavelength from 100 to 400 nm and three things move together: the photon's energy, which of the three UV bands the WHO convention puts it in, and whether it carries enough to free an electron from the metal you pick. The headline is a threshold: at 300 nm zinc holds on, at 288.3 nm it lets go, and no visible photon — 3.100 eV at most — will ever do it. E = hc / lambda, with hc = 1239.842 eV·nm.
Load a real UV source onto the slider
Each button presses one of the lab’s own four metal buttons and then writes the wavelength slider. Those two together are the entire state, so a load never inherits anything from the last one. Work down the list in order: the first three walk zinc through its threshold, and the last three change the metal underneath a photon that does not move.
Pick a source above, or drag the slider and press the four metal buttons yourself.
What Is the Ultraviolet Radiation Simulator?
The ultraviolet radiation simulator is a free interactive physics lab that runs in your browser, with nothing to install and no sign-up. It slides one wavelength across the whole ultraviolet range, 100 to 400 nm, and shows three things moving together: the energy one photon of that light carries, which of the three conventional UV bands it falls in, and whether it is enough to free an electron from a chosen metal. The last of those is a threshold rather than a slope, and the lab is built to make that visible.
One shared horizontal scale carries the drawing: wavelength in nanometres, 100 nm at the left edge and 400 nm at the right, with nothing placed anywhere that scale did not put it. The strip above it is filled as three bands with dividing rules at 280 and 315 nm, a pointer carries a label such as 300.0 nm · 4.133 eV, and the chosen metal’s threshold is a dashed rule with everything shorter than it shaded as the region that frees an electron. A second row of labels puts electronvolts on that same axis at deliberately uneven spacing, because energy goes as one over the wavelength, and the caption says so rather than leaving it to be noticed.
The controls are few. One slider runs 100 to 400 nm in steps of 0.1, four buttons choose caesium, sodium, zinc or copper, and Reset returns zinc at 300 nm. Ten readouts answer: four cards give the photon energy, the UV band, the photoelectron verdict and what the atmosphere does with that band, and six compact cells add the wavelength, the energy in joules, the frequency, the energy per mole, the metal with its work function, and the longest wavelength that still works on it.
Two things the lab reports are quoted rather than calculated, and it says so. The band boundaries are a convention agreed by committee, not a physical edge: nothing in the arithmetic changes at 315.0 nm. What the atmosphere does with each band is the World Health Organization summary, and the fourth verdict, Outside the WHO UV range, is what the lab prints rather than inventing a claim for a wavelength outside 100 to 400 nm.
The lab also carries the qualification this topic usually drops: hydrogen needs 13.6 eV to ionise, a photon of 91.1649 nm, which is shorter than the 100 nm edge of the range, so the shortest ultraviolet here reaches only 91.16 per cent of the way.
| Control | What it sets | Step or default |
|---|---|---|
| Wavelength | 100 to 400 nm | steps of 0.1 nm |
| Cs | work function 2.1 eV | one button |
| Na | work function 2.3 eV | one button |
| Zn | work function 4.3 eV | the default |
| Cu | work function 4.7 eV | one button |
| Reset | Zn at 300 nm | one button |
How to use the ultraviolet radiation simulator
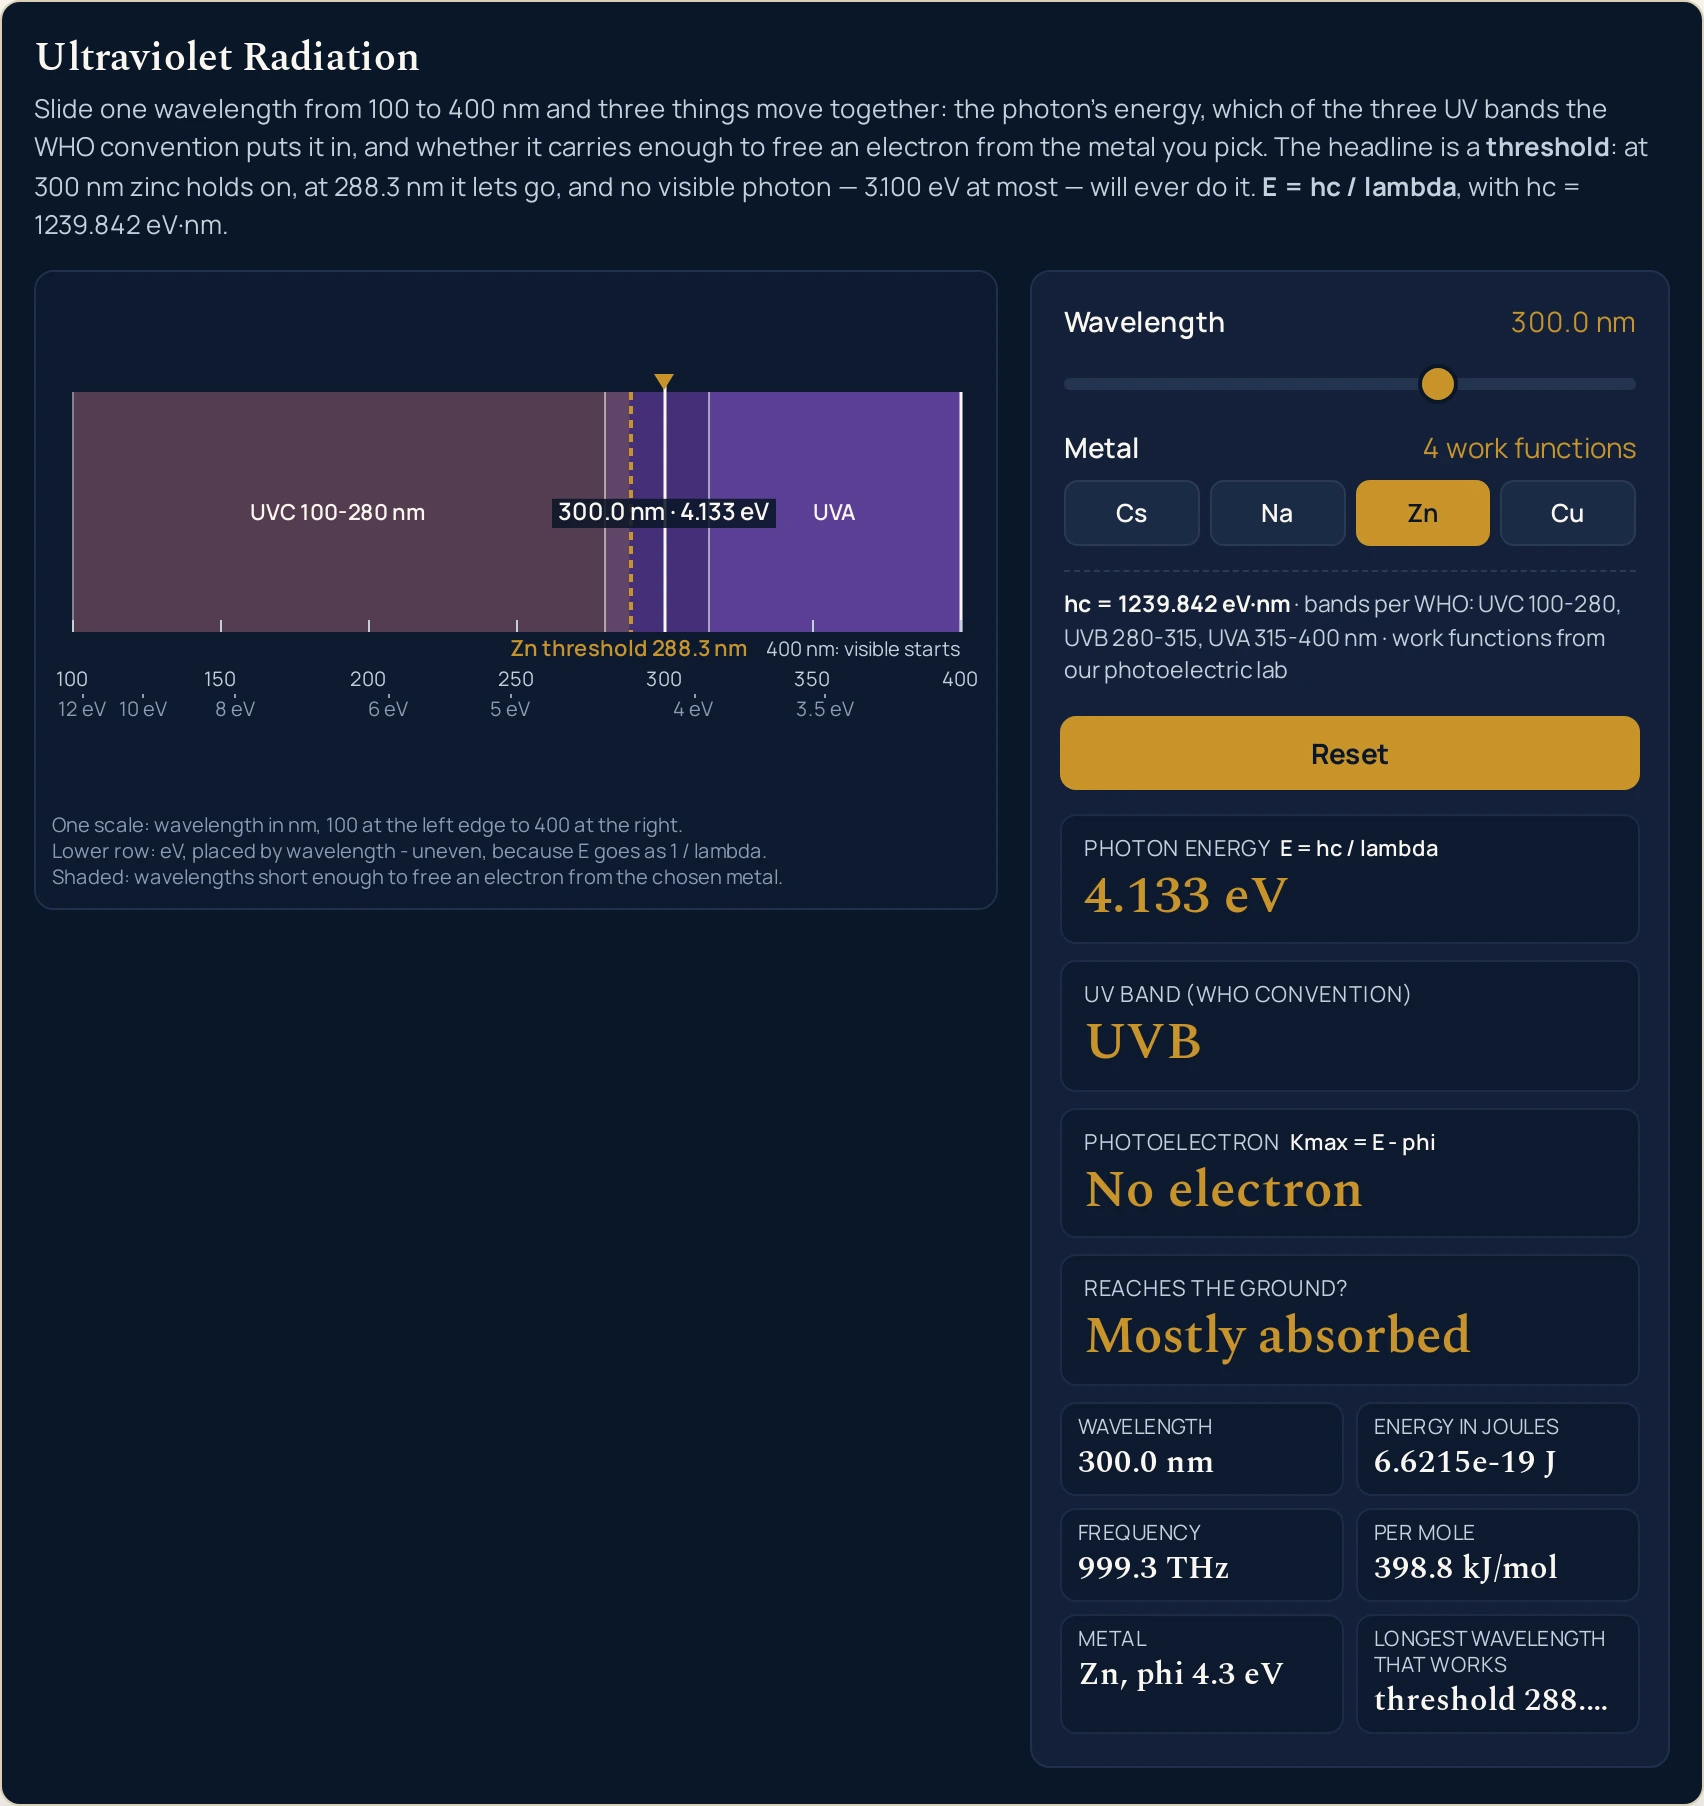
- Read the panel before you touch it. The lab boots at rest on zinc at 300 nm, so every reading is already on screen: Photon energy 4.133 eV, UV band UVB, Photoelectron No electron and Reaches the ground? Mostly absorbed. Nothing is animating, and nothing needs a click to appear.
- Find that state in the drawing. The pointer stands a little right of centre carrying the label 300.0 nm · 4.133 eV, inside the middle band of the strip. The dashed rule just to its left is labelled Zn threshold 288.3 nm, and everything shorter than that rule is shaded. The pointer is on the unshaded side, which is the picture saying the same thing the card does.
- Drag the wavelength down towards 288 nm and watch one card only. The slider runs 100 to 400 in steps of 0.1. Photon energy climbs smoothly the whole way, but Photoelectron does nothing at all until the pointer reaches the dashed rule, and then it changes in a single step. There is no gradual onset to watch for, because there is not one.
- Stop on 288.3 nm. The card reads Kmax 0.0005272 eV: an electron freed with five ten-thousandths of an electronvolt to its name. One step back at 288.4 nm it reads No electron; one step further at 288.2 nm it reads Kmax 0.002019 eV. Three consecutive stops of the slider hold the whole of the threshold.
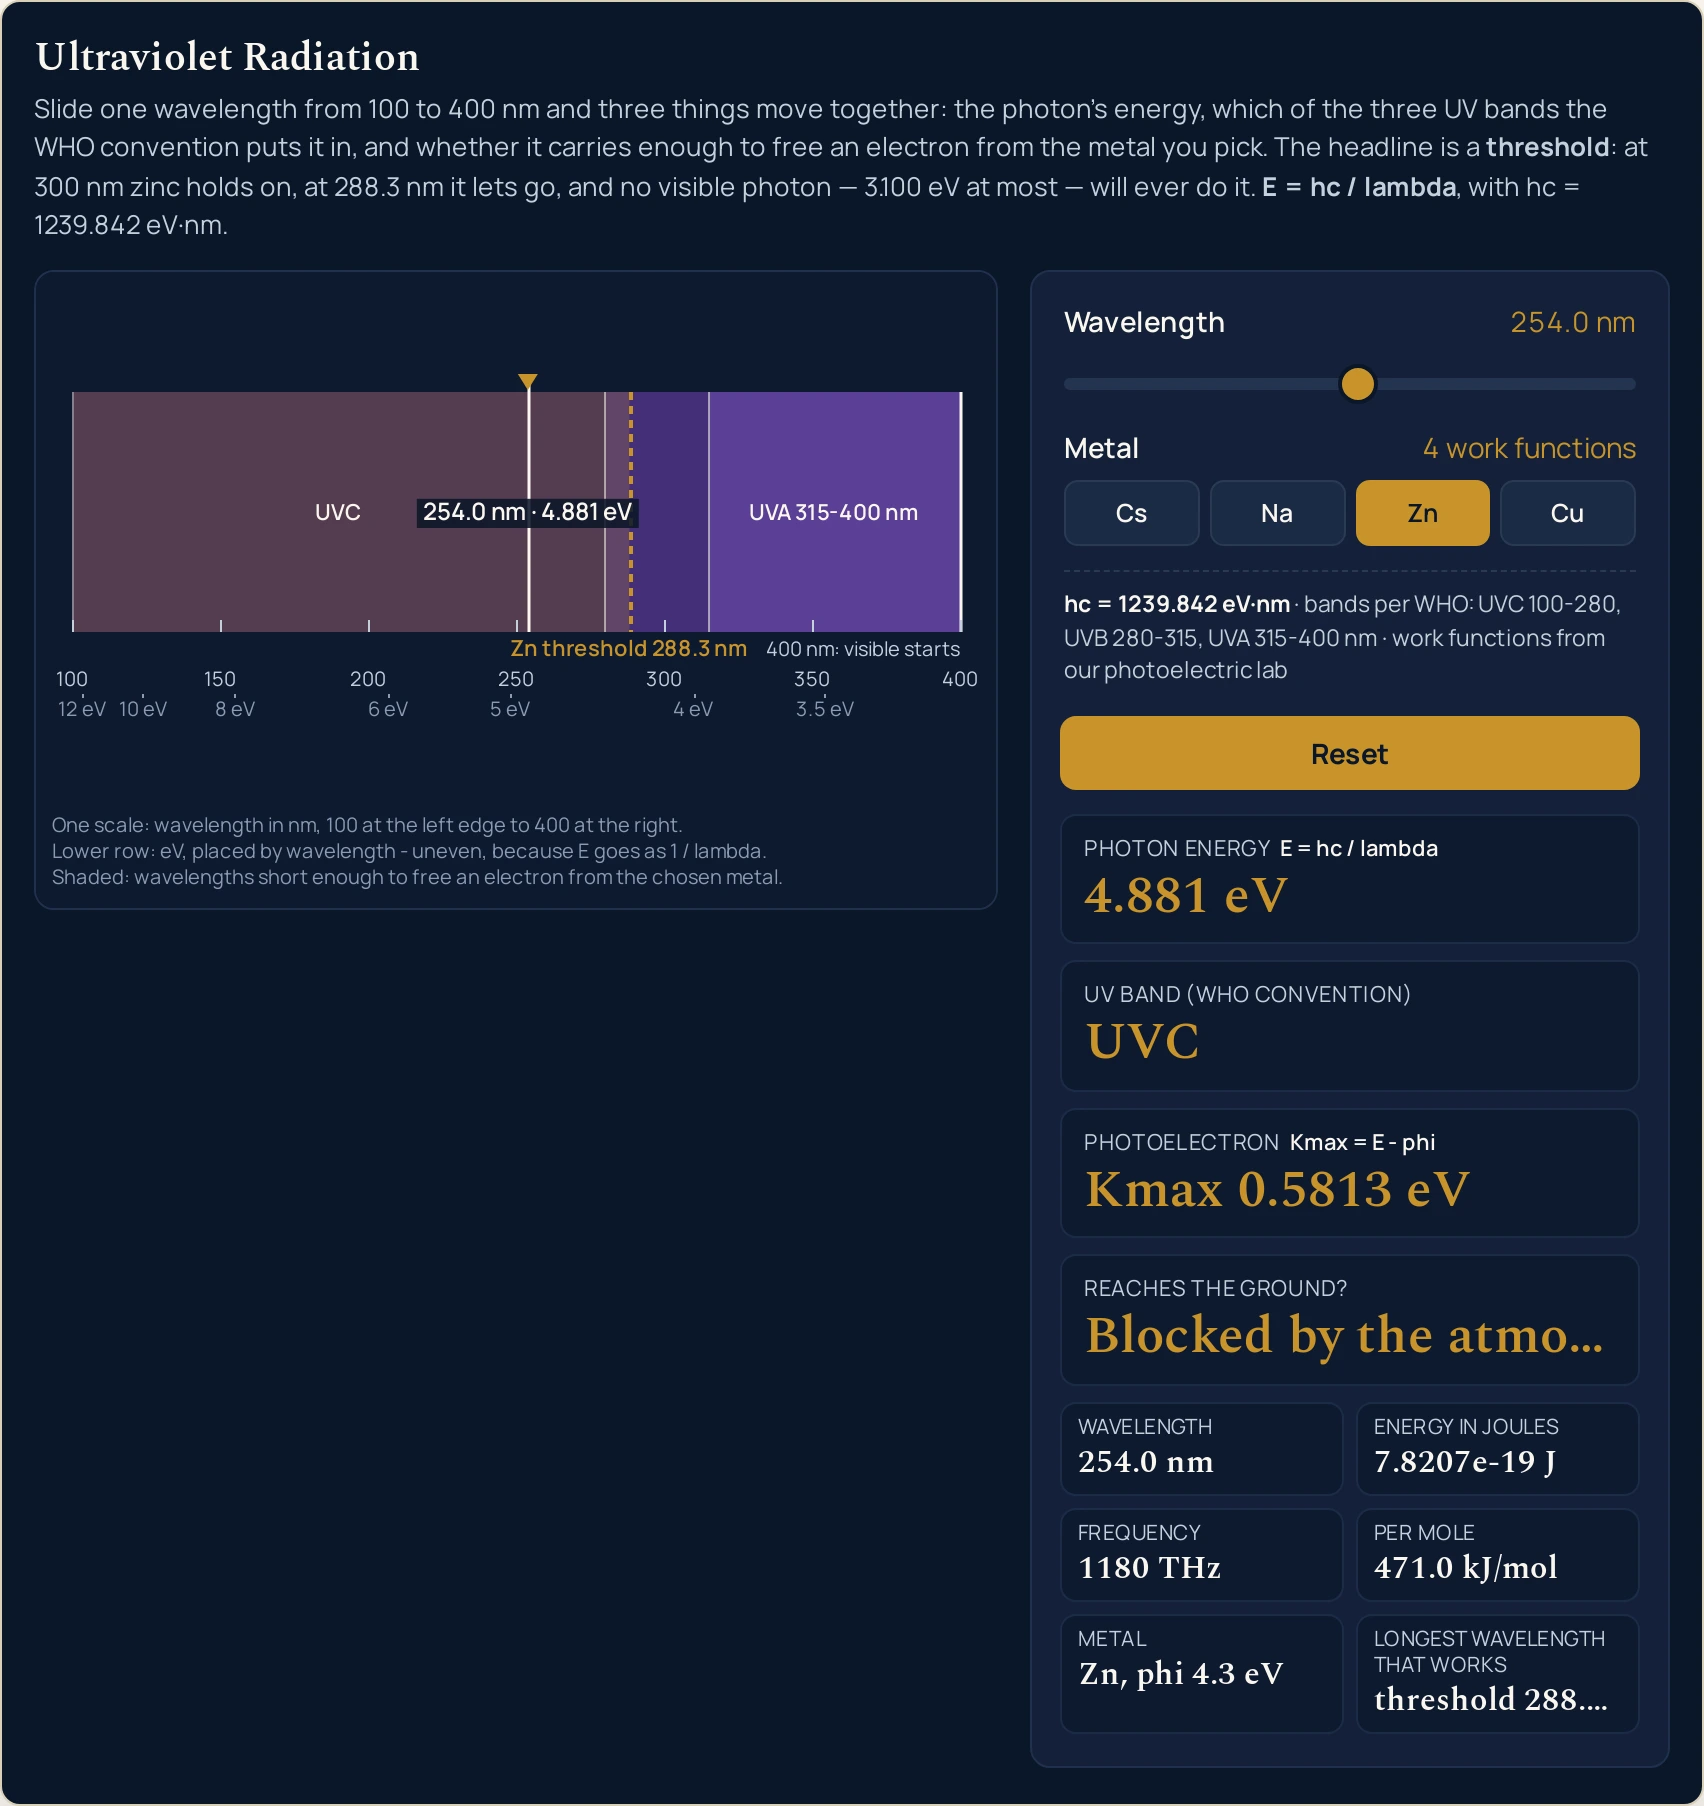
- Carry on to 254 nm, the germicidal line. UV band turns to UVC as the pointer crosses the first dividing rule, Reaches the ground? turns to Blocked by the atmosphere with it, and Photoelectron now reads Kmax 0.5813 eV. Those two cards always move together, because one is chosen entirely by the other.
- Now change metal and leave the slider alone. This is the step the lab is built for. Press Cs, Na and Cu in turn with the slider still on 300.0 nm: three readouts move — Photoelectron, Metal and Longest wavelength that works — and the other seven refuse. Photon energy holds at 4.133 eV on all four buttons.
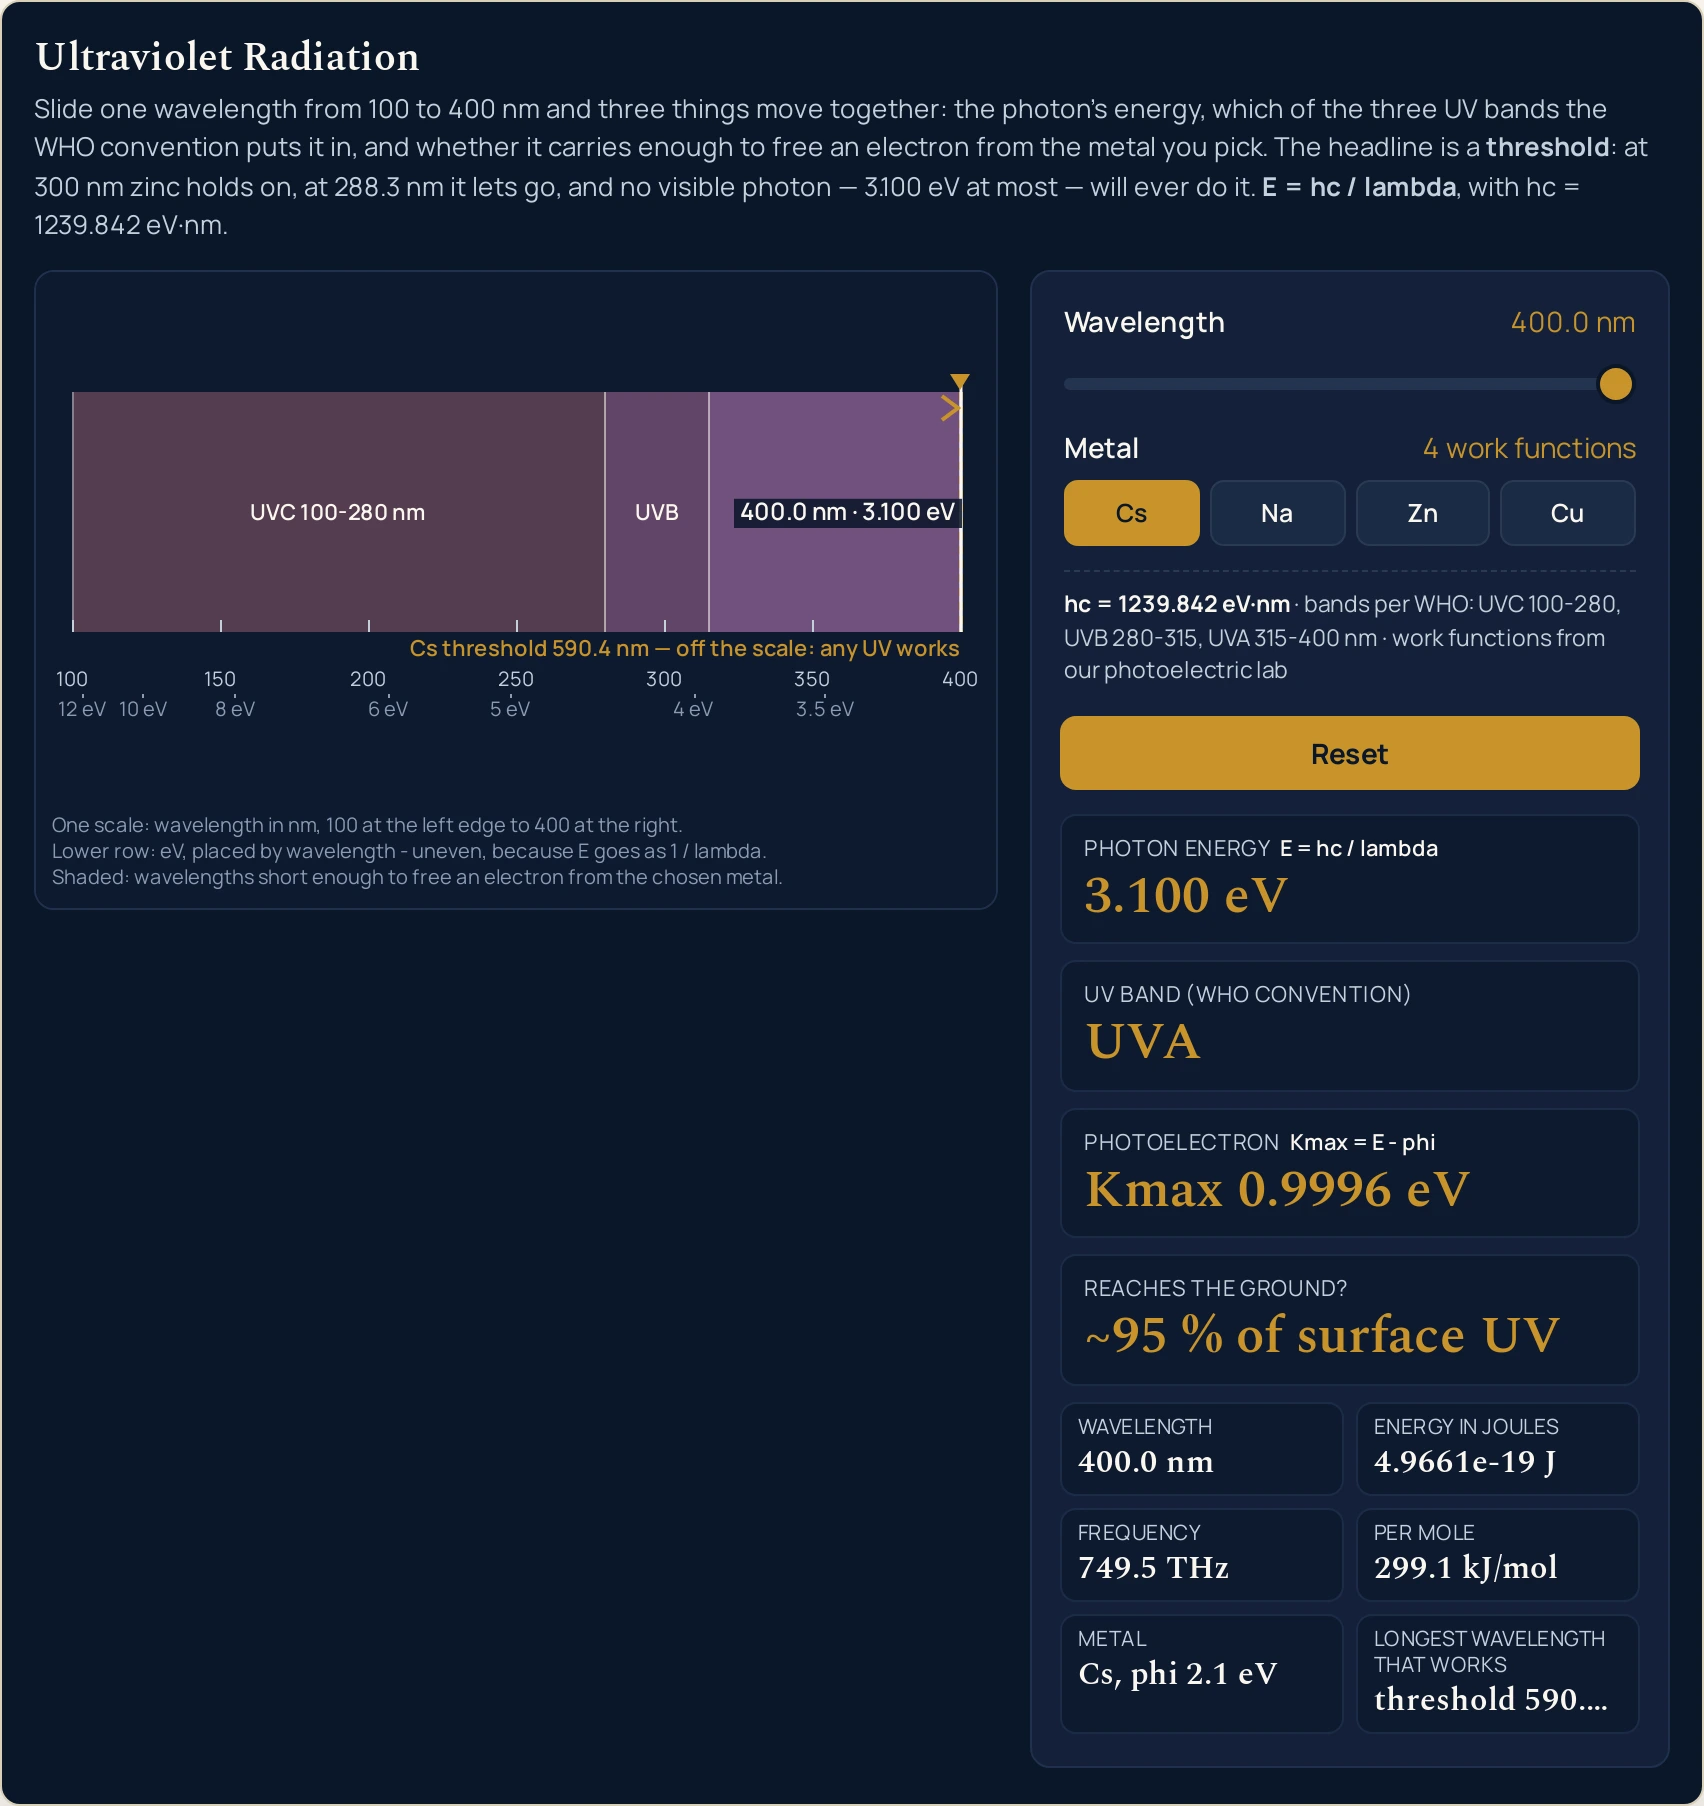
- Press Cs and look at the right-hand edge of the drawing. Caesium’s threshold cell reads threshold 590.4 nm, which is past the end of the axis, so there is no dashed rule to draw. The lab puts a chevron at the edge instead, shades the entire strip, and writes Cs threshold 590.4 nm — off the scale: any UV works. Sodium behaves the same way at threshold 539.1 nm.
- Read the six compact cells when you need the same photon in other units. They give Wavelength, Energy in joules, Frequency, Per mole, Metal and Longest wavelength that works. At the boot state those run 300.0 nm, 6.6215e-19 J, 999.3 THz, 398.8 kJ/mol, Zn, phi 4.3 eV and threshold 288.3 nm.
- Read the two label rows under the strip as one scale, not two. The upper row is nanometres at even intervals; the lower row is electronvolts placed by wavelength through the identical map, which is why 10 eV and 12 eV crowd the left edge while 3.5 eV and 4 eV spread out at the right. The caption states that in words rather than leaving it to be spotted.
- Press Reset when you have lost track. It puts Zn back under the slider, returns the wavelength to 300 nm and replays the settle, so the pointer and the threshold rule slide back into place rather than jumping. Exactly one metal button carries the pressed state at any moment, and after a reset it is zinc’s.
- Read the fixed line last of all. It says hc = 1239.842 eV·nm · bands per WHO: UVC 100-280, UVB 280-315, UVA 315-400 nm · work functions from our photoelectric lab. That is the whole of what the panel assumes, in one line, and it is worth copying alongside any figure you take from here.
The step worth repeating is the sixth one. Load UVB, just above zinc’s threshold and then press Na without touching the slider. The Photoelectron card goes from No electron to Kmax 1.833 eV while the Photon energy card does not move off 4.133 eV. Nothing about the light has changed; only what it happens to be pointed at has.
If typing suits you better than dragging — or if you want the relation run backwards, so that a work function or a quoted energy gives back the wavelength that produces it — that is the job of the ultraviolet radiation calculator, which also takes angstroms and micrometres this slider has no menu for. For what the three bands are, which of them reaches the ground and seven problems worked end to end, read the full guide to ultraviolet radiation.
Worked example: change one thing at a time
Every row below is one metal button and one slider position, and every cell is a string the running lab printed there. The ten settings are the ones this cluster publishes, so they are also the ones the lab’s own tests pin. Where a cell and the lab ever part company, believe the lab.
| Setting | Photon energy | UV band | Photoelectron | Reaches the ground | Per mole |
|---|---|---|---|---|---|
| Zn at 300.0 nm | 4.133 eV | UVB | No electron | Mostly absorbed | 398.8 kJ/mol |
| Zn at 288.3 nm | 4.301 eV | UVB | Kmax 0.0005272 eV | Mostly absorbed | 414.9 kJ/mol |
| Zn at 254.0 nm | 4.881 eV | UVC | Kmax 0.5813 eV | Blocked by the atmosphere | 471.0 kJ/mol |
| Zn at 365.0 nm | 3.397 eV | UVA | No electron | ~95 % of surface UV | 327.7 kJ/mol |
| Zn at 400.0 nm | 3.100 eV | UVA | No electron | ~95 % of surface UV | 299.1 kJ/mol |
| Cu at 254.0 nm | 4.881 eV | UVC | Kmax 0.1813 eV | Blocked by the atmosphere | 471.0 kJ/mol |
| Cu at 280.0 nm | 4.428 eV | UVB | No electron | Mostly absorbed | 427.2 kJ/mol |
| Na at 300.0 nm | 4.133 eV | UVB | Kmax 1.833 eV | Mostly absorbed | 398.8 kJ/mol |
| Cs at 400.0 nm | 3.100 eV | UVA | Kmax 0.9996 eV | ~95 % of surface UV | 299.1 kJ/mol |
| Zn at 100.0 nm | 12.40 eV | UVC | Kmax 8.098 eV | Blocked by the atmosphere | 1196.3 kJ/mol |
Rows 1 to 5 are one metal and one slider. Zinc is pressed down all five, so only the pointer moves. They are not in wavelength order, so the energy column does not simply run downhill; what holds between any two rows is that the shorter setting carries the larger energy, which makes row 3 at 254.0 nm the biggest of the five at 4.881 eV and row 5 at 400.0 nm the smallest at 3.100 eV. All four primary cards move down these five rows: the energy with every step, the band as the pointer crosses 315 and 280 nm, the ground verdict in step with it, and the photoelectron on the two rows inside zinc’s threshold at 288.34 nm, Kmax 0.0005272 eV at 288.3 nm and Kmax 0.5813 eV at 254.0 nm. Only two of the six compact cells sit still, the two that describe the metal rather than the photon — Metal (Zn, phi 4.3 eV) and Longest wavelength that works (threshold 288.3 nm) — because zinc is pressed the whole way.
Rows 3 and 6 are the same photon on two different metals. Both read 4.881 eV, UVC and 471.0 kJ/mol, and the only cell that differs is the Photoelectron card: Kmax 0.5813 eV on zinc against Kmax 0.1813 eV on copper. The difference between those two figures is the difference between the two work functions, which the guide to the photoelectric effect sets out properly. This lab only asks the yes-or-no question.
Row 9 is the row nobody predicts. Caesium at 400.0 nm reads Kmax 0.9996 eV, and the band cell beside it still says UVA — the slider’s far stop is the long edge of the WHO range and about where human vision gives out, both at once. So the effect this lab is about is not an ultraviolet effect in general. It becomes one the moment the metal is ordinary, which is rows 1 and 7.
The threshold, one step of the slider at a time
Park the pointer on the dashed rule and walk it across in tenths of a nanometre. The whole of the transition fits in the table below, on both of the metals whose threshold is actually on the axis.
| Setting | Photon energy | Photoelectron | Longest wavelength that works | Per mole |
|---|---|---|---|---|
| Zn at 288.2 nm | 4.302 eV | Kmax 0.002019 eV | threshold 288.3 nm | 415.1 kJ/mol |
| Zn at 288.3 nm | 4.301 eV | Kmax 0.0005272 eV | threshold 288.3 nm | 414.9 kJ/mol |
| Zn at 288.4 nm | 4.299 eV | No electron | threshold 288.3 nm | 414.8 kJ/mol |
| Cu at 263.7 nm | 4.702 eV | Kmax 0.001714 eV | threshold 263.8 nm | 453.6 kJ/mol |
| Cu at 263.8 nm | 4.700 eV | No electron | threshold 263.8 nm | 453.5 kJ/mol |
The two metals behave differently at the stop that prints their own threshold, and that is correct. Zinc’s exact threshold is 288.34 nm, so the 288.3 stop is just inside it and still ejects. Copper’s is 263.80 nm, so the 263.8 stop is just outside it and does not. The cell rounds to a tenth for display; the verdict is decided on the unrounded figure, and the panel will not round towards the edge to make the two agree.
One photon, four metals
Leave the slider on 300.0 nm and press all four buttons in turn. The first three columns below are the invariance test: they are properties of the light, and no button can touch them.
| Setting | Photon energy | UV band | Reaches the ground | Metal | Photoelectron | Longest wavelength that works |
|---|---|---|---|---|---|---|
| Cs at 300.0 nm | 4.133 eV | UVB | Mostly absorbed | Cs, phi 2.1 eV | Kmax 2.033 eV | threshold 590.4 nm |
| Na at 300.0 nm | 4.133 eV | UVB | Mostly absorbed | Na, phi 2.3 eV | Kmax 1.833 eV | threshold 539.1 nm |
| Zn at 300.0 nm | 4.133 eV | UVB | Mostly absorbed | Zn, phi 4.3 eV | No electron | threshold 288.3 nm |
| Cu at 300.0 nm | 4.133 eV | UVB | Mostly absorbed | Cu, phi 4.7 eV | No electron | threshold 263.8 nm |
Read the last column against the fourth. The threshold cell falls from 590.4 to 263.8 nm as the work function climbs from 2.1 to 4.7 eV, and the Photoelectron card flips exactly where that cell crosses the 300.0 nm the slider is holding. Caesium and sodium clear it comfortably; zinc and copper do not clear it at all.
The two band divisions, a tenth of a nanometre either side
The dividing rules in the strip sit at 280 and 315 nm, and each band owns its short edge rather than its long one. Drive the slider across both and the atmospheric card moves with the band and never on its own.
| Setting | Photon energy | UV band | Reaches the ground | Energy in joules | Frequency |
|---|---|---|---|---|---|
| Zn at 279.9 nm | 4.430 eV | UVC | Blocked by the atmosphere | 7.0970e-19 J | 1071 THz |
| Zn at 280.0 nm | 4.428 eV | UVB | Mostly absorbed | 7.0944e-19 J | 1071 THz |
| Zn at 314.9 nm | 3.937 eV | UVB | Mostly absorbed | 6.3082e-19 J | 952.0 THz |
| Zn at 315.0 nm | 3.936 eV | UVA | ~95 % of surface UV | 6.3062e-19 J | 951.7 THz |
Look at what moves across those two pairs of rows and what does not. The band string and the atmospheric verdict change outright at both divisions, while the arithmetic barely stirs: over the 280 nm step the energy goes 4.430 to 4.428 eV and the frequency cell prints 1071 THz at either stop, and over the 315 nm step it goes 3.937 to 3.936 eV while the frequency slips three tenths of a terahertz, 952.0 to 951.7 THz. Either way that is a convention being crossed rather than a physical edge, and the table is the plainest way this page knows to demonstrate it.
Formula and symbol reference
The panel prints its two relations on itself, inside the labels of the cards they feed. E = hc / lambda sits above the Photon energy card and Kmax = E - phi sits above the Photoelectron card, so neither answer arrives without the rule that produced it. Neither is derived here.
The first of the two is the one everything on the page runs through, and the useful form of it divides by the elementary charge and measures the wavelength in nanometres: energy in electronvolts is 1239.842 divided by the wavelength in nanometres. Multiply the Photon energy card by the Wavelength cell at any stop and you get that constant back, which is the quickest check there is on a figure from anywhere. Why the Planck constant is in it at all belongs to the guide to the photon energy formula, not here.
The second relation is used once, for a verdict rather than for a number: subtract the work function from the photon energy, and if what is left is positive the card prints it. The lab does not go on to say how many electrons, how fast they arrive or what a brighter lamp would do. The table below is where to look up what each symbol means and the range this lab moves it over.
| Symbol | Meaning | SI unit | In this lab |
|---|---|---|---|
| lambda | Wavelength of the light, and the one thing the slider moves. It is also the horizontal axis of the whole drawing, so every mark on the canvas is placed through it | metre (the slider is in nanometres) | 100 to 400 in steps of 0.1, printed to one decimal beside the slider and again in the grid: “100.0 nm”, “288.3 nm”, “400.0 nm”. |
| E | Energy carried by one photon, on the Photon energy card. The card’s own label prints the relation it applies | joule (the card is in electronvolts) | four significant figures, falling the whole width of the slider: “12.40 eV” at the 100 nm stop down to “3.100 eV” at 400 nm. |
| E in joules | The same energy without the electronvolt, in the Energy in joules cell. This is the figure that matches the contract table row for row | joule | a four-decimal mantissa: “1.9864e-18 J” at 100 nm, “6.6215e-19 J” on the shipped default, “4.9661e-19 J” at 400 nm. |
| f | Frequency of the same light, in the Frequency cell. It carries no information the wavelength does not | hertz (the cell is in terahertz) | four significant figures: “2998 THz” at 100 nm, “999.3 THz” at 300 nm and “749.5 THz” at 400 nm. |
| hc | The Planck constant times the speed of light, divided by the elementary charge. The fixed line under the buttons prints it rather than hiding it | electronvolt nanometre | a constant: 1239.842, which is this cluster’s contract figure and already the value the Bohr and Schrodinger labs on this site use. |
| phi | Work function of the chosen metal: the least energy that frees one electron from its surface. The Metal cell prints it beside the symbol | electronvolt | four buttons and nothing typed: “Cs, phi 2.1 eV”, “Na, phi 2.3 eV”, “Zn, phi 4.3 eV” (the default) and “Cu, phi 4.7 eV”. |
| Kmax | Most kinetic energy a freed electron can leave with, on the Photoelectron card — or the words No electron when the photon cannot do it at all | joule (the card is in electronvolts) | four significant figures: “Kmax 0.0005272 eV” at zinc’s edge, up to “Kmax 10.30 eV” for caesium at the 100 nm stop. |
| threshold | Longest wavelength that still works on the chosen metal, in the Longest wavelength that works cell. It ignores the slider entirely | metre (the cell is in nanometres) | four values, one per button: “threshold 590.4 nm”, “threshold 539.1 nm”, “threshold 288.3 nm” and “threshold 263.8 nm”. Only the last two are on the axis. |
The row worth reading twice is the energy in joules. It carries a four-decimal mantissa rather than the four significant figures the headline card uses, and that is not decoration: at that precision every ultraviolet row here reproduces this cluster’s contract table exactly, and dropping a digit would make two figures on the same screen disagree.
The physics: why a threshold, not a slope
Everything on the left of the screen comes out of one linear map. Wavelength goes to a horizontal position, 100 nm at the left edge and 400 at the right, and nothing is drawn anywhere that map did not put it: not the band rules, not the pointer, not the threshold, not either row of labels. That single decision is what makes the picture arguable rather than decorative.
The band strip is the easy half of it. Two rules at fixed positions cut the strip into three, the pointer moves between them, and a reader can see at a glance how lopsided the division is — UVC is 180 nm wide and UVB only 35. The electromagnetic spectrum simulator does the same job for the whole spectrum, and the electromagnetic spectrum guide is where the other bands are handled; infrared simply sits on the long-wavelength side of visible, in the other direction from here.
The threshold is the hard half, and it is why the drawing shades rather than colours. Every wavelength shorter than the dashed rule frees an electron and every wavelength longer than it frees none, with nothing in between and no dependence on how bright the source is. A shaded region says that better than a gradient would, because a gradient would be a lie about a quantity that has no gradient.
Watch the panel and the picture disagree about precision and you learn something about both. The threshold cell prints threshold 288.3 nm and the drawn label repeats it, but the rule is placed from the unrounded 288.34 nm, which is why the 288.3 stop sits a hair on the ejecting side of a rule it appears to be standing on. A rounded figure is never the thing a drawing is built from.
The second label row is the honest part of the scene, and it is honest by being awkward. There is one scale here, labelled twice: nanometres evenly, electronvolts by whatever wavelength each energy corresponds to. So 12 eV sits almost on the left edge, 6 eV is about a third of the way across, and 4 eV and 3.5 eV are strung out across the right-hand third. Nothing has been rescaled; the energies really are bunched like that.
Narrow the browser and the drawing gives things up in a fixed order rather than shrinking everything. The electronvolt row goes first, at a canvas under 380 px, and the caption loses its electronvolt line at the same moment so the strip never describes a row that is not there. The nanometre ticks then thin from seven rungs to four, keeping both ends of the axis, and the band names shorten from UVC 100-280 nm to UVC before they go.
The pointer label is the last thing standing, at every width tested, down to a canvas of 164 px inside an article column. That ordering is deliberate: the band name is redundant, because the number beside the pointer says which band it is in for anyone who has read the fixed line. When the pointer label would collide with a band name, it is the band name that gives way.
Where the ultraviolet radiation simulator breaks down
The lab solves its own model exactly, so nothing on the screen ever fails. Everything below is a limit of that model, of the slider grid, or of what a quoted summary and a 300 nm-wide axis can carry, and each item says what this lab does about it.
- The two rules in the strip are a committee’s lines, not edges in the physics
- Nothing in the arithmetic jumps as the pointer crosses 315.0 nm. The table above proves it on the lab’s own output: the printed energy moves by one thousandth of an electronvolt across that step, 3.937 to 3.936 eV, while the band string changes completely. The divisions are drawn because they are the language the subject is written in, and because the absorption they stand for really does vary across the range — but it varies smoothly, and another body could have put the rules a few nanometres away.
- The ground card is a quoted verdict, not a transmission calculation
- Real atmospheric transmission is a smooth function of wavelength that depends on the ozone column overhead, the altitude, the solar angle and the cloud. This panel reduces it to four fixed strings chosen by the band, taken from the World Health Organization’s own summary. Treat them as the shape of the answer rather than as a figure, and note that no dose, no ultraviolet index and no surface irradiance is printed anywhere in the lab.
- A work function belongs to a surface, not to an element
- The 4.3 eV behind the Zn button is a textbook figure for a clean surface, and a real one is not clean. Oxidation, adsorbed gas, crystal face and polishing all move it, and the threshold cell moves with it: a work function a tenth of an electronvolt higher pulls zinc’s threshold several nanometres shorter and takes the dashed rule with it. What the buttons carry came from the photoelectric lab already on this site, so that no two pages in this cluster can quote a different figure for zinc. None of the four describes a specimen anyone has put in front of a lamp.
- One photon, one electron — and not a word about brightness
- The Photoelectron card answers a single-photon question and nothing else: is one photon of this energy enough? It says nothing about how many electrons come out, how fast they arrive, or what a stronger lamp would do. A source below the threshold ejects nothing however bright it is, which is exactly why the card can be a threshold at all, and why this lab carries no wattage, no irradiance and no exposure time.
- Ultraviolet is not ionising radiation at these energies
- Drag the slider to its 100 nm stop, the most energetic setting the lab has, and the card reads 12.40 eV. Hydrogen needs 13.6 eV, a photon of 91.1649 nm, which is off the short end of this slider — that is the figure the Bohr model calculator publishes. So every wavelength this lab calls ultraviolet sits below the hydrogen ionisation threshold, at 91.16 per cent of the way at best. Breaking a chemical bond is a different and much lower bar, and it is described here in words only, because no bond-energy source was fetched for this cluster.
- The slider will not leave 100 to 400 nm, and neither will the picture
- The control is hard-limited to the World Health Organization range, so the two out-of-range band strings the lab can produce — Beyond UV (X-ray side) and Not UV (visible or longer) — are unreachable through the panel and are exercised only by the test hook. In both of those cases the ground card prints Outside the WHO UV range rather than borrowing a verdict, because WHO made no claim about a 700 nm photon and neither will this lab.
- Do not re-derive one readout from another
- Every figure is computed from the exact value and rounded once, so a chain of rounded figures need not close. The clearest case is the pair of rows at 279.9 and 280.0 nm, where the frequency cell prints 1071 THz at both: the strings are equal and the numbers underneath are not. Take each reading from the cell that publishes it rather than reconstructing it from its neighbour.
- Two of the four metals cannot be drawn on this axis at all
- Caesium and sodium have thresholds at 590.40 and 539.06 nm, well past the right-hand end of a 100 to 400 nm scale. Rather than compress the axis for them, the lab draws a chevron at the edge and states the figure in the label. The panel stays exact either way. Only the picture has an edge, and it says when it has reached it instead of drawing something it would have to squash.
- The slider cleans up after you, quietly
- Typing into the control rather than dragging it goes through the browser’s own sanitising, and the results are worth knowing. Written values snap onto the 0.1 grid, so 288.35 becomes 288.4; out-of-range values are clamped, so 401 becomes 400 and -5 becomes 100; trailing zeros are dropped, so 300.00 becomes 300; and anything that is not a number at all, including an empty box, becomes 250, the middle of the range. Nothing ever reaches a readout as a blank or a nonsense.
- A single photon in a vacuum, and nothing else
- The wavelength here is the vacuum wavelength. Inside glass or water it shortens while the frequency and the photon energy do not, so a wavelength measured in a medium needs converting before it is typed in. There is no refractive index, no absorption, no scattering and no line width anywhere in this model, and nothing on the screen describes a real beam, a real lamp or a real atmosphere.
- Nothing here has been measured
- One slider position and one button press go in, and one idealised photon comes out. No reading on this page describes a real source, and a preset name is only a label for the two values it writes. If you want the same photon expressed as a frequency first, or converted from angstroms, that is the photon energy calculator and the sibling wavelength tool rather than this panel. Check anything you intend to depend on against a source of your own first.
Where ultraviolet radiation is actually used
- Explaining why a germicidal lamp has to be manufactured
- Load the Germicidal 254 nm line preset and read two cards together. The band card says UVC and the ground card says Blocked by the atmosphere, which between them are the entire engineering argument: the wavelength that does the work is the one wavelength sunlight never delivers. The per-mole cell adds what one mole of those photons brings, 471.0 kJ/mol, which is the figure a chemist would rather have than an electronvolt.
- Choosing a lamp for a photoelectric demonstration
- This is the question the threshold cell answers directly, and the four buttons are deliberately spread across the awkward part of the range. A demonstration on caesium or sodium works with visible light, so it proves a threshold exists and hides how sharp it is; zinc needs something shorter than 288.3 nm and copper shorter than 263.8 nm. Press each button and read that one cell to see which lamp a given metal forces on you.
- Settling the “stronger light” argument in front of a class
- Put the slider on 300.0 nm, press Zn, and ask what would happen with a lamp ten times brighter. Then press Na without moving anything and let the card answer: Kmax 1.833 eV appears because the target changed, not because the light did. The demonstration takes one click and it removes the idea that intensity is what matters here.
- Reading a UV lamp specification written in nanometres
- Datasheets quote a wavelength and almost never an energy, so the first useful thing to do with a figure like 365 or 254 nm is to put it on the slider and read the other four cards. That is what the black-light preset is for: 3.397 eV, UVA, ~95 % of surface UV and No electron on the default metal, all from one number off a label.
- Seeing how lopsided the three bands really are
- The strip is drawn to scale, which makes a point no list of boundaries does: UVC occupies the left 60 per cent of the axis and UVB a sliver of about 12 per cent, yet UVB is the band most of the public conversation is about. Drag the pointer from one end to the other and count how long it spends in each region. The picture is arguing that the naming is uneven, and it can only argue that because every position came from the same map.
- Auditing a wavelength-to-energy conversion someone has handed you
- Multiply the Photon energy card by the Wavelength cell. If the product is not 1239.842 then one of the two figures is wrong, and this works at every stop of the slider because that product is the constant the fixed line prints. It catches a factor-of-ten slip instantly and a misquoted band immediately afterwards.
- Teaching where a convention ends and a measurement begins
- Two cards on this panel are arithmetic and two are quotations, and telling students which is which is half the lesson. Photon energy and Photoelectron are computed; UV band and Reaches the ground? are lookups against a convention and a published summary. Drive the slider across 315 nm and the two kinds behave visibly differently: one pair inches, the other jumps.
Where to go next
The topic itself — what ultraviolet radiation is, the three bands in full, which of them reaches the ground, why it does things visible light cannot, and seven problems worked end to end — is in Ultraviolet Radiation: Types & Effects. If typing suits you better than dragging, the ultraviolet radiation calculator heads the list below, and it runs the same relation in all three directions.
The neighbouring questions have tools of their own. The electromagnetic spectrum guide and the spectrum lab put this one band back among the others; the guide to the photon energy formula with its calculator covers where E = hf comes from; and the guide to the photoelectric effect covers the experiment these four work functions were borrowed from.
Further out, the guide to the Bohr model is where hydrogen’s 13.6 eV comes from, the guide to wavelength formulas and units covers the nanometre itself, and the guide to gamma rays picks the spectrum up again well past the point where photons really do ionise. The rest is in the library of physics simulations and on the blog.
Frequently asked questions
Why is the slider a wavelength in nanometres rather than an energy in electronvolts?
Because that is the unit ultraviolet is specified in everywhere: 254 nm germicidal, 365 nm black light, the 315 nm boundary. A linear nanometre axis also puts the two band divisions at fixed places on the control, which is the point of the drawing. The energy is never hidden for it — the Photon energy card sits at the top of the panel and moves as you drag.
I changed the metal and the Photon energy card did not move. Is the lab stuck?
No, and that is the cleanest single result here. A photon does not know what it is about to hit, so the metal buttons change only three readouts: Photoelectron, Metal and Longest wavelength that works. Park the slider on 300.0 nm and press Cs, Na, Zn, Cu in turn: the card holds at 4.133 eV and the band holds at UVB every time, while Photoelectron runs Kmax 2.033 eV, Kmax 1.833 eV, No electron, No electron.
At 288.3 nm zinc reads a Kmax, but at 263.8 nm copper reads No electron. Why the difference?
Because the exact thresholds are 288.34 nm for zinc and 263.80 nm for copper, and the slider steps in tenths. The 288.3 stop lands just short of zinc’s figure, so it still ejects, with Kmax 0.0005272 eV left over. The 263.8 stop lands just past copper’s, so it does not. One step shorter, at 263.7 nm, copper reads Kmax 0.001714 eV. The panel is not rounding towards either edge.
The electronvolt labels under the strip are not evenly spaced. Is that a drawing fault?
No, it is the honest consequence of one scale being labelled twice. Every label is placed by its wavelength through the same map, so an evenly spaced row of energies has to sit unevenly. The caption says why in words: E goes as one over lambda. The 12 eV and 10 eV labels sit almost on top of each other at the left edge, while 4 eV and 3.5 eV are far apart at the right.
Can I set a wavelength outside 100 to 400 nm?
Not with the slider, which is hard-limited to the World Health Organization range. Type something outside it and the browser clamps rather than accepts: 99 becomes 100 and 401 becomes 400. Text that is not a number at all falls to 250, the middle of the range. The two out-of-range band strings the lab can print, Beyond UV (X-ray side) and Not UV (visible or longer), are reachable only through the test hook.
Why does the threshold marker vanish off the right-hand edge for caesium and sodium?
Because their thresholds are 590.40 nm and 539.06 nm, which are not ultraviolet at all. Rather than squash the axis to fit them, the drawing puts a chevron at the right edge, shades the whole strip, and writes the figure out: Cs threshold 590.4 nm — off the scale: any UV works. That is the physics rather than a fault, and it is the result most readers do not expect.
What does the Reaches the ground card actually measure?
Nothing — it measures nothing at all, and that is deliberate. It prints one of four fixed strings chosen by the band: Blocked by the atmosphere, Mostly absorbed, ~95 % of surface UV, or Outside the WHO UV range. Those are the World Health Organization’s summary of what the atmosphere does, quoted rather than computed, and there is no transmission calculation anywhere in the lab.
Is the ultraviolet on this slider ionising radiation?
Not on the usual test. Ionising a hydrogen atom takes 13.6 eV, which is a photon of 91.1649 nm, and that is shorter than the 100 nm end of the slider. Drag it all the way left and the card reads 12.40 eV — about 91 per cent of the way and no further. Ultraviolet does carry enough energy to break chemical bonds, a much lower bar, but nothing on this panel is a claim about ionisation.
References & formula source
- One relation drives this panel and it is not a fit: E = h times c divided by the wavelength, which in the units the lab works in is E in eV = 1239.842 divided by the wavelength in nm. The constant 1239.842 eV nm is h times c divided by the elementary charge, and because the Planck constant, the speed of light and the elementary charge are all exact by the 2019 definitions of the SI units, so is it. It is also already the house value on this site, used by the Bohr model and Schrodinger equation labs, and this cluster introduces no second version of it. The energy per mole cell multiplies by a second exact figure, 96.48533212 kJ/mol per eV.
- The 100 to 400 nm range, the three bands UVA 315-400 nm, UVB 280-315 nm and UVC 100-280 nm, and the three atmospheric verdicts the lab prints are from the World Health Organization question-and-answer page on ultraviolet radiation, retrieved for this cluster on 2026-09-29. They are quoted, never computed: there is no transmission calculation anywhere in this simulation. The absorbers WHO names are ozone, water vapour, oxygen and carbon dioxide, and the roughly 95 per cent figure on the UVA card is WHO’s share of the ultraviolet reaching the surface.
- The band boundaries are a CONVENTION agreed by committee and not a physical edge. Nothing in the arithmetic changes at 280.0 or 315.0 nm; the absorption and the biological effect they stand for both vary smoothly, and another body could reasonably have drawn the lines a few nanometres away. The rule this cluster fixes, so that the lab, the calculator and the guide cannot disagree, is that each band owns its SHORT edge and not its long one.
- The four work functions Cs 2.1 eV, Na 2.3 eV, Zn 4.3 eV and Cu 4.7 eV are this site’s own already-published values, the preset metals of the photoelectric effect lab, so they are not new numbers and need no external source. Kmax = E - phi is the label the sim prints above its own Photoelectron card and is applied there for a yes or no; it is not derived on this page, and the experiment it comes from belongs to our photoelectric effect guide. The exact threshold wavelengths behind the four buttons are 590.40, 539.06, 288.34 and 263.80 nm.
- The 13.6 eV ionisation energy of hydrogen is the figure this site already publishes in the Bohr model calculator. The photon that carries it sits at 91.1649 nm, which is shorter than the 100 nm short edge of the slider, so no wavelength this lab calls ultraviolet can ionise a hydrogen atom. The shortest ultraviolet, 12.3984 eV at 100 nm, reaches 91.16 per cent of the way.
- No ultraviolet index figure, radiation dose, sun protection factor, lamp rating, bond dissociation energy or health statistic appears anywhere on this page, because none was sourced for this cluster. Every readout figure quoted above is a string this simulation printed for the metal button and the slider position named beside it, read back out of the running lab rather than worked out by hand. Each is computed from the exact value and rounded once, so re-deriving one printed figure from another will not always reproduce it. Where a figure here and the lab ever part company, believe the lab, and verify anything you intend to rely on against your own data before you quote it.
- Further reading: Ultraviolet — Wikipedia