The kinetic theory of gases simulator is a free interactive lab built around one awkward fact: a gas has no single molecular speed, so “the” speed of its molecules is three different numbers off one curve. Pick a gas, set a temperature and a number density, and the panel answers with all three — 402.670 m/s, 454.365 m/s and 493.169 m/s on the state it opens in — together with the Pressure those molecules exert, 100.000 kPa. Then drag the gold threshold across the drawing and watch the one readout that refuses to move.
Kinetic Theory of Gases
Molecules in a gas do not share one speed — they have a whole distribution of them, and the three averages everyone quotes are three different numbers off the same curve. Pick a gas, set a temperature and a number density, and read the pressure straight out of PV = (1/3) N m v_rms^2. Then drag the threshold: the fraction of molecules faster than a given multiple of the rms speed is the same percentage for helium at 100 K and carbon dioxide at 1000 K alike.
Load a real gas state onto the speed distribution
The first five buttons press the lab’s own five preset buttons, which is the only way to reach the exact ice point: each pins the temperature and the number density and then derives both thumbs. The last two press a preset and then move one slider, exactly as you would by hand. Work down the list: the first three change only the gas, the next two take the temperature to each end of its range, and the last two push one control to an extreme.
Pick a state above, or drag the three sliders yourself.
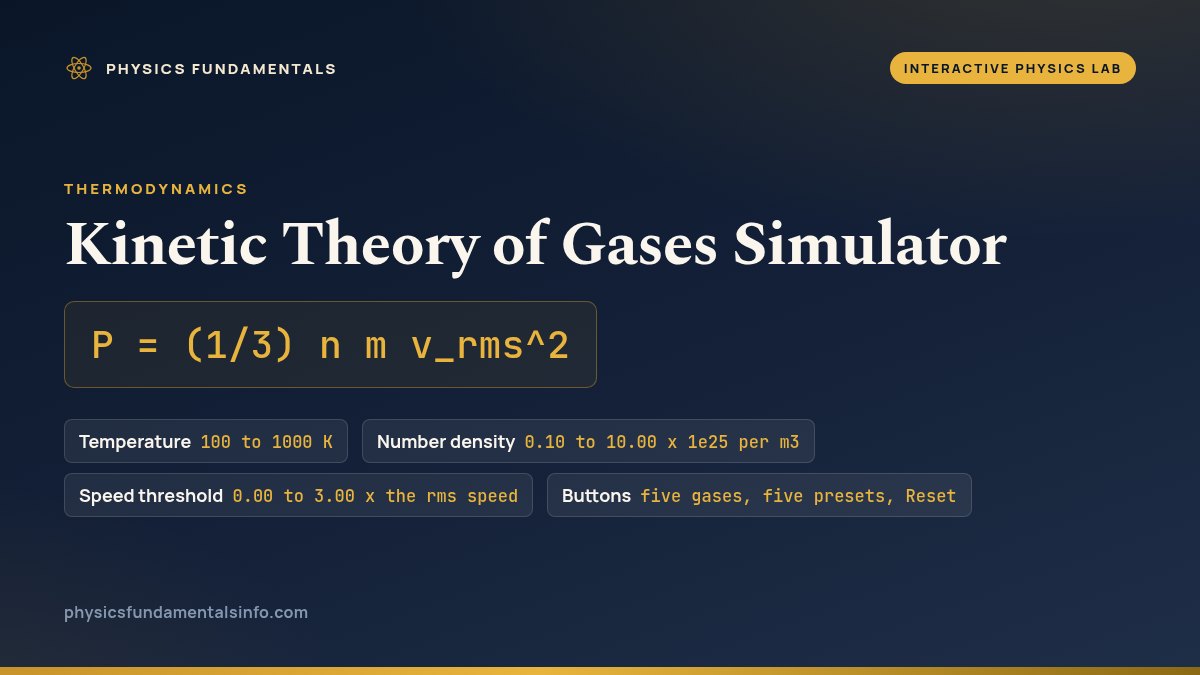
What Is the Kinetic Theory of Gases Simulator?
The kinetic theory of gases simulator is a free interactive physics lab that runs in your browser, with nothing to install and no sign-up. It draws the Maxwell–Boltzmann speed distribution for one gas at one temperature and marks the three averages everybody quotes on the single curve they all come from, so you can see at once that “the” speed of a gas molecule is three different numbers. A gold dashed rule sets a threshold, the tail beyond it is shaded, and the panel reports what fraction of the molecules that shaded area holds.
Three sliders and three button rows drive it. Temperature runs 100 to 1000 K in steps of 1, Number density runs 0.10 to 10.00 in units of 1e25 per m3 in steps of 0.01, and Speed threshold runs 0.00 to 3.00 times the rms speed in steps of 0.01. Five buttons choose the gas — He, N2, O2, Ar, CO2 — five more load a published state, and Reset returns the one the lab opens in. Because the temperature slider is whole-number, the ice point is reached by its preset, Ice point - N2 at 273.15 K, which pins the exact value and derives the thumb.
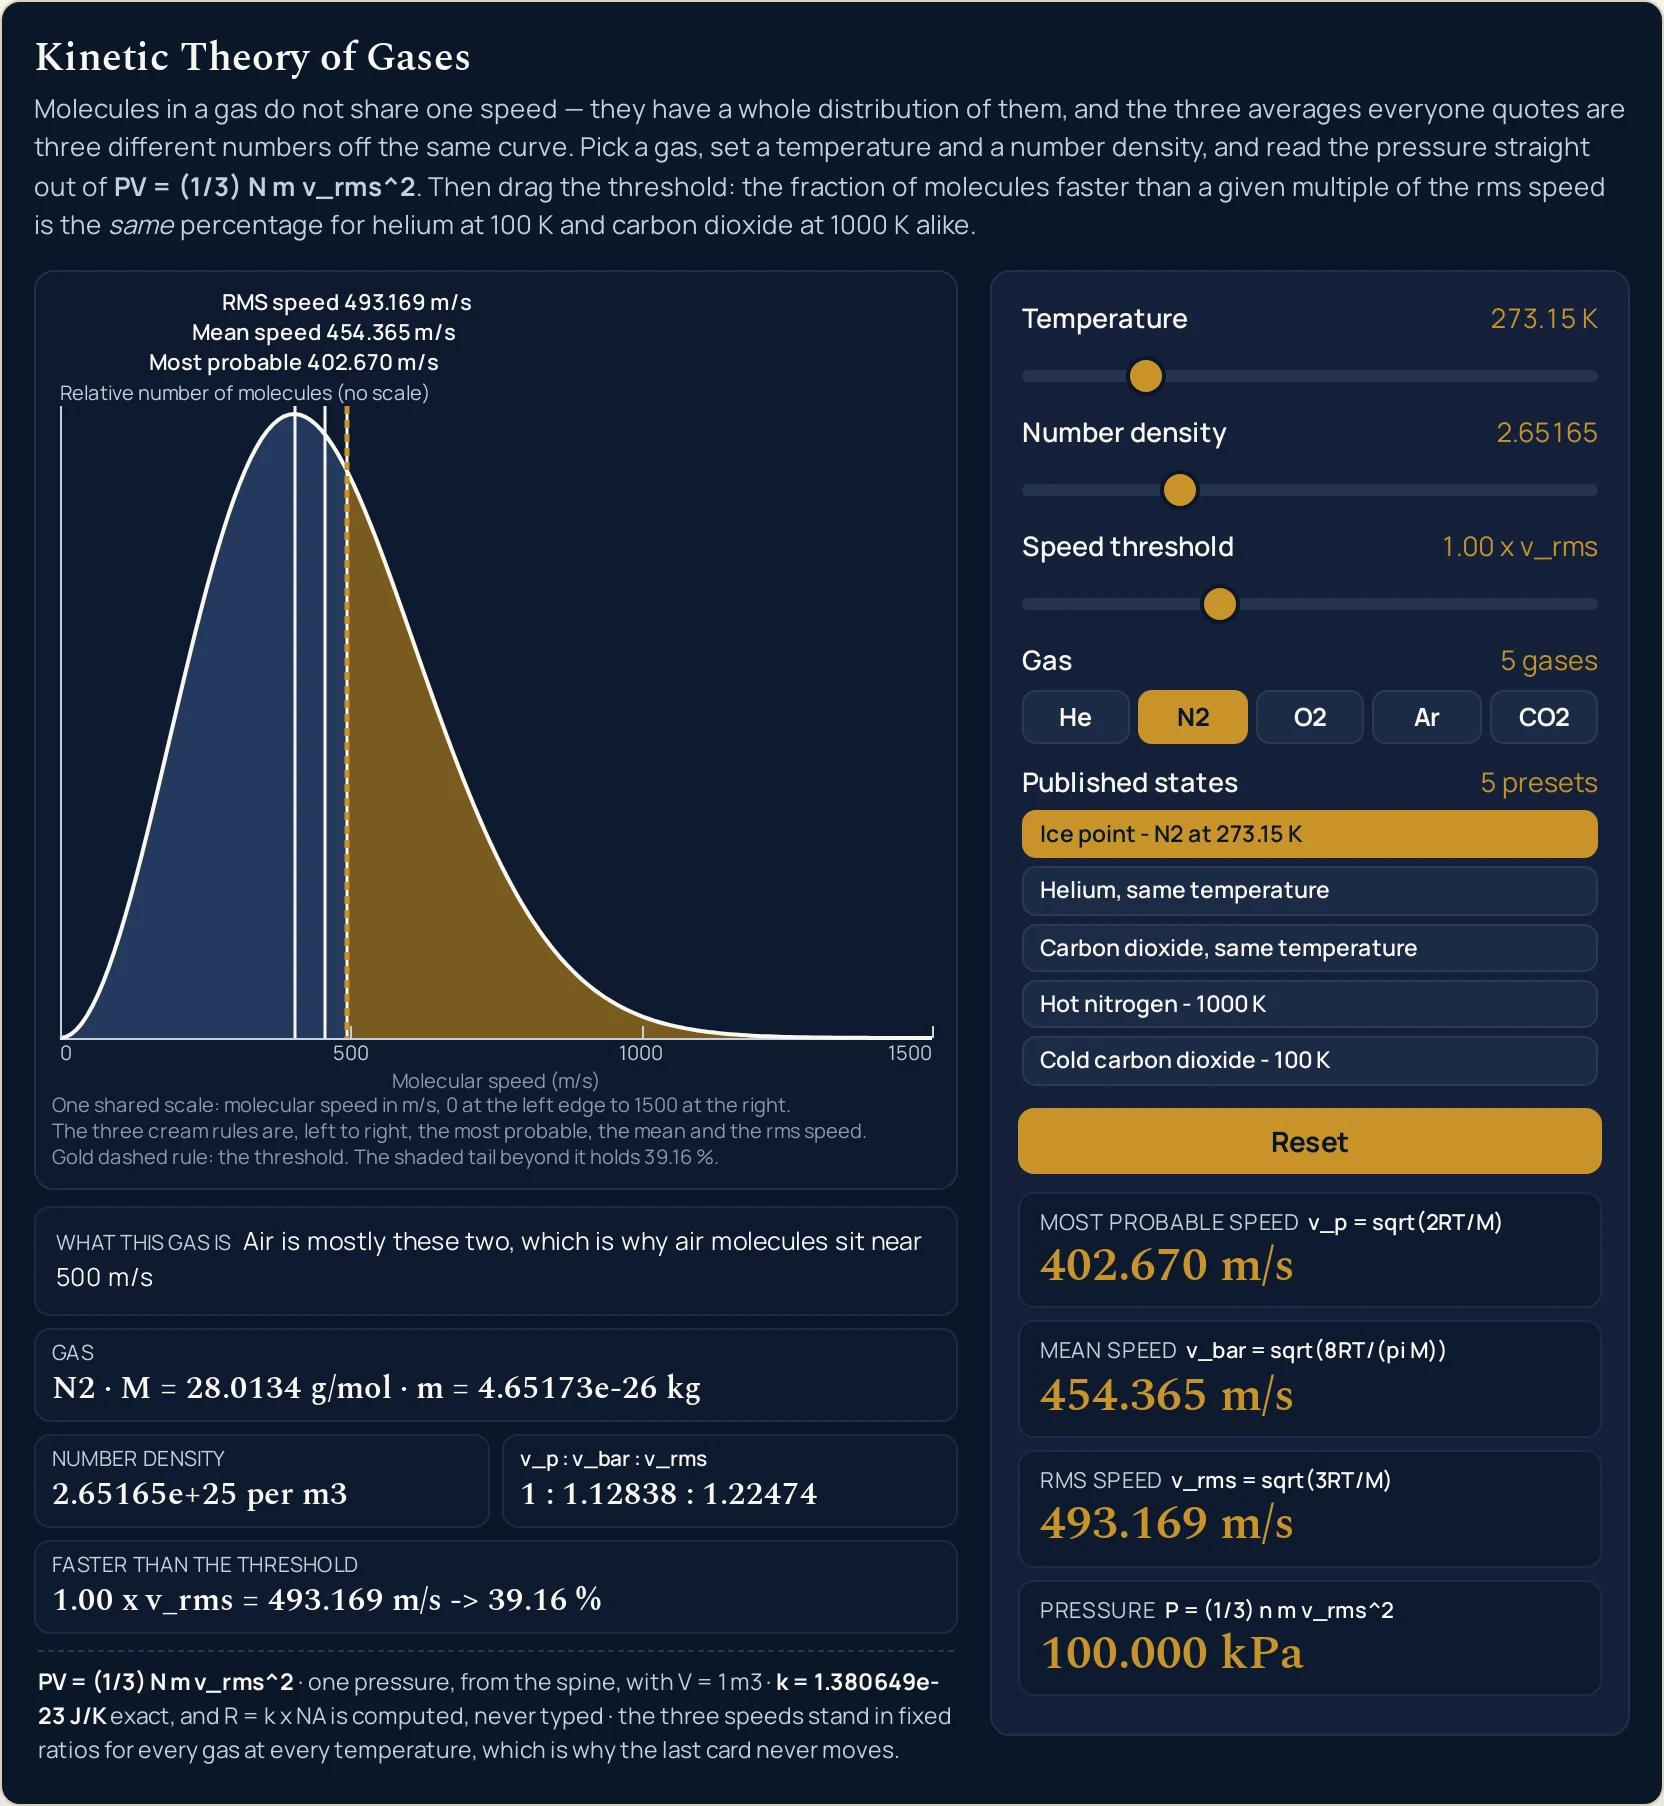
Nine readouts answer. Four cards give the Most probable speed, the Mean speed, the RMS speed and the Pressure, each to six significant figures; a compact grid adds the Gas with its molar mass and the mass of one molecule, the Number density, the row headed v_p : v_bar : v_rms and Faster than the threshold; and a sentence strip under the drawing makes the ninth. On the state the lab opens in those cards read 402.670 m/s, 454.365 m/s, 493.169 m/s and 100.000 kPa, the density reads 2.65165e+25 per m3 and the threshold row reads 1.00 x v_rms = 493.169 m/s -> 39.16 %.
Two of those readouts are there to refuse to move, which is the lab's whole argument. Press He, O2, Ar or CO2 at a fixed temperature and density and every speed changes while the Pressure card holds at 100.000 kPa: the pressure does not know the molecular mass. Change the gas, the temperature or the density however you like and the ratio row still reads 1 : 1.12838 : 1.22474 and the threshold row still ends in 39.16 % at 1.00 x v_rms — the same string at every setting, because the shape of the distribution depends only on the speed divided by the most probable speed.
What the panel does not do, it says. There is no molecule animation and no box of bouncing dots, the vertical axis is a relative number of molecules with no figure printed on it, and one pressure is shown rather than two, because a second route to the same number could never disagree with the first. Nothing here converts a temperature, computes a heat capacity or publishes a mean free path.
| Control | Range | Step or default |
|---|---|---|
| Temperature | 100 to 1000 K | step 1; opens pinned at 273.15 K |
| Number density | 0.10 to 10.00 x 1e25 per m3 | step 0.01; opens at 2.65165 |
| Speed threshold | 0.00 to 3.00 x the rms speed | step 0.01; opens at 1.00 |
| Buttons | five gases, five presets, Reset | one press each |
How to use the kinetic theory of gases simulator
- Read the panel before you touch it. The lab opens at rest on nitrogen at the ice point, so every reading is already there: Most probable speed 402.670 m/s, Mean speed 454.365 m/s, RMS speed 493.169 m/s and Pressure 100.000 kPa. Nothing is animating and nothing needs a click to appear.
- Find those three speeds in the drawing. Three cream rules cross the curve, and each carries its own label in its own band: Most probable 402.670 m/s, Mean speed 454.365 m/s and RMS speed 493.169 m/s. They are the panel’s own figures, so the picture cannot disagree with the cards, and they sit close together but never coincide.
- Read the grid under the drawing as four separate answers. Gas gives N2 · M = 28.0134 g/mol · m = 4.65173e-26 kg, Number density gives 2.65165e+25 per m3 with the unit written out, the row headed v_p : v_bar : v_rms gives 1 : 1.12838 : 1.22474, and Faster than the threshold gives 1.00 x v_rms = 493.169 m/s -> 39.16 %.
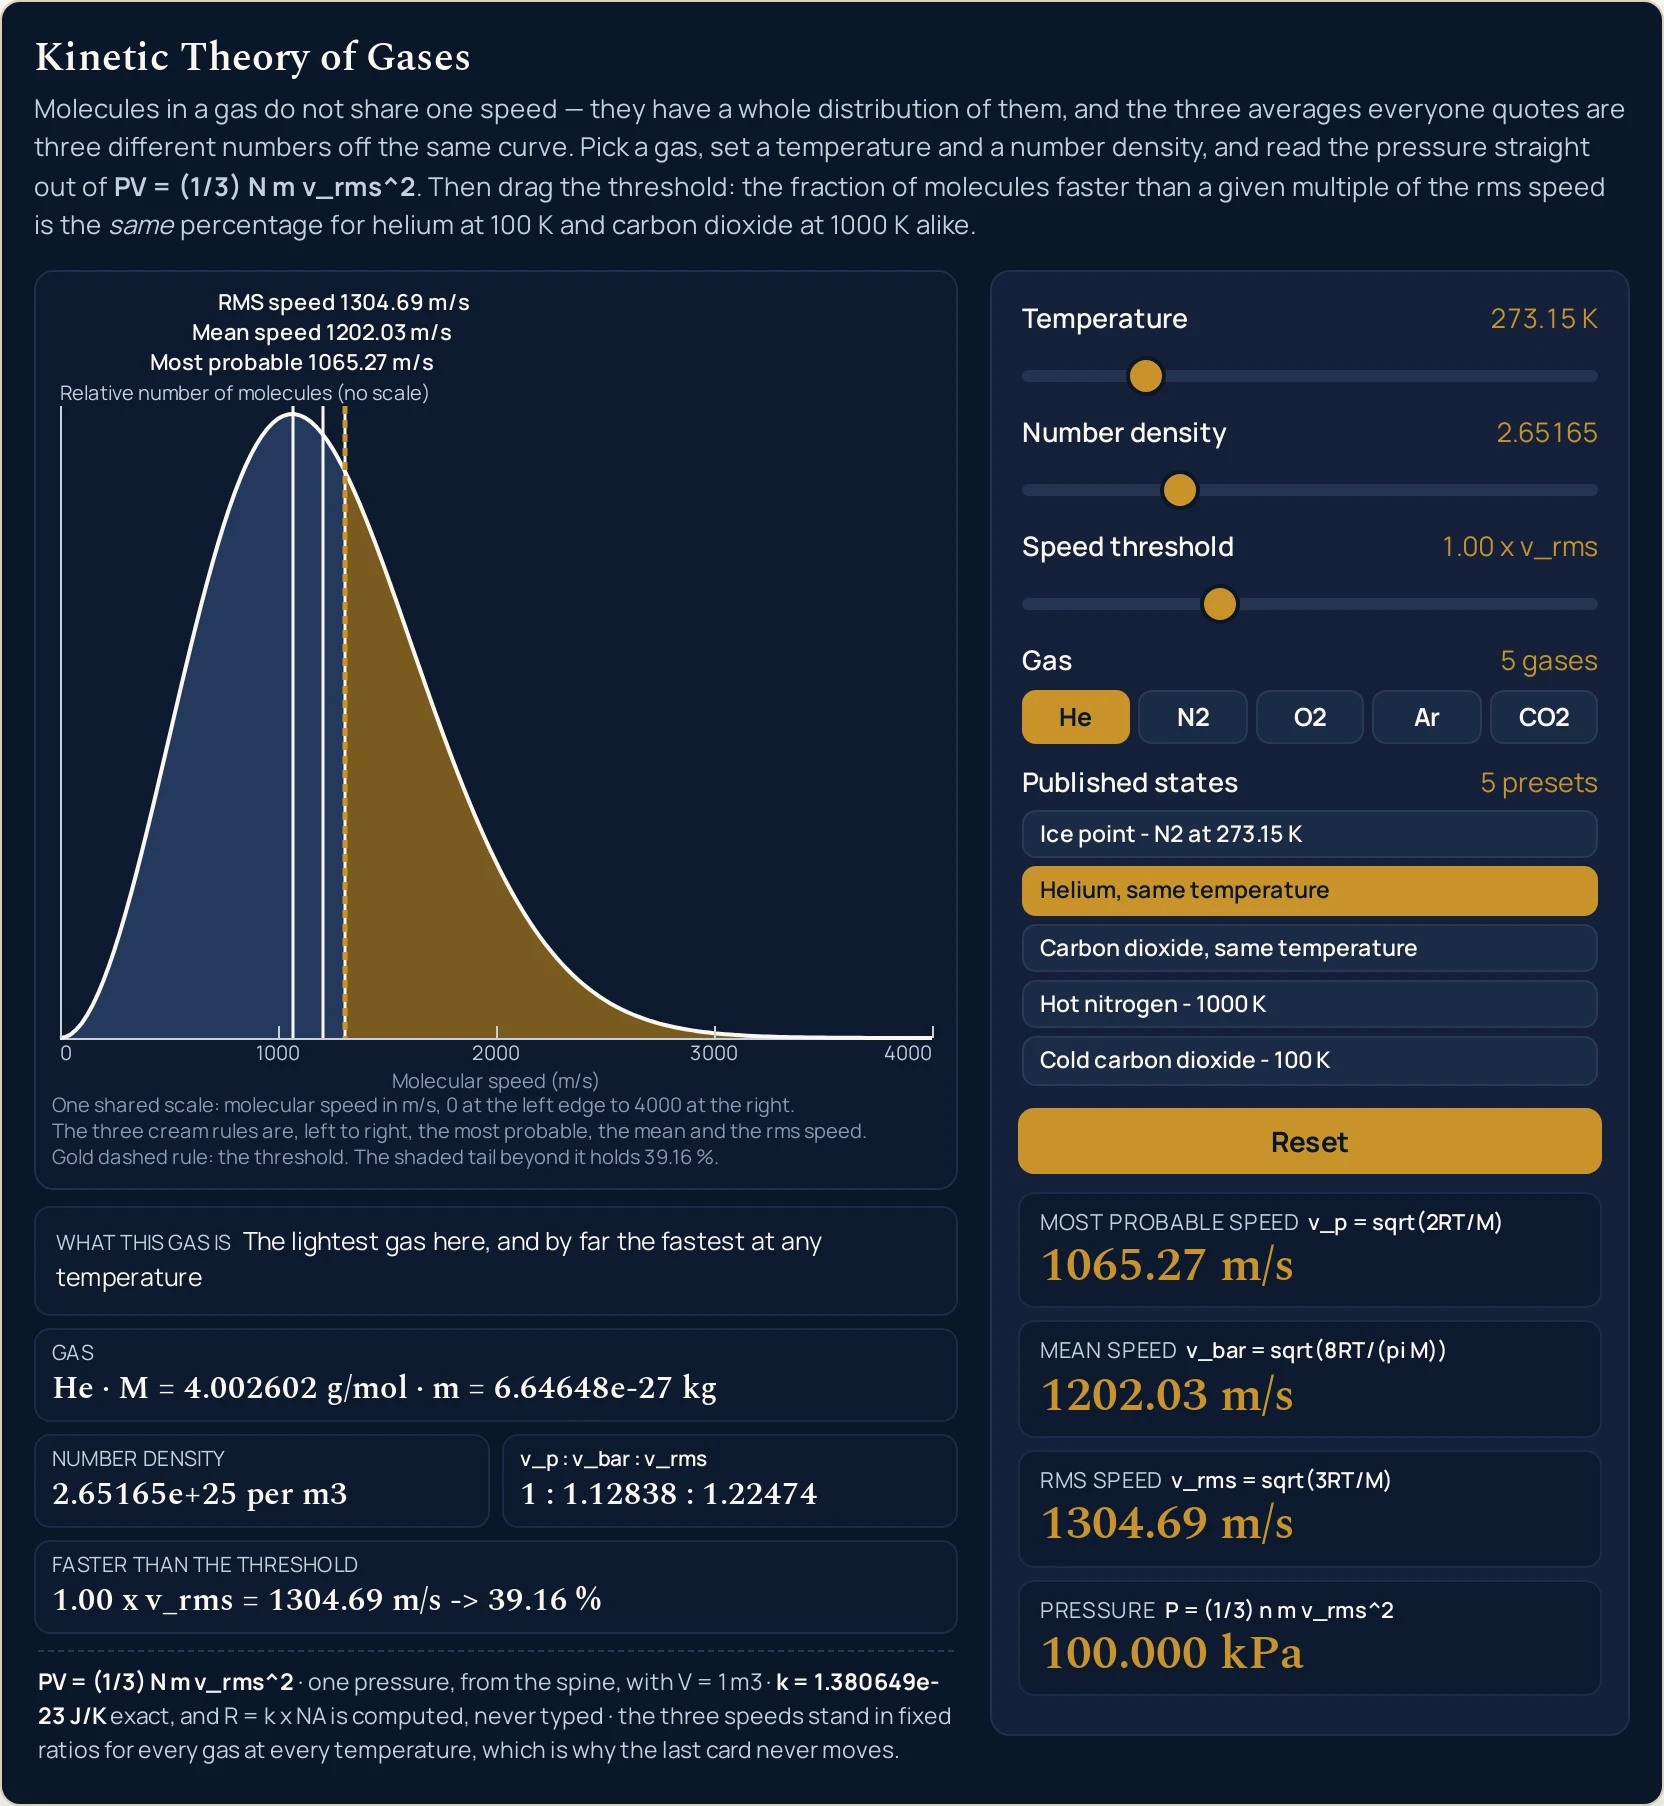
- Press a gas button and count what moves. With the ice-point preset loaded, He takes the rms card to 1304.69 m/s and CO2 takes it to 393.464 m/s. All three speed cards move together, the drawing rescales its axis, and the Pressure card does not move off 100.000 kPa for any of the five.
- Drag the temperature slider and watch the pressure outrun the speeds. From the ice point to 1000 K the rms card goes from 493.169 to 943.615 m/s, not quite doubling, while Pressure goes from 100.000 to 366.099 kPa. The speeds follow the square root of the temperature and the pressure follows the temperature itself.
- Drag the number density and watch the speeds ignore you. Take it to its stops and the three speed cards do not change by a digit, while Pressure runs from 3.77124 to 377.124 kPa and the Number density cell from 1.00000e+24 to 1.00000e+26 per m3. How many molecules there are is not how fast they are going.
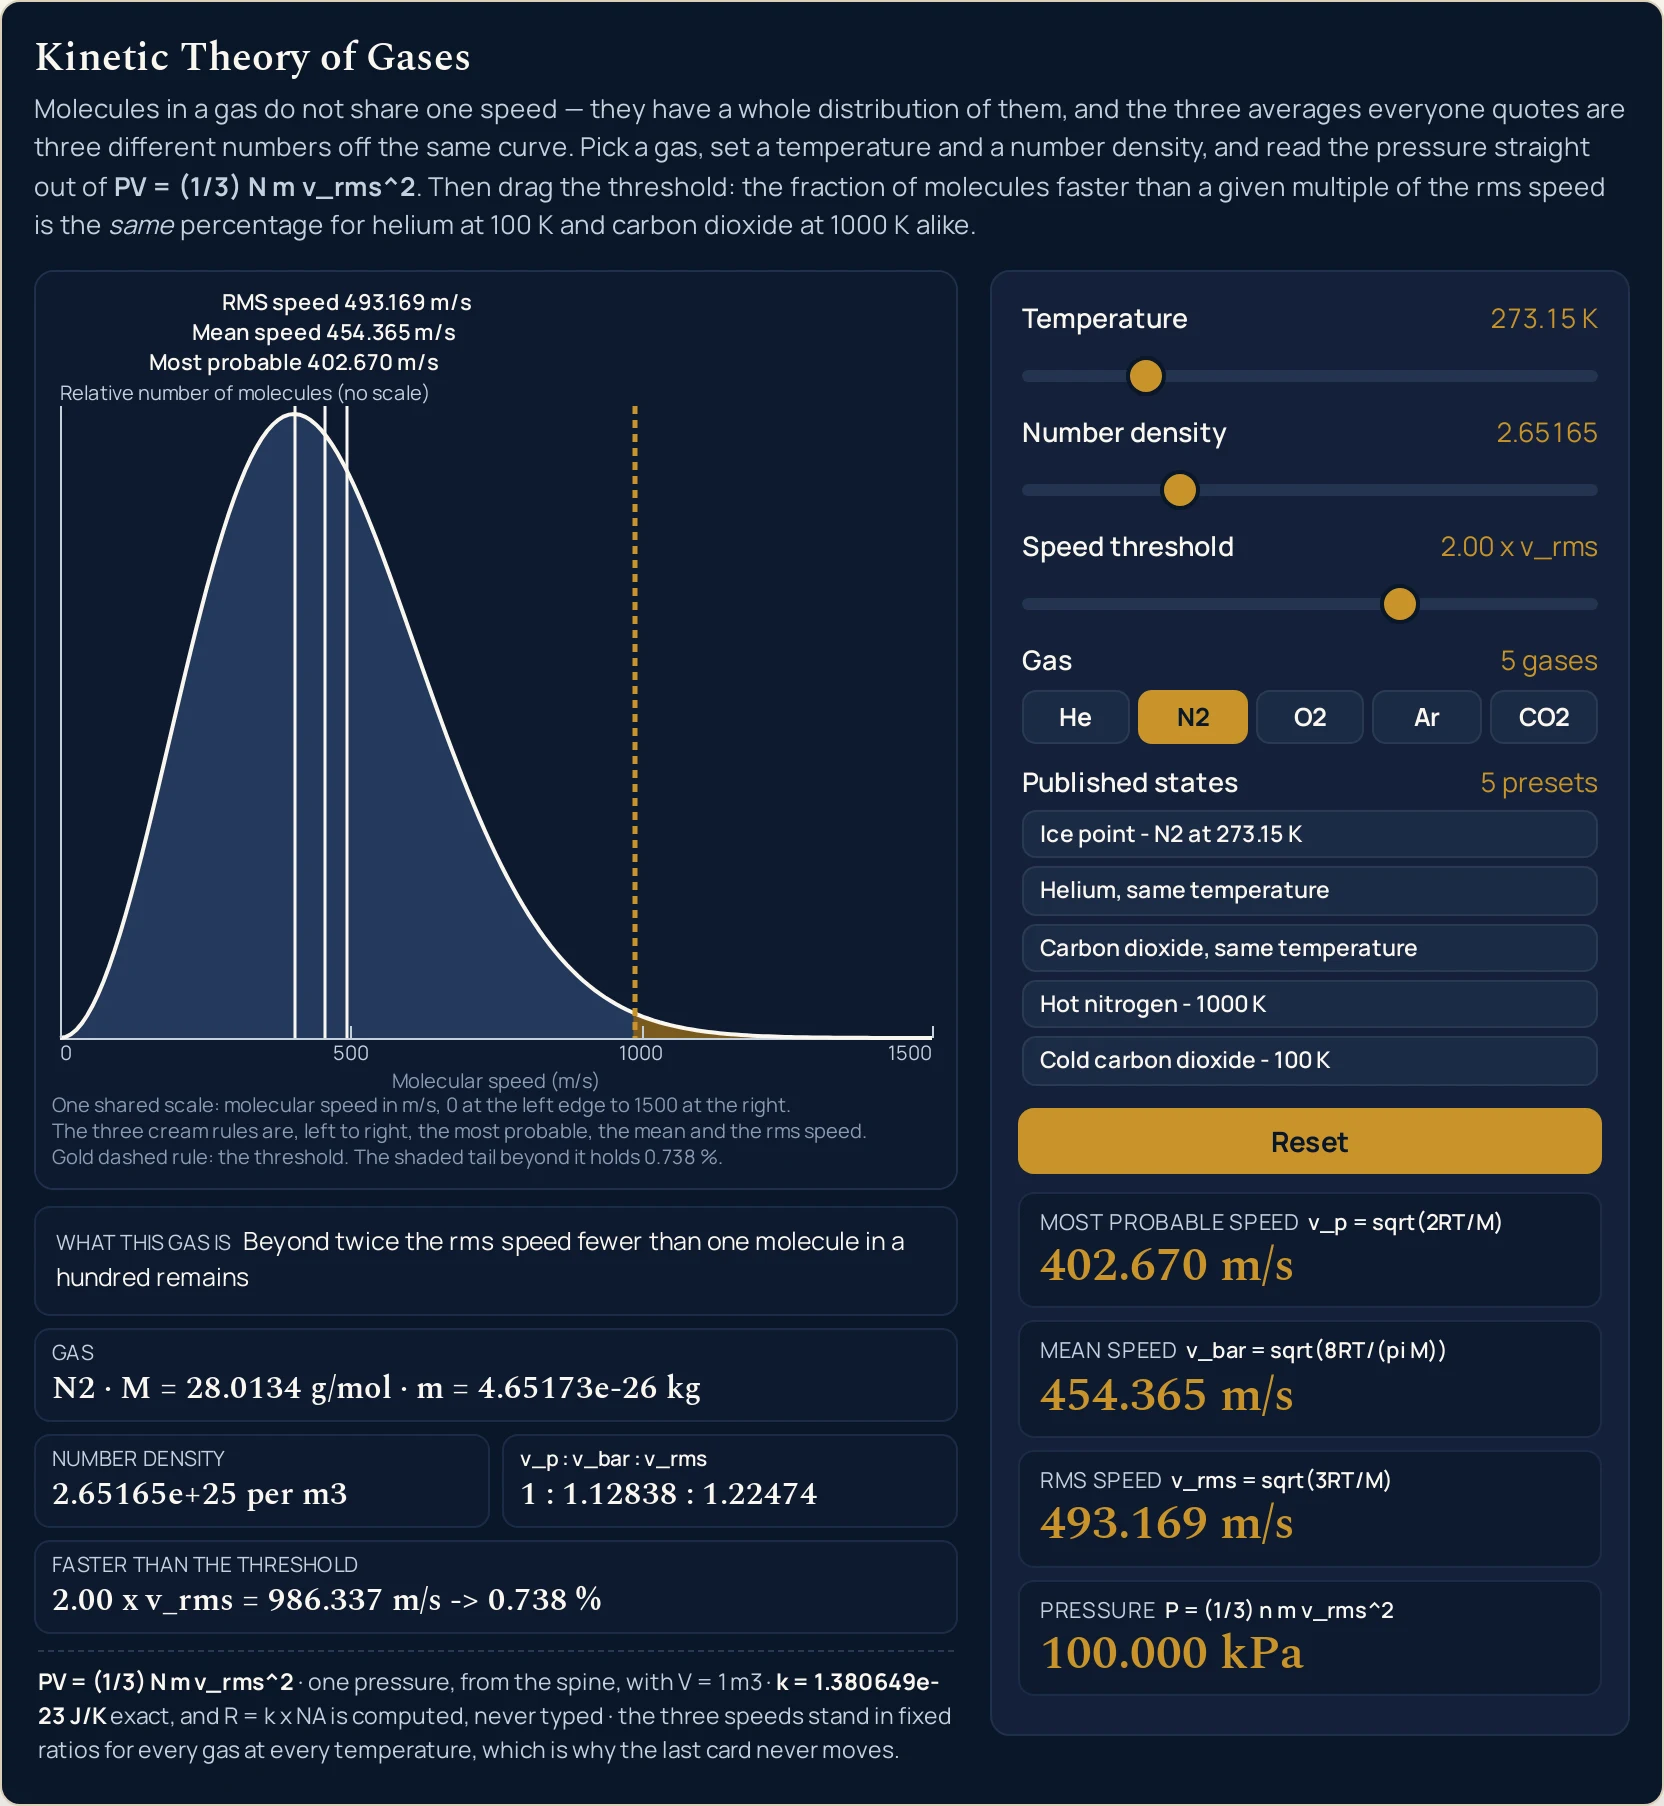
- Now drag the threshold, which is what the lab is for. The gold dashed rule moves and the shaded tail with it, and Faster than the threshold reports the shaded area: 86.14 % at 0.50 x v_rms, 39.16 % at 1.00, 0.738 % at 2.00. Then change the gas or the temperature and read that percentage again.
- Watch the sentence strip change over at exactly 2.00. The strip labelled What this gas is normally names the gas, but at 1.99 x v_rms it still reads Air is mostly these two, which is why air molecules sit near 500 m/s and at 2.00 x v_rms it reads Beyond twice the rms speed fewer than one molecule in a hundred remains. One step of the slider switches which sentence has priority.
- Use the preset buttons when you want the published state. The temperature slider steps in whole kelvin, so 273.15 K is not one of its positions; Ice point - N2 at 273.15 K pins the exact value and then puts the thumb at 273. Touching that slider drops the pin at once, which is honest rather than tidy — and it is why dragging to 273 gives 493.033 m/s instead.
- Press Reset when you have lost track. It restores the pinned anchor, puts the threshold back on 1.00 x v_rms and replays the settle from the left-hand edge, so the curve and the rules slide back into place rather than jumping. Exactly one preset button carries the pressed state at a time.
- Read the fixed line last of all. It gives PV = (1/3) N m v_rms^2, the volume the pressure assumes, the exact Boltzmann constant and the note that the three speeds stand in fixed ratios for every gas at every temperature. That is the whole of what the panel assumes, in one line.
If typing suits you better than dragging — or if the quantity you hold is a volume or a molecule count rather than a temperature — that is the job of the kinetic theory of gases calculator, which solves the same relation for any one of its four quantities. For what the model is, where the one third comes from and seven problems worked end to end, read the full guide to the kinetic theory of gases.
Worked example: change one thing at a time
Every row below is one button or one drag, and every cell is a string the running lab printed there. The five presets come first because they are the states this cluster publishes, and they are built to be read in two groups: the first three change only the gas, and the first, fourth and fifth change only the temperature.
| Preset button | Temperature | Most probable speed | Mean speed | RMS speed | Pressure |
|---|---|---|---|---|---|
| Ice point - N2 at 273.15 K | 273.15 K | 402.670 m/s | 454.365 m/s | 493.169 m/s | 100.000 kPa |
| Helium, same temperature | 273.15 K | 1065.27 m/s | 1202.03 m/s | 1304.69 m/s | 100.000 kPa |
| Carbon dioxide, same temperature | 273.15 K | 321.262 m/s | 362.505 m/s | 393.464 m/s | 100.000 kPa |
| Hot nitrogen - 1000 K | 1000 K | 770.458 m/s | 869.369 m/s | 943.615 m/s | 366.099 kPa |
| Cold carbon dioxide - 100 K | 100 K | 194.383 m/s | 219.338 m/s | 238.070 m/s | 36.6099 kPa |
Read the last column down the page rather than across it. Rows 1 to 3 hold the temperature and the density fixed and change only the gas: the rms speed moves by a factor of 3.3 and the pressure does not move at all. Rows 1, 4 and 5 change the temperature instead, and the pressure follows it exactly: 100.000, 366.099 and 36.6099 kPa at 273.15, 1000 and 100 K. The gas changes in the last of those three as well, and the pressure takes no notice, which is the first result over again.
Two readouts the table leaves out never change in any of the five rows. Faster than the threshold ends in 39.16 % at every one of them, and the row headed v_p : v_bar : v_rms reads 1 : 1.12838 : 1.22474 at every one. Neither is a coincidence of these five states: both hold at every setting the three sliders can reach, which is why they are on the panel at all.
The five gas buttons at one temperature and one density
Press a preset first and then a gas button: the preset’s pins survive, so the only thing that changes down these five rows is which molecule is in the box. The number density cell holds 2.65165e+25 per m3 throughout and the temperature row holds 273.15 K.
| Gas button | What the Gas cell prints | RMS speed | Pressure | Speed axis runs to | Sentence strip |
|---|---|---|---|---|---|
| He | He · M = 4.002602 g/mol · m = 6.64648e-27 kg | 1304.69 m/s | 100.000 kPa | 4000 | The lightest gas here, and by far the fastest at any temperature |
| N2 | N2 · M = 28.0134 g/mol · m = 4.65173e-26 kg | 493.169 m/s | 100.000 kPa | 1500 | Air is mostly these two, which is why air molecules sit near 500 m/s |
| O2 | O2 · M = 31.9988 g/mol · m = 5.31353e-26 kg | 461.436 m/s | 100.000 kPa | 1500 | Air is mostly these two, which is why air molecules sit near 500 m/s |
| Ar | Ar · M = 39.948 g/mol · m = 6.63352e-26 kg | 412.982 m/s | 100.000 kPa | 1000 | A single heavy atom - no rotation, nothing but translation |
| CO2 | CO2 · M = 44.0095 g/mol · m = 7.30795e-26 kg | 393.464 m/s | 100.000 kPa | 1000 | The heaviest gas here, and the slowest at the same temperature |
The fourth column is the result and the second column is the reason. Helium carries the smallest mass of one molecule in the table, 6.64648e-27 kg, and the largest rms speed; carbon dioxide carries the largest mass, 7.30795e-26 kg, and the smallest speed. The two move against each other in exactly the proportion that leaves the pressure alone, which is what the flat 100.000 kPa column is saying.
The fifth column is not a readout but it is the sim’s own figure: the maximum of the speed axis, chosen by the lab’s axis function so the curve always fills the plot. It is why helium’s curve does not run off the right-hand edge and carbon dioxide’s is not squeezed into the left. The number density behind all five rows is the state 100 kPa and the ice point correspond to, which is also the state that makes a mole fill the volume our guide to Avogadro's law publishes.
The threshold slider, dragged from end to end
This is the control the lab was built around. The gold dashed rule stands at the chosen multiple of the rms speed, the area under the curve beyond it is shaded, and the grid row reports that area three ways: as the multiple, as an absolute speed in m/s, and as a percentage.
| Threshold slider | Faster than the threshold | Sentence strip |
|---|---|---|
| 0.00 x v_rms | 0.00 x v_rms = 0 m/s -> 100.00 % | Air is mostly these two, which is why air molecules sit near 500 m/s |
| 0.50 x v_rms | 0.50 x v_rms = 246.584 m/s -> 86.14 % | Air is mostly these two, which is why air molecules sit near 500 m/s |
| 0.82 x v_rms | 0.82 x v_rms = 404.398 m/s -> 56.88 % | Air is mostly these two, which is why air molecules sit near 500 m/s |
| 1.00 x v_rms | 1.00 x v_rms = 493.169 m/s -> 39.16 % | Air is mostly these two, which is why air molecules sit near 500 m/s |
| 1.22 x v_rms | 1.22 x v_rms = 601.666 m/s -> 21.54 % | Air is mostly these two, which is why air molecules sit near 500 m/s |
| 1.50 x v_rms | 1.50 x v_rms = 739.753 m/s -> 8.03 % | Air is mostly these two, which is why air molecules sit near 500 m/s |
| 1.99 x v_rms | 1.99 x v_rms = 981.405 m/s -> 0.780 % | Air is mostly these two, which is why air molecules sit near 500 m/s |
| 2.00 x v_rms | 2.00 x v_rms = 986.337 m/s -> 0.738 % | Beyond twice the rms speed fewer than one molecule in a hundred remains |
| 2.50 x v_rms | 2.50 x v_rms = 1232.92 m/s -> 0.0308 % | Beyond twice the rms speed fewer than one molecule in a hundred remains |
| 3.00 x v_rms | 3.00 x v_rms = 1479.51 m/s -> 0.000589 % | Beyond twice the rms speed fewer than one molecule in a hundred remains |
Three rows of that table are worth stopping on. At 0.00 x v_rms the row reads 100.00 %, which is the only sanity check the lab offers you for free. At 0.82 x v_rms the threshold is almost exactly on the most probable speed and 56.88 % of the gas is above it. At 1.22 the figure has already fallen to 21.54 %, a little over half the 39.16 % one row up.
Now change the gas and read the same row again. At 1.00 x v_rms it ends in 39.16 % for helium at 100 K and for carbon dioxide at 1000 K alike, and at 2.00 it ends in 0.738 % for both. The absolute speed in the middle of the string changes every time; the percentage on the end of it does not.
One preset, then one slider
The last table is the one to read if a figure here and your own screen ever disagree. It starts from a preset and moves a single control, which is how a pin gets dropped: the temperature pin and the density pin are separate, and moving one slider clears only its own.
| What you do | Temperature | Number density | RMS speed | Pressure |
|---|---|---|---|---|
| Press Ice point - N2 at 273.15 K | 273.15 K | 2.65165e+25 per m3 | 493.169 m/s | 100.000 kPa |
| then drag the temperature to 273 | 273 K | 2.65165e+25 per m3 | 493.033 m/s | 99.9451 kPa |
| then drag the temperature to 300 | 300 K | 2.65165e+25 per m3 | 516.839 m/s | 109.830 kPa |
| then drag the temperature to 1000 | 1000 K | 2.65165e+25 per m3 | 943.615 m/s | 366.099 kPa |
| press the preset again, drag the density to 0.10 | 273.15 K | 1.00000e+24 per m3 | 493.169 m/s | 3.77124 kPa |
| press the preset again, drag the density to 10.00 | 273.15 K | 1.00000e+26 per m3 | 493.169 m/s | 377.124 kPa |
| Cold carbon dioxide - 100 K, density to 0.10 | 100 K | 1.00000e+24 per m3 | 238.070 m/s | 1.38065 kPa |
| Hot nitrogen - 1000 K, density to 10.00 | 1000 K | 1.00000e+26 per m3 | 943.615 m/s | 1.38065 MPa |
Rows 1 and 2 are the same thumb position and two different answers. The preset leaves the thumb at 273 while pinning 273.15 K, so the card reads 493.169 m/s; drag to 273 and the pin goes, the temperature row reads 273 K, and the card reads 493.033 m/s. The pressure moves with it, 100.000 to 99.9451 kPa. Read the card, never the thumb.
The last two rows are the corners of the control box, and they print the same five digits. At the bottom corner the card reads 1.38065 kPa and at the top one 1.38065 MPa, because ten times the temperature and a hundred times the density is exactly a thousand times the pressure. That is also the whole range of the pressure card: the two ends of two sliders, three orders of magnitude apart, with the unit following the rounded figure rather than the raw one.
Formula and symbol reference
The panel prints its relations on itself, inside the label of the card each one feeds: v_p = sqrt(2RT/M), v_bar = sqrt(8RT/(pi M)) and v_rms = sqrt(3RT/M) above the three speed cards, and P = (1/3) n m v_rms^2 above the pressure. No answer arrives here without the rule that produced it, and nothing on this page is derived: where the one third comes from belongs to the guide to this topic.
Two of the eight symbols below are not quantities you set. The mass of one molecule arrives with the gas button, and the threshold is a ratio rather than a speed. Everything else is a slider or a card, and the last column gives the range this lab moves it over and the strings it prints at the ends of that range.
| Symbol | Meaning | SI unit | In this lab |
|---|---|---|---|
| T | Temperature of the gas, and what the first slider sets. It is the only control that moves all four cards at once | kelvin | 100 to 1000 in steps of 1, printed beside the slider: “100 K”, “300 K”, “1000 K”. A preset can pin a value off that grid, and one does: “273.15 K”. |
| n | Number density, the molecules per cubic metre. It is in the Number density cell and in the pressure, and in nothing else | per cubic metre | 0.10 to 10.00 in steps of 0.01, in units of 1e25. The cell spells the unit out: “2.65165e+25 per m3” on the opening state, “1.00000e+24 per m3” and “1.00000e+26 per m3” at the two stops. |
| v_p | Most probable speed, the peak of the distribution. Its card prints the relation above it, v_p = sqrt(2RT/M) |
metre per second | six significant figures on the Most probable speed card: “402.670 m/s” on the opening state, “194.383 m/s” at the slowest preset, “2038.27 m/s” for helium at 1000 K. |
| v_bar | Mean speed, the plain arithmetic average over the distribution, under v_bar = sqrt(8RT/(pi M)) |
metre per second | six significant figures on the Mean speed card: “454.365 m/s”, “219.338 m/s”, “2299.94 m/s” at the same three settings. |
| v_rms | Root-mean-square speed, under v_rms = sqrt(3RT/M). It is the one the pressure uses and the one the threshold is a multiple of |
metre per second | six significant figures on the RMS speed card: “493.169 m/s”, “238.070 m/s”, “2496.36 m/s”, and “493.033 m/s” if the temperature slider is dragged to 273 rather than pinned. |
| P | Pressure, on the fourth card, under the relation it comes from: P = (1/3) n m v_rms^2 |
pascal | six significant figures, and the unit follows the rounded figure: “100.000 kPa” on the opening state, “1.38065 kPa” at the bottom corner of the two sliders and “1.38065 MPa” at the top one. |
| m | Mass of one molecule, shown in the Gas cell beside the molar mass it comes from. You cannot set it; the gas buttons do | kilogram | six significant figures, one per gas button: “6.64648e-27 kg” for He through “7.30795e-26 kg” for CO2, each beside its own molar mass. |
| threshold | The speed threshold, as a multiple of the rms speed rather than an absolute speed. The gold dashed rule on the drawing stands at it | dimensionless | 0.00 to 3.00 in steps of 0.01, printed beside the slider as “1.00 x v_rms” and again in the grid with the absolute speed and the percentage: “1.00 x v_rms = 493.169 m/s -> 39.16 %”. |
The row worth reading twice is the pressure. Its card is the only one on the panel that both sliders reach, and the relation above it is the only place the number density appears, which is why the speed cards sit still while it runs over three orders of magnitude. Set the same state in the ideal gas law calculator and you get the same pressure out of a temperature, which is the check this lab cannot run on itself.
The physics: one curve, one scale, and an axis with no numbers on it
Everything on the left of the screen comes out of one function of one variable: the fraction of molecules at each speed, for the gas and temperature you chose. The three cream rules are three summaries of that one curve, the gold rule is where you put it, and the shaded tail is the only thing on the canvas that the percentage refers to. There is no second scale anywhere in the picture.
The vertical axis is deliberately unlabelled with figures. It is a relative number of molecules per unit speed, and the lab says so in words rather than printing digits it could not honour, because the height of the curve depends on how the distribution is normalised while the shape and the shaded area do not. What you can read off the picture are positions along the bottom and areas under the curve, and those are exactly what the panel prints.
The threshold being a multiple rather than an absolute speed is the design decision that makes the headline result visible. Helium at 1000 K and carbon dioxide at 100 K are a factor of ten apart in rms speed, so no single m/s range would serve both; expressed as a multiple, the same setting is meaningful everywhere. That is why the percentage holds at 39.16 % across every gas and every temperature the controls can reach.
The panel prints one pressure, not two. The route through the number density and the rms speed and the route through PV = NkT are the same number once the speed comes from the temperature, so a pair of cards would agree at every slider position and prove nothing — the equation of state itself has its own page in the guide to the ideal gas law, and its own calculator above. What this lab shows instead is the part PV = nRT threw away: the mass and the speed of the molecules.
The three marker bands give their wording up in a fixed order as the canvas narrows, and each band degrades on its own rather than all three at once. The most probable speed is the first to shorten, from Most probable 402.670 m/s to Mode 402.670 m/s to Mode 402.670, because Mode is the narrow form of the same name and not a different quantity. A label that will not fit its band is clipped rather than shrunk into illegibility, and the card in the panel goes on printing Most probable speed whatever the drawing has had to do.
The third column below is the canvas’s own wording rather than the cards’. The most probable speed is labelled Most probable in the two widest rows and Mode in the three under them, which is the same band and the same figure under a shorter name.
| Viewport | Canvas in CSS pixels | The three marker bands write | Caption lines |
|---|---|---|---|
| 1280 | 480 by 458 | RMS speed 493.169 m/s · Mean speed 454.365 m/s · Most probable 402.670 m/s | three, every one in its longest form |
| 860 | 440 by 458 | RMS speed 493.169 m/s · Mean speed 454.365 m/s · Most probable 402.670 m/s | three; the tail line already shortened |
| 380 | 296 by 318 | RMS speed 493.169 m/s · Mean speed 454.365 m/s · Mode 402.670 m/s | three; the scale line shortened as well |
| 320 | 236 by 318 | RMS speed 493.169 m/s · Mean 454.365 m/s · Mode 402.670 m/s | three, all three shortened |
| 240 | 164 by 318 | RMS 493.169 · Mean 454.365 · Mode | two; the tail line has gone |
Read the third column across the rows rather than down them. At 320 px the rms band is still writing its longest form while the mean band has dropped the word speed and the most probable band has dropped two words; at 240 px the mode band is down to the bare word Mode while the other two still carry a figure. Each band is given its own width to spend, so the three are rarely on the same rung.
The caption strip is trimmed before the drawing is. At 240 px the line about the shaded tail has gone and the axis label has given up its own parenthesis, from Relative number of molecules (no scale) to Relative number of molecules, while the curve, the three cream rules, the gold rule and all four speed ticks are still there. Narrower still than any width here, a band that cannot fit even its shortest form is dropped rather than skipped, and one that is close is clipped rather than squashed — the lab’s own tests reach that clip at a canvas 82 px wide.
Where the kinetic theory of gases simulator breaks down
The lab solves its own model exactly, so nothing on the screen ever fails. Everything below is a limit of that model, of three sliders with finite stops, or of what one curve can carry — and each item says what this lab does about it.
- The molecules are assumed to be points that only touch each other in passing
- The model takes their own volume to be negligible against the container and takes them to exert no forces between collisions. Squeeze a real gas hard enough and both assumptions fail, in opposite directions: the first pushes the real pressure above the figure here and the second pulls it below. Nothing in the panel warns you when you have left that range, because nothing in the panel knows anything about the gas except its molar mass.
- Collisions are assumed perfectly elastic, and the lab cannot test it
- If a collision could lose kinetic energy the molecules would slow and the distribution would collapse on its own, so the whole curve rests on an idealisation the panel never checks. It is an assumption of the model rather than a property of any real gas, and the guide to elastic and inelastic collisions is where that idealisation is set out on its own terms.
- Only the translation shows up, which is why argon and carbon dioxide behave alike here
- A molecule that rotates or vibrates has energy that never reaches the wall, so the pressure card cannot see it: argon is a single atom and carbon dioxide is not, and the Pressure column is flat across both. How a gas stores that other energy is a different question with its own tools, and the guide to specific heat capacity is where it is answered. No figure for it appears on this panel.
- The temperature slider cannot land on the state the figures belong to
- It steps in whole kelvin between 100 and 1000, so 273.15 K is not one of its 901 positions and no drag reaches it. The preset pins the value instead and derives the thumb, which is why 493.169 m/s belongs to Ice point - N2 at 273.15 K and 493.033 m/s belongs to the slider at 273. The two differ by 0.136 m/s, and quoting either as the other would be wrong.
- Every card is an average over a crowd, and the crowd is broad
- The distribution is broad: 39.16 % of the gas is above the rms speed at any instant and 0.738 % is above twice it. A single figure is a description of the crowd and never of a molecule, so read the three cards as what they are and read the shaded tail beside them. The lab draws the spread precisely so that no one number can stand in for it.
- Nothing on the panel counts collisions or carries a wave
- Ask how far a molecule travels between collisions and this cluster has no number for you. Getting one means measuring a collision cross-section for the gas, and that measurement was not sourced for this build, so no figure for it is printed anywhere. The same molecules also carry sound, so a sound wave moves through the gas at a speed of the same order as the cards show — but nothing on this panel is a wave, and the guide to the speed of sound is where that belongs. No viscosity, no diffusion and no collision rate is reported either.
- The vertical axis carries no number, and that is a refusal rather than an omission
- The height of the curve depends on the normalisation chosen for it, so printing a scale there would be a claim the drawing could not honour. What the picture can support is a position along the bottom and an area underneath, and the panel publishes both. If you need a height at a given speed, this is not the tool, and nothing on the canvas should be measured with a ruler.
- One pressure is shown, and a second one would have proved nothing
- It would be easy to print the pressure a second way and call the agreement a result, but once the rms speed comes from the temperature the two expressions are the same number, so the pair could never disagree at any setting. The panel therefore prints one and leaves the cross-check to a different tool: the absolute zero calculator runs the temperature-to-speed step on its own, so the two halves can be checked separately.
- The pressure assumes a volume you cannot set
- The fixed line under the drawing says so: the figure is the pressure of a gas at the number density you chose, with the volume taken as one cubic metre. There is no volume control on this panel at all, which is deliberate — the number density already carries that information, and a second control for it would let you set two quantities that cannot disagree. The calculator for this relation is where a volume is a field you type into.
- Nothing on this panel was measured by anybody
- Three slider positions and a gas button go in, one distribution is evaluated, and the rest is arithmetic on two exact constants and a molar mass quoted from pages this site already publishes. That makes the lab a good place to settle what a speed average means and a poor place to find out what any particular sample of gas is doing. Treat every reading as the output of a model, and confirm it against a source of your own before quoting it anywhere.
Where the kinetic theory of gases simulator is actually used
- Settling which “average speed” a figure you have been handed is
- Somebody hands you a molecular speed without saying which average it is, and the three are far enough apart to matter: the ratio row puts the largest 22 per cent above the smallest. Load Ice point - N2 at 273.15 K and the cards read 402.670, 454.365 and 493.169 m/s, so a value near 454 is a mean and one near 493 is an rms. That test works on any state, because the ratio never moves.
- Showing that pressure does not depend on which gas is in the box
- This is the demonstration the first three presets exist for, and it takes about four seconds. Press them in turn and the Pressure card stays on 100.000 kPa while the rms card reads 493.169, then 1304.69, then 393.464 m/s. Students who expect a heavy gas to push harder usually need to see the pressure refuse to move rather than be told it will.
- Sizing the fast tail of a gas before you argue about it
- Reactions, evaporation and escape all depend on the molecules well above the average rather than on the average itself. Drag the threshold to 2.00 x v_rms and the row reads 0.738 %; to 3.00 and it reads 0.000589 %. Those two readings make the point that a tail can be both tiny and decisive better than any single average does.
- Separating what the temperature does from what the density does
- Two of the three sliders move the pressure and only one of them moves the speeds, which is the cleanest result on the panel. Hold the gas and drag each slider in turn: the speed cards answer the temperature alone, while Pressure answers both. The guide to the gas laws is where the same pressure, volume and temperature relations are set out as laws in their own right.
- Checking a published molecular speed in a few seconds
- Pick the gas, drag the temperature to the one you were given, and read the card the quoted figure claims to be. The lab reaches 5 gases and 901 whole-kelvin temperatures, which covers most of what a textbook will hand you, and the Gas cell shows the molar mass it used so you can see whether that part agrees too. Where the state you want is not on the sliders, type it into the calculator instead.
- Teaching the difference between a distribution and its summary
- Three cards, one curve and a shaded tail make the point in one screen: the cards are summaries, the curve is the thing, and the tail is what the summaries hide. Drag the threshold slowly from 0.00 to 3.00 and watch a percentage fall from 100.00 % to 0.000589 % while all three cards sit perfectly still. The cards are not wrong; they are simply not the whole answer.
- Setting up the next question, which is what happens to the energy
- Once the speeds are on the screen the obvious follow-up is what a gas does with that energy when you heat it or let it push on something. That is a different subject with its own tools: the guide to the first law of thermodynamics is where the bookkeeping starts, and the ideal gas law lab is the neighbouring panel where pressure, volume and temperature move against each other directly.
Where to go next
Everything this panel assumes rather than shows is in Kinetic Theory of Gases: the model stated from the beginning, each assumption named, the step that puts a third in front of the whole thing, and problems worked through from their own numbers. If typing suits you better than dragging, the calculator for the same relation heads the list below.
The neighbouring questions have tools of their own. The guide to the ideal gas law is the equation of state these molecules add up to and the guide to the gas laws covers the five relations that follow from it, with the guide to Boyle's law for the constant-temperature case on its own.
Further out, the guide to heat against temperature is worth reading before anyone calls a fast molecule a hot one, and the guide to absolute zero takes the same rms speed down the temperature scale. The rest is in the library of physics simulations, the calculator index and the blog.
Frequently asked questions
Why does the Pressure card not move when I press the helium button?
Because the pressure does not know the molecular mass, and watching that happen is the point of the first three presets. Press Helium, same temperature and every speed card changes while Pressure holds at 100.000 kPa; press Carbon dioxide, same temperature and it holds there again. The helium molecules are faster in exactly the proportion that they are lighter, so the product that sets the pressure comes out the same.
Why is the threshold a multiple of the rms speed rather than a speed in m/s?
Because one absolute range could not serve the whole lab. Helium at 1000 K reads 2496.36 m/s on the RMS speed card and carbon dioxide at 100 K reads 238.070 m/s, so a slider in m/s would be useless at one end or the other. As a multiple it also makes the invariance visible: at 1.00 x v_rms the threshold row ends in 39.16 % for every gas and every temperature the controls can reach.
I dragged the temperature slider to 273 and the RMS speed card reads 493.033 m/s, not 493.169. Why?
Because the slider is whole-number and the ice point is not. The Ice point - N2 at 273.15 K preset pins the exact temperature and then puts the thumb at 273, so the card reads 493.169 m/s while the thumb sits where a hand-drag would also leave it. Touch that slider and the pin is dropped: the temperature really is 273 K from then on, and 493.033 m/s is the honest reading for it.
Why are there three speed cards instead of one average?
Because a gas has a distribution of speeds rather than one speed, and the three usual averages of that distribution are three different numbers. On the opening state the cards read 402.670, 454.365 and 493.169 m/s, always in that order. The drawing marks all three on the one curve so you can see how far apart they are, and the grid row underneath prints the ratio they stand in.
Why does the ratio row never change when I move the sliders?
Because it cannot. The row headed v_p : v_bar : v_rms reads 1 : 1.12838 : 1.22474 at every setting the controls can reach, for every gas and every temperature, and that invariance is why it is on the panel at all. Change the gas and all three speeds move together; change the temperature and they move together again. The row is there to show you what does not move.
Why is the number density written 2.65165e+25 per m3 rather than with a superscript?
Because the fonts this site serves have no superscript or subscript glyphs, so a superscript would draw as an empty box on some machines. The unit is spelled out instead, and the exponent keeps its plus sign. The slider underneath is in units of 1e25, which is why its own row reads 2.65165 while the grid cell reads the full figure with its unit.
The Pressure card switched from kPa to MPa on me. What are its limits?
The card picks its unit from the rounded figure, and the two sliders between them set how far it can go. Both at their lowest stops, 100 K and 0.10, it reads 1.38065 kPa; both at their highest, 1000 K and 10.00, it reads 1.38065 MPa. Those five digits really are the same at both ends, because ten times the temperature and a hundred times the density come to exactly a thousand times the pressure.
Does the lab draw the molecules bouncing around in a box?
No, and deliberately not. What is drawn is the distribution of their speeds: molecular speed along the bottom, a relative number of molecules up the side with no figure on that axis, three cream rules at the three averages and a shaded tail beyond the gold dashed threshold. Nothing moves on its own. The lab on absolute zero is the one with the box of moving molecules in it.
References & formula source
- Every figure on this panel comes out of two exact constants and one molar mass, and nothing is fitted. The Boltzmann constant is 1.380649e-23 J/K, exact by the 2019 definitions of the SI units and confirmed for this build against the NIST CODATA page for it, and the Avogadro constant is exact for the same reason; the lab prints the first of them on itself and computes the molar gas constant from the pair rather than typing it. The mass of one molecule is the molar mass divided by the Avogadro constant, which is where the Gas cell gets the second figure it prints.
- The five molar masses are quoted from pages this site already publishes rather than introduced here, so this lab cannot contradict them: 4.002602, 28.0134, 31.9988 and 44.0095 g/mol come from the absolute zero lab and 39.948 g/mol from the speed of sound lab. The Gas cell prints each to the same significant figures as the page it came from, which is why argon shows five, helium seven and the rest six.
- The number density the presets pin, 2.65165e+25 per m3, is the state 100 kPa and 273.15 K correspond to, and 100 kPa rather than one standard atmosphere is the reference pressure this site standardises on across its gas tools. That choice is what makes a mole of gas fill 22.711 litres here, which is the figure our own guide to Avogadro's law publishes and argues for. Changing the reference would have made this lab disagree with that page on its headline figure.
- The three speed statistics and the ratios between them are the model definition rather than a measurement, and the wording is Wikipedia article on the kinetic theory of gases, retrieved for this cluster on 2026-10-13, which states that the most probable speed is 81.6 per cent of the root-mean-square speed and the mean speed is 92.1 per cent of it for an isotropic distribution of speeds. The panel prints that as the ratio row, 1 : 1.12838 : 1.22474, which is the same statement with the most probable speed as the unit.
- The percentage in the threshold row is the area under the drawn curve to the right of the gold rule, computed from the cumulative distribution rather than measured off the picture. It is 39.16 per cent at one times the rms speed and 0.738 per cent at twice it, and those two numbers hold for every gas and every temperature the controls reach, which the lab's own tests check at all 301 threshold positions. The curve and the shaded area are drawn from the same function the percentage comes from, so the picture and the figure cannot disagree.
- Five assumptions sit under everything here, and the lab tests none of them: the molecules are points with no volume of their own, there are enough of them for statistics, their collisions are perfectly elastic, those collisions are strictly in pairs and uncorrelated, and between collisions the molecules exert no forces on one another. They are the model definition, listed on the same Wikipedia article. A real gas squeezed hard enough breaks the first two of them in opposite directions, which is a question for an equation of state rather than for this panel.
- Every readout figure quoted on this page is a string this simulation printed for the button or the slider position named beside it, read back out of the running lab in a browser rather than worked out by hand. Each is computed from the exact value and rounded once, so re-deriving one printed figure from another will not always reproduce the last digit. The two figures here that are not readouts say so where they appear: the speed axis maximum and the canvas sizes come from the lab's own axis and layout functions. Where a figure here and the lab part company, believe the lab, and verify anything you rely on before quoting it.
- Further reading: Kinetic theory of gases — Wikipedia