The geostationary orbit simulator is a free interactive lab built around a claim that is easy to state and hard to picture: there is exactly one orbit that holds still over a point on the ground, and it needs three separate things to be true at once. The panel plots the ground track over three successive days and puts a figure on each of the three. Hold all of them and the verdict cell reads Geostationary - a single fixed point; break one and it reads something else, and the cards say by how much.
Geostationary Orbit
A geostationary orbit is not simply "the 24-hour orbit". It is the one orbit that satisfies three conditions at once: a period of one sidereal day, zero inclination and zero eccentricity. Break any one of them and the fixed dot in the sky becomes a figure-eight, a sideways slide or a steady march. The plot is the ground track over three successive days; the cards say by exactly how much.
Load a real orbit onto the ground track
The first five buttons press the lab’s own five preset buttons, and one of them is the only way to reach an exactly 24-hour period, because that value is not on its slider’s grid. The last two do what a visitor does next: press a preset, then drag a single control and watch which readings survive. Work down the list: button one is the definition, buttons two to four break one condition each, button five takes the tilt far past anything small, and the last two combine faults and drop a pin.
Pick an orbit above, or drag the three sliders yourself.
What Is the Geostationary Orbit Simulator?
The geostationary orbit simulator is a free interactive physics lab that runs in your browser, with nothing to install and no sign-up. It plots the ground track — where a satellite sits in the sky as seen from the ground — over three successive sidereal days, on a bare frame of longitude offset against latitude. Hold all three conditions and the three days collapse onto one marker. Break one and the marker becomes a shape.
Three sliders and four button rows drive it. Inclination runs 0 to 65 deg in steps of 0.1, Eccentricity runs 0 to 0.300 in steps of 0.001, and Period offset runs −5.00 to +5.00 min in steps of 0.05. Three condition buttons break one condition at a time — Tilt it, Stretch it, Mis-time it — five presets load a published state, an axis toggle swaps Fit each axis for Same scale both axes, and Reset puts all three conditions back. The two WGS-84 constants and the nominal period are fixed and printed on the lab itself, which is what keeps the control count at three.
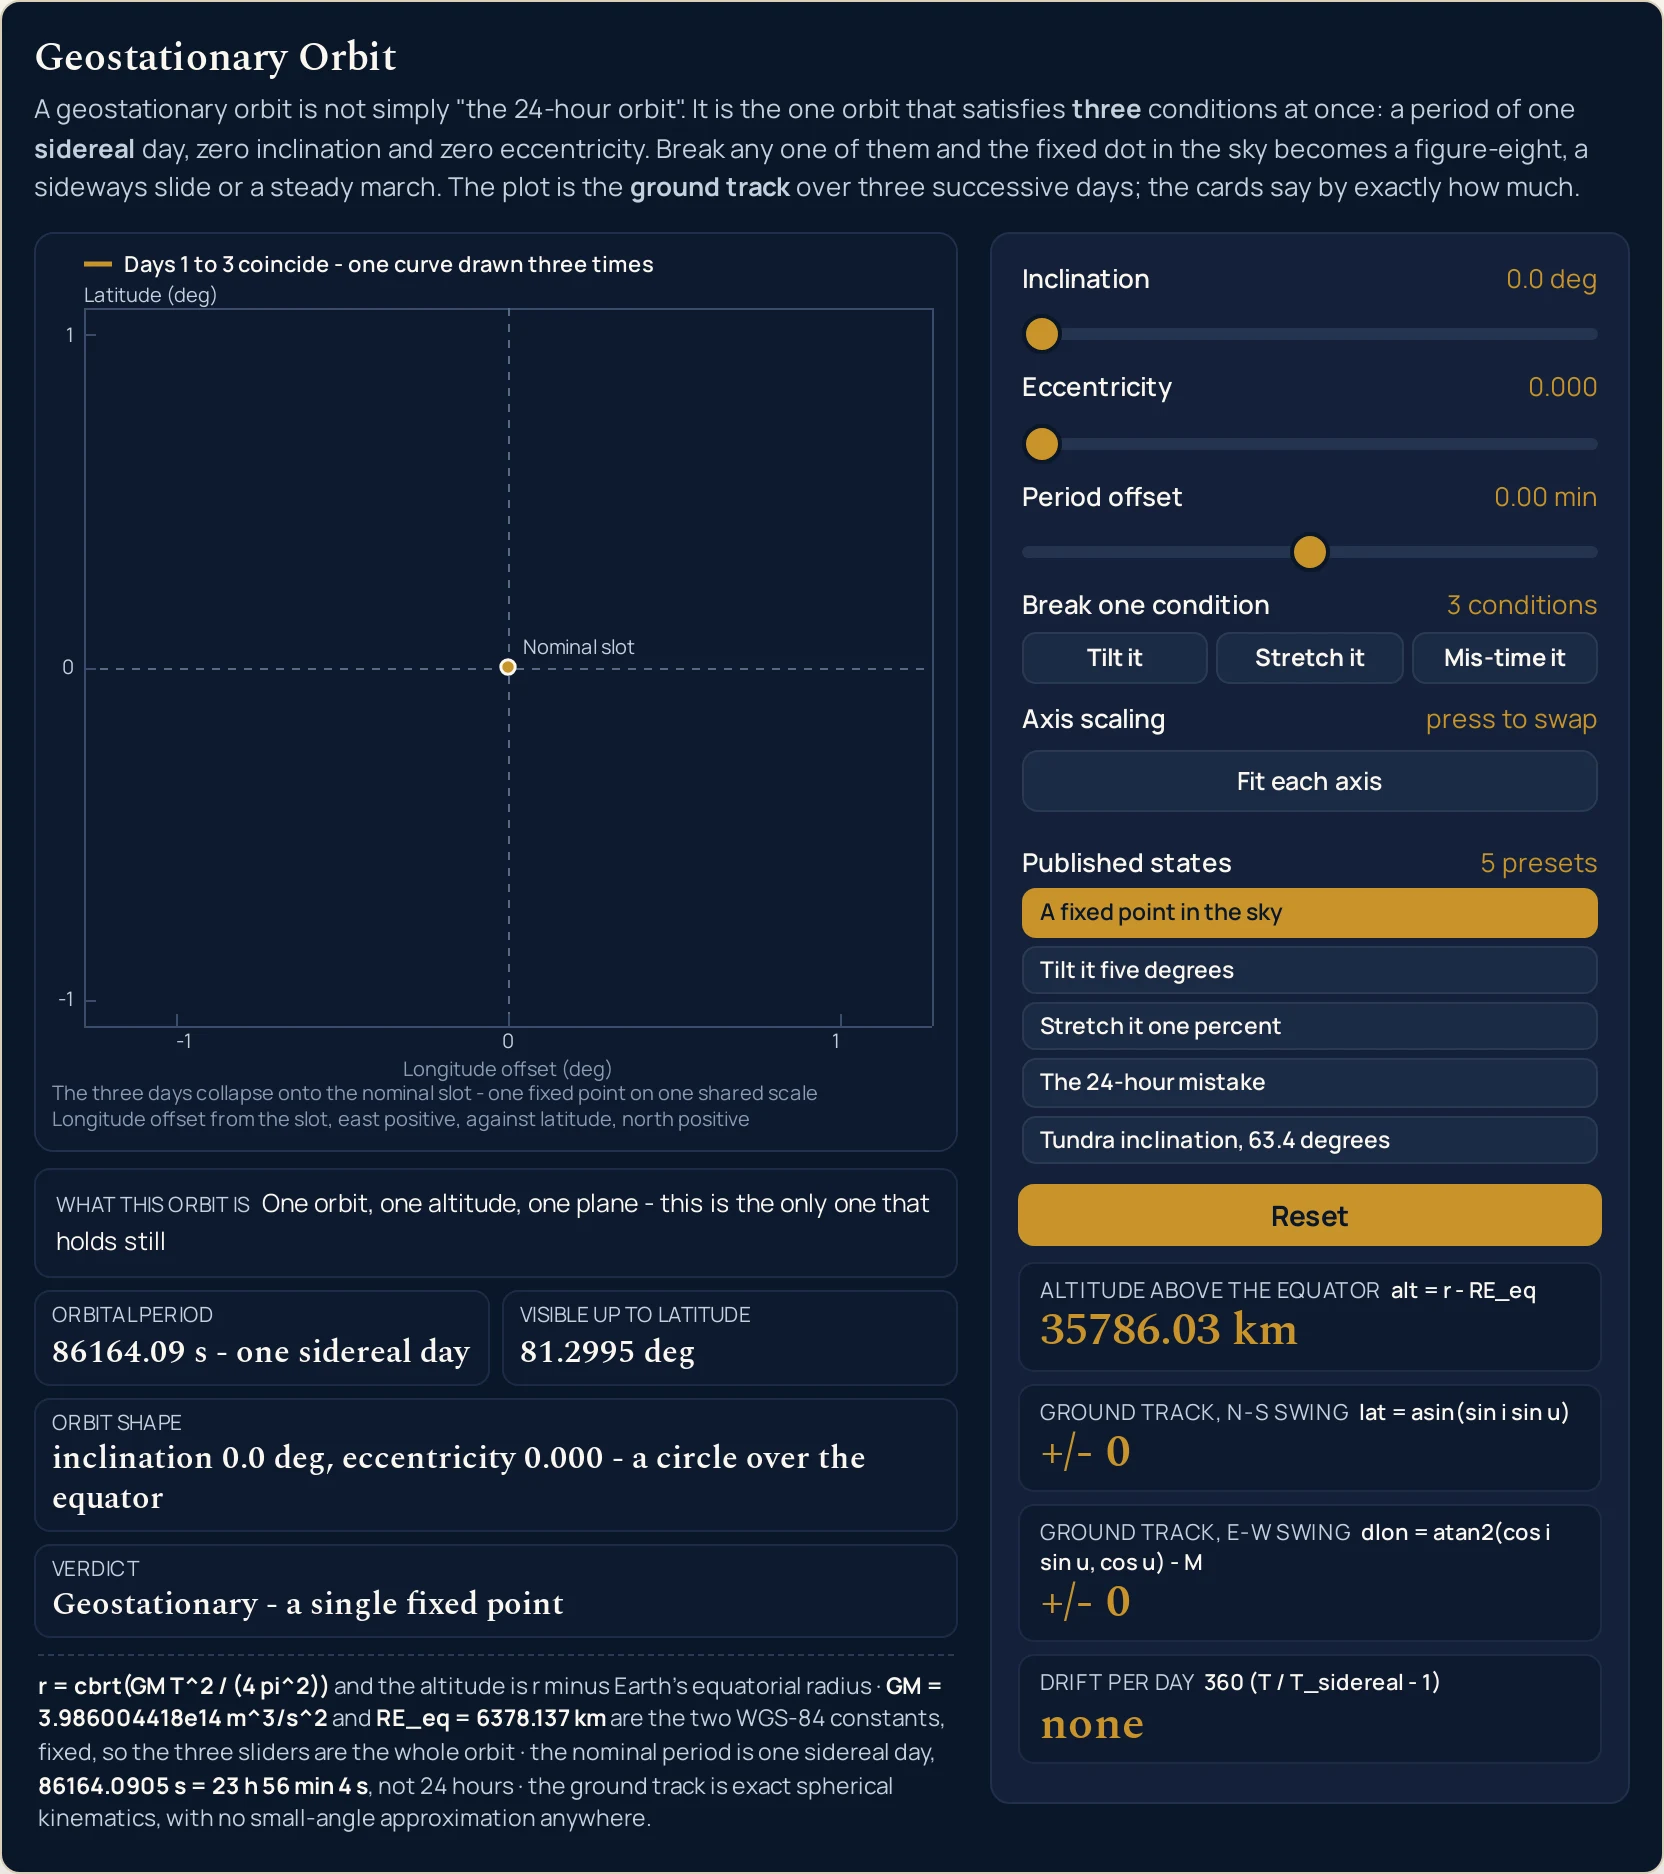
Eight readouts answer. Four cards give Altitude above the equator, Ground track, N-S swing, Ground track, E-W swing and Drift per day, each printed under the relation that produced it; a compact grid adds the Orbital period, the Visible up to latitude, the Orbit shape and a one-line Verdict; and a sentence strip under the drawing makes the eighth. On the opening state those read 35786.03 km, +/- 0, +/- 0, none, 86164.09 s - one sidereal day, 81.2995 deg and Geostationary - a single fixed point.
One of the eight is the argument of the lab rather than an output of it. The Verdict cell has four fixed strings and they are not synonyms: Geostationary - a single fixed point, Geosynchronous - it slides east and west, Geosynchronous - it traces a figure-eight and Not even geosynchronous - it marches away. Only the first needs all three conditions at once, and which of the other three you get says which condition you broke.
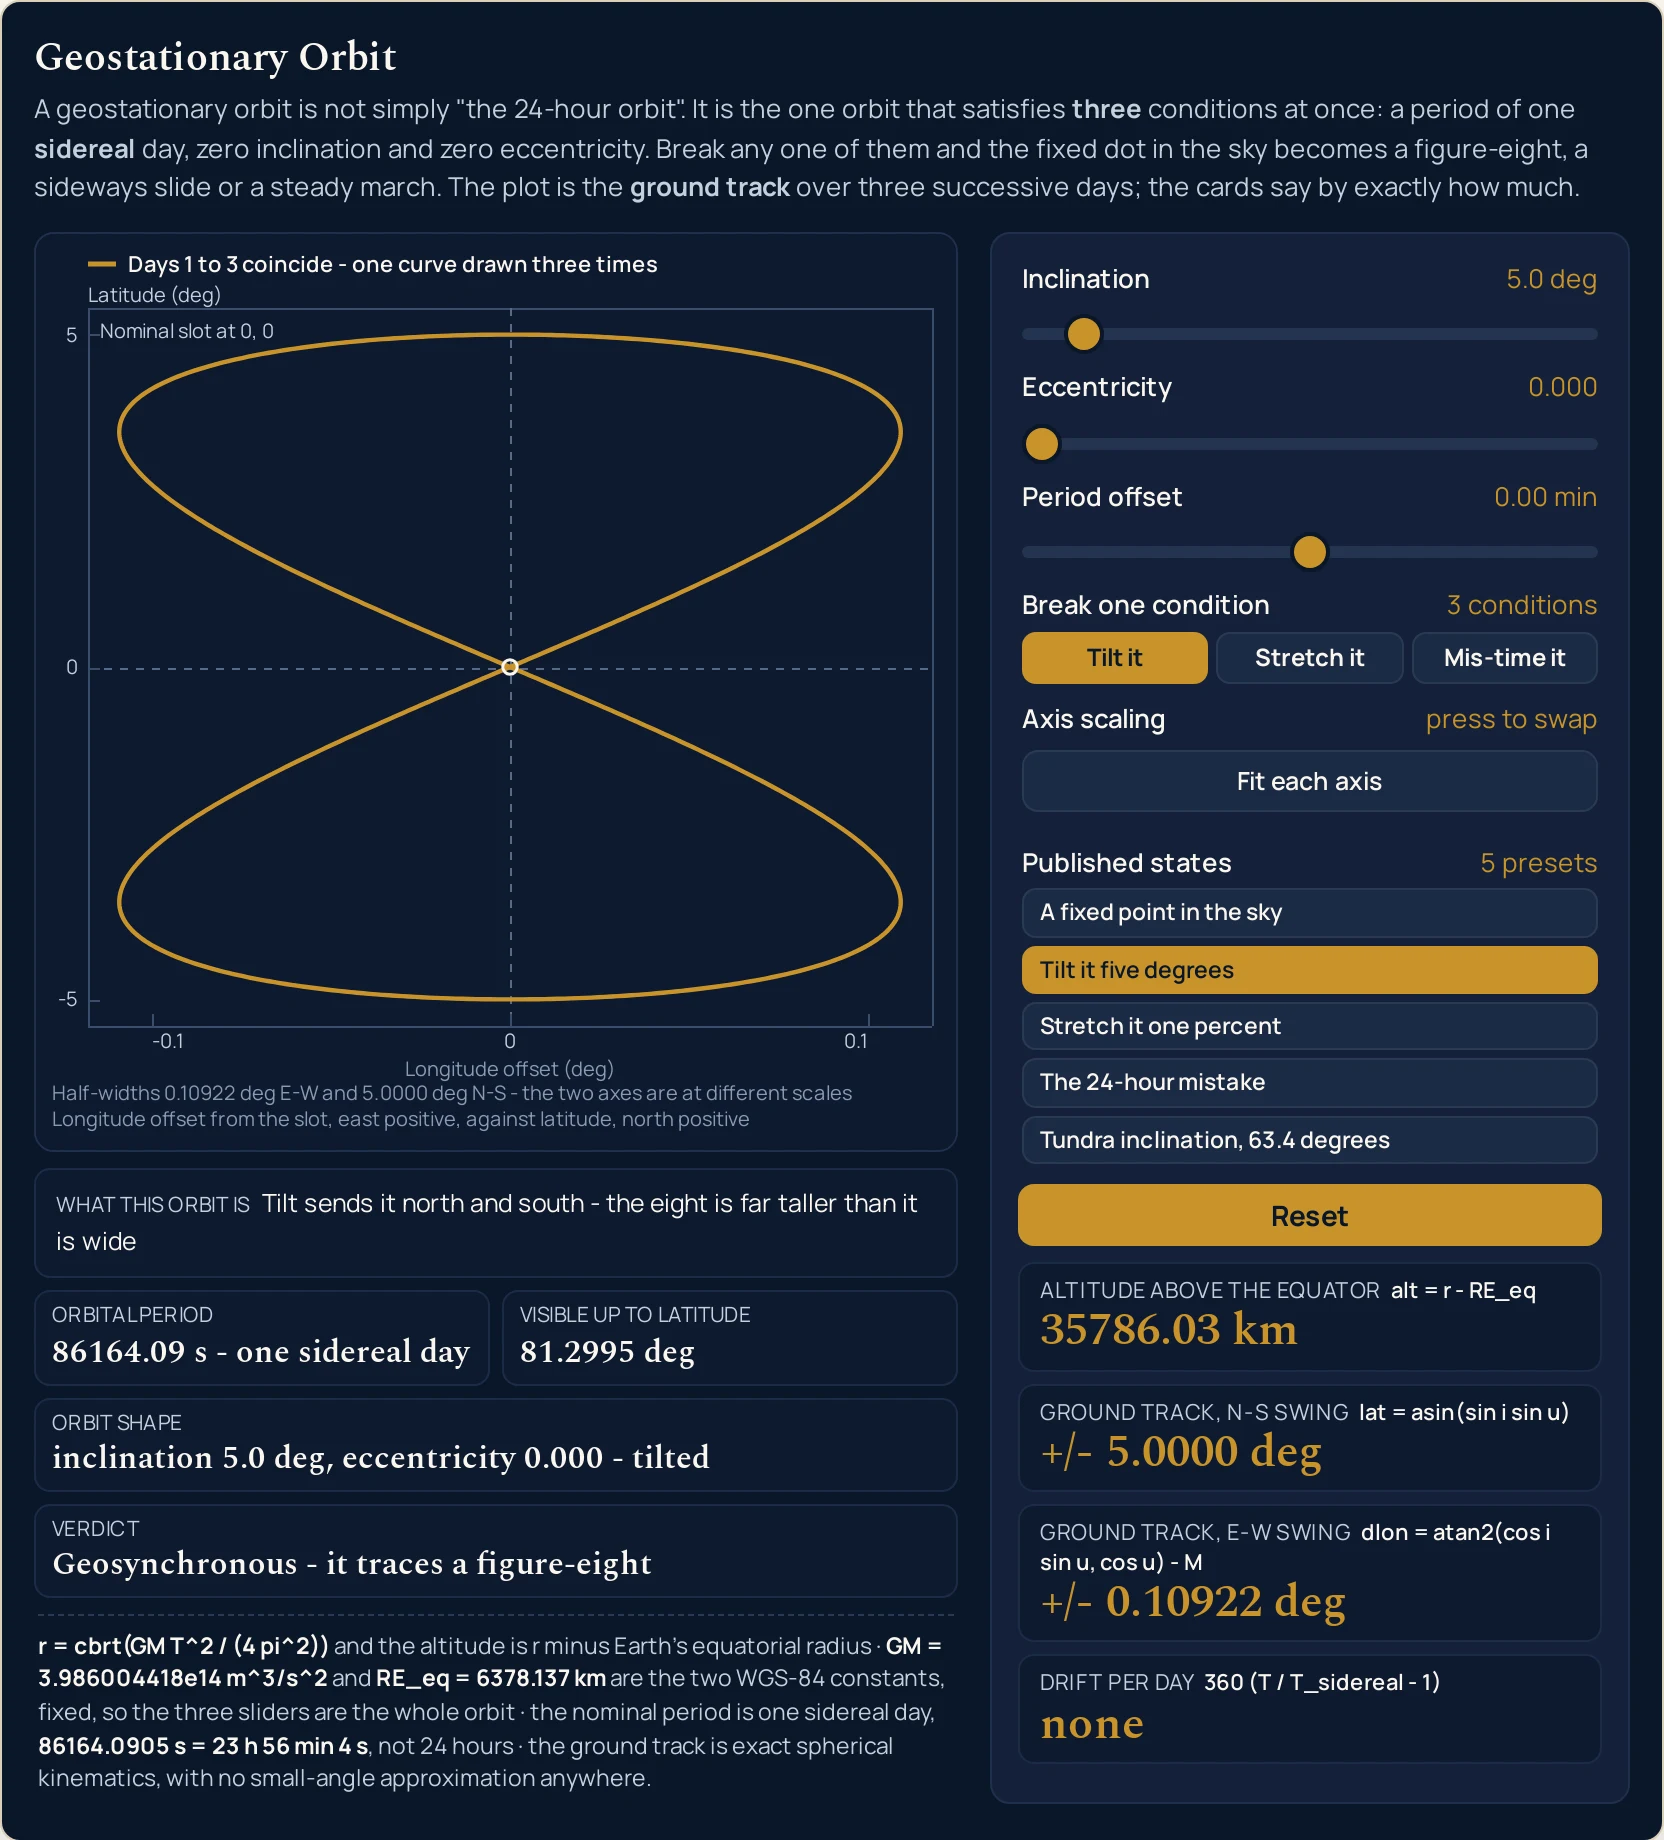
Press Tilt it five degrees and the swing cards open to +/- 5.0000 deg north-south against +/- 0.10922 deg east-west; press Stretch it one percent and they read +/- 0 against +/- 1.1459 deg. The altitude card does not move off 35786.03 km for either of them, and only the period offset ever changes it.
What the picture does not contain, it says. There is no map, no coastline, no globe and no Earth disc, no view of the orbit in space, no ellipse around a central body and no satellite of any kind: the drawing is three closed curves, one marked nominal slot and a bare pair of axes. Because a figure-eight at this altitude is tens of times taller than it is wide, the two axes are fitted separately by default and the caption declares it in words, with a toggle that draws the true shape instead. Nothing here computes an orbital speed, an angular velocity or a force.
| Control | Range | Step or default |
|---|---|---|
| Inclination | 0 to 65 deg | step 0.1; opens at 0 |
| Eccentricity | 0 to 0.300 | step 0.001; opens at 0 |
| Period offset | minus 5.00 to plus 5.00 min | step 0.05; opens at 0.00; one preset pins 3.931825 |
| Buttons | three conditions, five presets, Reset | one press each, plus an axis-scaling toggle |
How to use the geostationary orbit simulator
- The lab loads with all three conditions already held, so begin by reading what it says. Not a single press is needed to get an answer out of it: Altitude above the equator 35786.03 km, Ground track, N-S swing +/- 0, Ground track, E-W swing +/- 0 and Drift per day none. Beside each card’s heading is the relation that produced its figure, so no answer arrives unexplained.
- Find those zeros in the drawing. One small ring marks the nominal slot at the centre of the frame, and the three day-curves have collapsed onto it. The caption says so rather than naming a swing: The three days collapse onto the nominal slot - one fixed point on one shared scale. That picture is the definition, and everything else on this page is a departure from it.
- The compact grid under the drawing asks four questions about the orbit, not about the track. Orbital period gives 86164.09 s - one sidereal day, Visible up to latitude gives 81.2995 deg, Orbit shape gives inclination 0.0 deg, eccentricity 0.000 - a circle over the equator and Verdict gives Geostationary - a single fixed point. The first three describe the orbit; the fourth classifies it.
- Press one condition button and count what moves. Tilt it takes the north-south card to +/- 5.0000 deg and the east-west one to +/- 0.10922 deg, and clears the other two conditions as it goes. The altitude card does not move off 35786.03 km, and the drift card stays on none. Each of the three buttons breaks exactly one condition and puts the other two back.
- Press Stretch it and compare the two swings. One per cent of eccentricity gives +/- 0 north-south and +/- 1.1459 deg east-west, so the figure that was the smaller of the pair a moment ago is now ten times larger than the five-degree tilt managed. The verdict changes too, from Geosynchronous - it traces a figure-eight to Geosynchronous - it slides east and west.
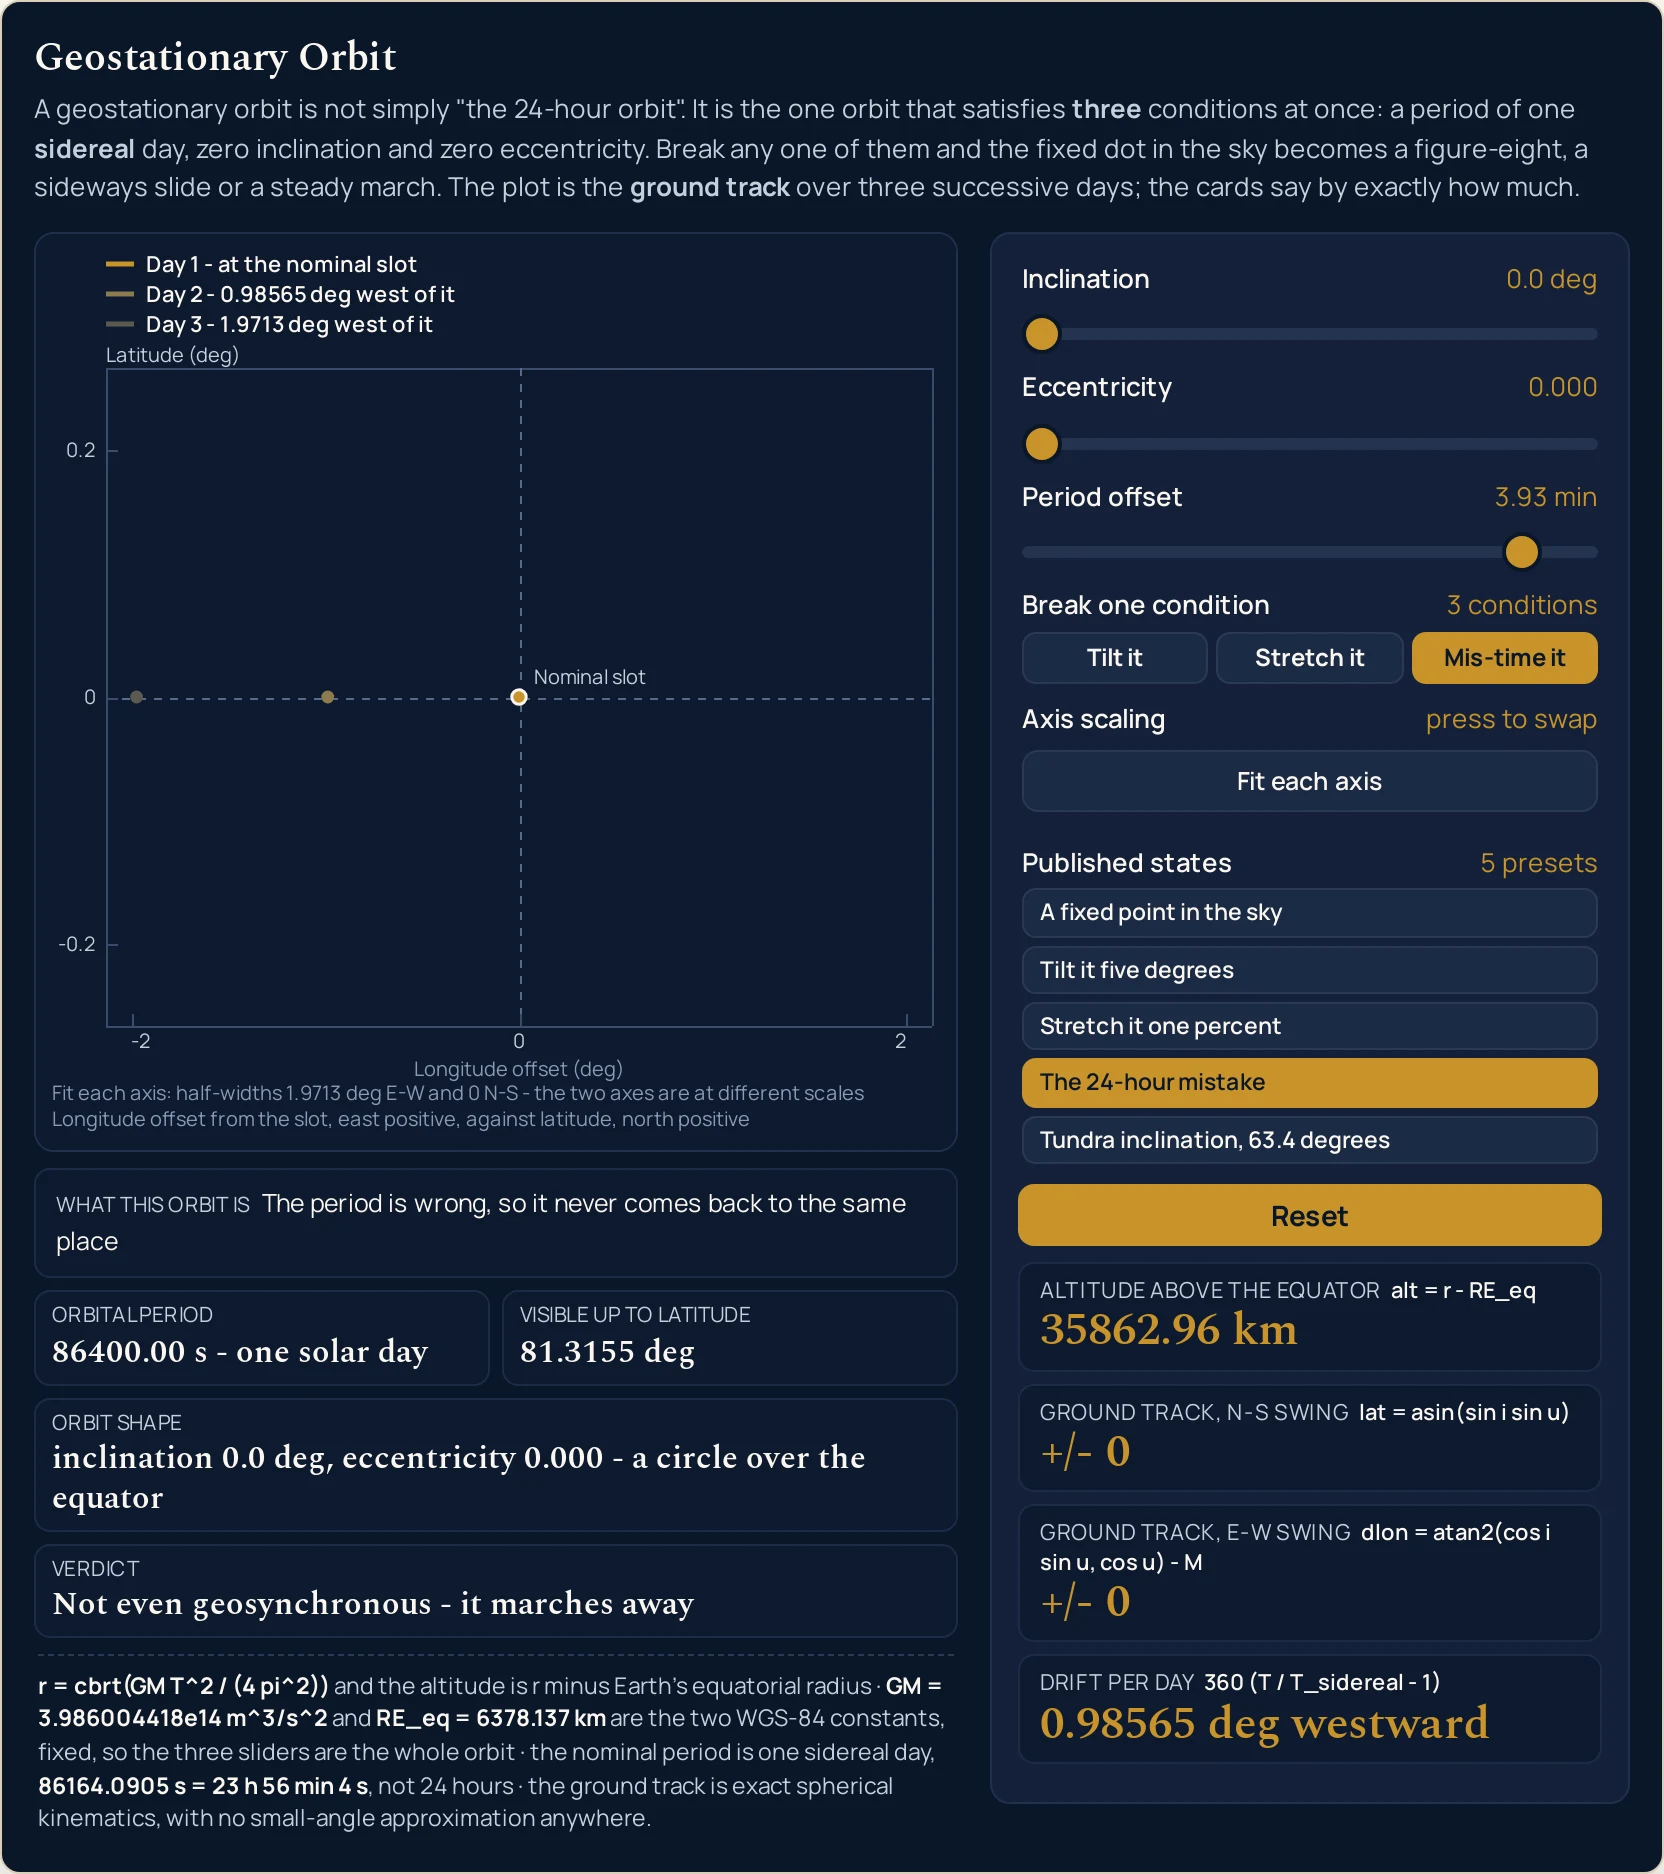
- Press Mis-time it and watch the drawing stop coming back to the same place. The period cell jumps to 86400.00 s - one solar day, both swing cards fall back to +/- 0, and Drift per day reads 0.98565 deg westward. With no swing left to draw, each day shrinks to a single marker and three of them appear, each with its own band: Day 1 - at the nominal slot, Day 2 - 0.98565 deg west of it, Day 3 - 1.9713 deg west of it.
- Drag the inclination slider and watch the two swings part company. Across its 651 positions the north-south card tracks the slider exactly, from +/- 0.10000 deg at the smallest non-zero step to +/- 65.000 deg at the top, while the east-west card runs from +/- 0.002618 arcmin to +/- 23.945 deg. They are not the same quantity in different clothes, and the drawing makes the gap between them visible.
- Drag the eccentricity slider and watch the north-south card refuse to answer. From 0.001 to 0.300 the east-west card runs from +/- 0.11459 deg to +/- 34.749 deg while Ground track, N-S swing prints the bare +/- 0 in every one of those 300 positions. That flat column is the whole reason the panel carries two swing cards and not one.
- Drag the period offset and watch four readouts answer at once. This is the only slider that moves the altitude card, and it moves the period cell, the drift card and the visibility limit with it: from 35688.11 km to 35883.85 km, and from 81.2791 deg to 81.3198 deg. Neither swing card moves at all while you do it.
- Press the axis toggle and see what the default was hiding. With the five-degree tilt loaded, Fit each axis gives a caption of Fit each axis: half-widths 0.10922 deg E-W and 5.0000 deg N-S - the two axes are at different scales. Press Same scale both axes and the figure-eight collapses to a near-vertical sliver, which is its true proportion.
- Reach for a preset when the exact state matters. Four of the five sit on their sliders’ own grids and a careful drag will reach them, but the 24-hour one will not: 3.931825 minutes falls between 3.90 and 3.95, so the preset pins it and derives the thumb. Touching that slider drops its pin alone and leaves the other two standing.
- Press Reset when you have lost track. It puts all three conditions back at once and returns the verdict cell to Geostationary - a single fixed point. Only one preset is ever shown as pressed, and the highlight goes as soon as you touch a slider yourself.
- Read the fixed line last of all. It gives the relation the radius comes from, the two WGS-84 constants held fixed, the nominal period as 86164.0905 s = 23 h 56 min 4 s with the note that this is not 24 hours, and the statement that the ground track uses no small-angle approximation anywhere. Those four clauses are every assumption the drawing and the cards rest on.
The third slider offsets a period rather than setting one, which is a fair description of this lab but a poor one of most problems. When the figure you already have is a period in its own right, or a central mass that is not this planet’s, the Kepler’s third law calculator takes both typed and returns the radius, about 42,164 km for this case. For what a geostationary orbit is, how it differs from a geosynchronous one and the problems worked end to end, read the full guide to the geostationary orbit.
Worked example: change one thing at a time
One press or one drag produced each row below, and no cell was typed by hand: every one is a string the lab itself put on the screen. The published states lead, and the three tables that follow each freeze two sliders and sweep the third — which is the only honest way to find out what a given control is permitted to change.
| Preset button | Altitude above the equator | Ground track, N-S swing | Ground track, E-W swing | Drift per day | Verdict |
|---|---|---|---|---|---|
| A fixed point in the sky | 35786.03 km | +/- 0 | +/- 0 | none | Geostationary - a single fixed point |
| Tilt it five degrees | 35786.03 km | +/- 5.0000 deg | +/- 0.10922 deg | none | Geosynchronous - it traces a figure-eight |
| Stretch it one percent | 35786.03 km | +/- 0 | +/- 1.1459 deg | none | Geosynchronous - it slides east and west |
| The 24-hour mistake | 35862.96 km | +/- 0 | +/- 0 | 0.98565 deg westward | Not even geosynchronous - it marches away |
| Tundra inclination, 63.4 degrees | 35786.03 km | +/- 63.400 deg | +/- 22.423 deg | none | Geosynchronous - it traces a figure-eight |
Follow the altitude column downwards instead of reading a row at a time. Four of the five rows print the identical string 35786.03 km, and the one that does not is the row where the period changed. Tilting an orbit or stretching it moves the satellite around a good deal without raising or lowering it, which surprises most people the first time they watch the card refuse to answer.
Rows 2 and 3 are the comparison this lab exists for. Five degrees of tilt buys +/- 0.10922 deg of east-west motion; one per cent of eccentricity buys +/- 1.1459 deg. Derived from those two cards, not a readout: 1.1459 divided by 0.10922 is 10.49. Shape moves a satellite sideways an order of magnitude more effectively than tilt does, and the cube root behind the altitude is the reason the guide to Kepler’s laws is where that arithmetic is worked rather than here.
Row 4 is where this table stops being about the shape of an orbit and starts being about its clock. It is the only one where both swing cards read +/- 0 and the orbit is still wrong, because nothing oscillates: it marches. The verdict drops the word geosynchronous entirely, to Not even geosynchronous - it marches away, and the strip under the drawing puts it in the lab’s own plainer words: The period is wrong, so it never comes back to the same place.
The inclination slider on its own
Press Reset first, so the eccentricity and the period offset are both zero, and then move only the inclination. The verdict cell is not a column below because it prints Geosynchronous - it traces a figure-eight in all twelve rows, and the drift card prints none in all twelve as well. Rows 5 and 6 are one step of the slider apart and straddle the formatter’s own switch.
| Inclination slider | Ground track, N-S swing | Ground track, E-W swing | Orbit shape cell |
|---|---|---|---|
| 0.1 deg | +/- 0.10000 deg | +/- 0.002618 arcmin | inclination 0.1 deg, eccentricity 0.000 - tilted |
| 1.0 deg | +/- 1.0000 deg | +/- 0.2618 arcmin | inclination 1.0 deg, eccentricity 0.000 - tilted |
| 2.0 deg | +/- 2.0000 deg | +/- 1.047 arcmin | inclination 2.0 deg, eccentricity 0.000 - tilted |
| 3.0 deg | +/- 3.0000 deg | +/- 2.357 arcmin | inclination 3.0 deg, eccentricity 0.000 - tilted |
| 4.7 deg | +/- 4.7000 deg | +/- 5.790 arcmin | inclination 4.7 deg, eccentricity 0.000 - tilted |
| 4.8 deg | +/- 4.8000 deg | +/- 0.10065 deg | inclination 4.8 deg, eccentricity 0.000 - tilted |
| 5.0 deg | +/- 5.0000 deg | +/- 0.10922 deg | inclination 5.0 deg, eccentricity 0.000 - tilted |
| 10.0 deg | +/- 10.000 deg | +/- 0.43856 deg | inclination 10.0 deg, eccentricity 0.000 - tilted |
| 15.0 deg | +/- 15.000 deg | +/- 0.99312 deg | inclination 15.0 deg, eccentricity 0.000 - tilted |
| 30.0 deg | +/- 30.000 deg | +/- 4.1172 deg | inclination 30.0 deg, eccentricity 0.000 - tilted |
| 63.4 deg | +/- 63.400 deg | +/- 22.423 deg | inclination 63.4 deg, eccentricity 0.000 - tilted |
| 65.0 deg | +/- 65.000 deg | +/- 23.945 deg | inclination 65.0 deg, eccentricity 0.000 - tilted |
The second column is the slider and the third is the surprise. North-south is the inclination to the last digit the formatter will print, so that column tells you nothing you did not already set. East-west grows far faster than the slider does: five times the tilt is not five times the wobble. A tall, thin figure-eight is what the ground track of a tilted orbit actually looks like, and the guide to circular motion is where the motion underneath it is set out.
Rows 5 and 6 are one step apart and change unit. At 4.7 degrees the card reads +/- 5.790 arcmin and at 4.8 degrees it reads +/- 0.10065 deg, because the formatter decides on the rounded figure and a tenth of a degree is where it changes its mind. Nothing physical happens at that step; it is a reading convention, and it is worth knowing before you quote two rows of this table side by side.
The eccentricity slider on its own
Press Reset again, so the inclination and the period offset are both zero, and move only the eccentricity. The north-south column is the point of this table: it prints the bare +/- 0 in every row, because an orbit stretched in its own plane never leaves the equator. The verdict cell reads Geosynchronous - it slides east and west throughout.
| Eccentricity slider | Ground track, N-S swing | Ground track, E-W swing | Orbit shape cell |
|---|---|---|---|
| 0.001 | +/- 0 | +/- 0.11459 deg | inclination 0.0 deg, eccentricity 0.001 - stretched |
| 0.002 | +/- 0 | +/- 0.22918 deg | inclination 0.0 deg, eccentricity 0.002 - stretched |
| 0.010 | +/- 0 | +/- 1.1459 deg | inclination 0.0 deg, eccentricity 0.010 - stretched |
| 0.020 | +/- 0 | +/- 2.2919 deg | inclination 0.0 deg, eccentricity 0.020 - stretched |
| 0.050 | +/- 0 | +/- 5.7312 deg | inclination 0.0 deg, eccentricity 0.050 - stretched |
| 0.100 | +/- 0 | +/- 11.472 deg | inclination 0.0 deg, eccentricity 0.100 - stretched |
| 0.200 | +/- 0 | +/- 23.026 deg | inclination 0.0 deg, eccentricity 0.200 - stretched |
| 0.300 | +/- 0 | +/- 34.749 deg | inclination 0.0 deg, eccentricity 0.300 - stretched |
The first row is the one that settles the argument. The smallest eccentricity this slider can ask for, a single thousandth, already swings the track +/- 0.11459 deg east and west — more than a whole degree of tilt buys in the table above, and more, in fact, than the five-degree tilt of the preset manages. The shape of the orbit, not its angle, is what slides a satellite along the equator.
The east-west column is very nearly a straight line in this table, and the one above is not. Doubling the eccentricity doubles the swing to the digit the card prints: 0.001 gives +/- 0.11459 deg and 0.002 gives +/- 0.22918 deg. Those two different growth rates are why the panel keeps the two faults on separate sliders rather than offering one control for how wrong the orbit is.
The period offset slider on its own
Reset once more and move only the third slider. These are the readouts the other two cannot reach: the altitude card, the period cell, the drift card and the visibility limit all answer this control alone, while both swing cards print +/- 0 in every row below. The two middle rows at 3.93 and 3.95 minutes are the pin and the thumb, and they are different states.
| Period offset slider | Altitude above the equator | Drift per day | Orbital period cell | Visible up to latitude |
|---|---|---|---|---|
| -5.00 min | 35688.11 km | 1.2534 deg eastward | 85864.09 s - 5.00 min short | 81.2791 deg |
| -1.00 min | 35766.46 km | 0.25068 deg eastward | 86104.09 s - 1.00 min short | 81.2954 deg |
| -0.40 min | 35778.20 km | 0.10027 deg eastward | 86140.09 s - 0.40 min short | 81.2979 deg |
| -0.35 min | 35779.18 km | 5.264 arcmin eastward | 86143.09 s - 0.35 min short | 81.2981 deg |
| 0.00 min | 35786.03 km | none | 86164.09 s - one sidereal day | 81.2995 deg |
| 0.05 min | 35787.01 km | 0.7521 arcmin westward | 86167.09 s - 0.05 min long | 81.2997 deg |
| 0.35 min | 35792.88 km | 5.264 arcmin westward | 86185.09 s - 0.35 min long | 81.3009 deg |
| 0.40 min | 35793.86 km | 0.10027 deg westward | 86188.09 s - 0.40 min long | 81.3011 deg |
| 1.00 min | 35805.60 km | 0.25068 deg westward | 86224.09 s - 1.00 min long | 81.3036 deg |
| 3.93 min (preset, pinned) | 35862.96 km | 0.98565 deg westward | 86400.00 s - one solar day | 81.3155 deg |
| 3.95 min (the thumb) | 35863.31 km | 0.99020 deg westward | 86401.09 s - 3.95 min long | 81.3156 deg |
| 5.00 min | 35883.85 km | 1.2534 deg westward | 86464.09 s - 5.00 min long | 81.3198 deg |
Rows 10 and 11 are the same thumb position and two different answers. The preset pins 3.931825 minutes while leaving the thumb at 3.95, so the period cell reads 86400.00 s - one solar day exactly; touch the slider and the pin goes, the cell reads 86401.09 s - 3.95 min long, and the altitude card moves from 35862.96 to 35863.31 km. Derived from those two cards, not a readout: the gap is 0.35 km, from a thumb that has not visibly moved.
Rows 1 and 12 drift equally and in opposite directions. Five minutes either way gives 1.2534 deg of drift, westward when the period is long and eastward when it is short, and that symmetry is worth checking by hand because it is easy to assume one direction is somehow privileged. The altitude is not symmetric in the same way. Derived from those three cards, not a readout: the two end rows sit 97.82 and 97.92 km from the middle one rather than the same distance either side.
Rows 3, 4, 7 and 8 straddle the drift card’s own unit switch. At 0.35 minutes it reads 5.264 arcmin westward and at 0.40 minutes 0.10027 deg westward, the same boundary the swing cards use. The direction word survives the switch, so 5.264 arcmin eastward and 0.10027 deg eastward are the mirror pair on the other side of zero, and at zero the whole string is the single word none.
Formula and symbol reference
Both swing relations are on the screen already, one standing over each figure it produces: lat = asin(sin i sin u) over the north-south swing and dlon = atan2(cos i sin u, cos u) - M over the east-west one. The radius gets no card of its own, so its relation goes into the fixed line under the drawing instead. Where that cube root comes from, and why exactly one radius will do, is answered in the guides this page links to rather than anywhere on the screen.
Of the thirteen rows below, four are outside your reach: the radius has no control and no card, the two constants are fixed and printed, and the last two are angles the lab sweeps internally rather than anything you choose. The other nine are a slider or a readout apiece, and the right-hand column says how far this lab will move each of them and what it prints at either end.
| Symbol | Meaning | SI unit | In this lab |
|---|---|---|---|
| i | Inclination, the angle between the orbit plane and the equator, and what the first slider sets. It is the only control that can put the track north of the equator | degree | 0 to 65 in steps of 0.1, echoed beside the slider as “0.0 deg”, “5.0 deg”, “63.4 deg”, “65.0 deg”. Every preset value is already on that grid, so this slider carries no pin and a hand-drag reaches each of them exactly. |
| e | Eccentricity, how far the orbit departs from a circle, and what the second slider sets. It is the only control that moves the track east and west without moving it north and south | dimensionless | 0 to 0.300 in steps of 0.001, echoed as “0.000”, “0.010”, “0.300”. Its smallest non-zero position, 0.001, already swings the track +/- 0.11459 deg east and west, which is more than a whole degree of tilt manages. |
| dT | Period offset from one sidereal day, and what the third slider sets. It is the only control that changes the altitude, the period cell and the visibility limit, and the only one that can make the track drift | second, set in minutes | minus 5.00 to plus 5.00 minutes in steps of 0.05, echoed as “-1.00 min”, “0.00 min”, “3.93 min”, “5.00 min”. This is the one slider with a pin: 3.931825 is not on its grid, and the 24-hour preset pins it and derives the thumb 3.95. |
| T | Orbital period, in the first grid cell, printed with the day it corresponds to when it is one of the two named ones | second | the cell names the day at the two ends that have a name and reports the gap otherwise: “86164.09 s - one sidereal day”, “86400.00 s - one solar day”, “86224.09 s - 1.00 min long”, “85864.09 s - 5.00 min short”. The slider moves it 300 s either way. |
| r | Orbit radius from Earth’s centre. There is no control for it and no card either — the lab computes it from the period in the fixed line it prints on itself, r = cbrt(GM T^2 / (4 pi^2)), and then subtracts the equatorial radius |
metre | not a readout. It is why the altitude card answers the period slider and ignores the other two, and why the visibility limit moves with the period as well. |
| alt | Altitude above the equator, on the first card, under alt = r - RE_eq |
metre | seven significant figures and always in kilometres: “35786.03 km” at a sidereal day, and the two corners the period slider reaches are “35688.11 km” and “35883.85 km”. Tilt and eccentricity do not change it at any position. |
| lat | Ground-track latitude, the north-south half-swing, on the second card, under lat = asin(sin i sin u) |
degree | prefixed “+/- ”, and exactly the inclination: “+/- 0” at the bottom, “+/- 0.10000 deg” at the smallest non-zero tilt, “+/- 65.000 deg” at the top. Because the slider steps in tenths of a degree, this card never reaches arcminutes. |
| dlon | Ground-track longitude offset, the east-west half-swing, on the third card, under dlon = atan2(cos i sin u, cos u) - M |
degree | the same formatter, and it does reach arcminutes: “+/- 0.002618 arcmin” at the smallest tilt, “+/- 0.10922 deg” at five degrees, “+/- 34.749 deg” at the top of the eccentricity slider, and “+/- 56.996 deg” with both sliders at their stops. |
| drift | Drift per day, on the fourth card, under 360 (T / T_sidereal - 1), with a direction word after the figure |
degree per day | the same formatter again, then westward or eastward, and the whole string is the bare word none at zero: “0.7521 arcmin westward” at the smallest step, “0.98565 deg westward” at the 24-hour preset, “1.2534 deg eastward” at the bottom stop. |
| lat_max | The latitude beyond which the satellite is below the horizon, in the second grid cell, from cos(lat_max) = RE_eq / r |
degree | six significant figures: “81.2995 deg” at a sidereal day, “81.3155 deg” at the 24-hour preset and “81.3198 deg” at the top of the period slider. Only the first of those belongs to a geostationary orbit; the others belong to orbits that are not one. |
| GM, RE_eq | The two constants the lab holds fixed and prints on itself, the standard gravitational parameter and Earth’s equatorial radius, both WGS-84 | cubic metre per second squared, and metre | not controls. The fixed line under the drawing gives them as GM = 3.986004418e14 m^3/s^2 and RE_eq = 6378.137 km. Holding them is what keeps the control count at three sliders. |
| u | The angle round the orbit measured from the equator crossing — the true anomaly — which is the variable both ground-track relations in the card labels are written in terms of | radian | not a readout. Both swing cards report the largest figure their relation reaches as the satellite takes u once round, which is why each is printed with a +/- in front of it as a half-swing rather than as a position. |
| M | The mean anomaly, the angle a satellite on a perfect circle would have reached in the same time, and the quantity the east-west relation on the third card subtracts | radian | not a readout. Subtracting it is what makes the horizontal axis an offset from the nominal slot instead of a longitude. At e = 0 it is the same angle as u, so with the tilt at zero too the subtraction leaves nothing at all: that is the opening state’s +/- 0. |
The row worth reading twice is the one for the period. The fixed line calls the nominal value one sidereal day and gives it as 86164.0905 s = 23 h 56 min 4 s, with the words “not 24 hours” attached, and the third slider offsets from that rather than from a round day. The same 86,164-second figure also describes how long the planet takes to turn once relative to the stars, which is the subject of the guide to angular velocity and a different claim about the same number.
Two entries carry a warning rather than a range. The visibility limit is a function of the radius, so it moves whenever the period does, and only its sidereal-day value belongs to a geostationary orbit. The radius itself is not on the panel at all: the lab computes it and prints the altitude, which is the radius less 6378.137 km, so any radius you want from this page has to be put back together from those two.
The physics: two swings, one altitude and two scales
The panel reports the satellite’s wandering twice, and the two figures are not the same claim. Ground track, N-S swing is how far north and south of the equator it goes; Ground track, E-W swing is how far along the equator it slides. On the five-degree tilt they read +/- 5.0000 deg and +/- 0.10922 deg, and on the one-per-cent stretch they read +/- 0 and +/- 1.1459 deg.
Those two states are the proof that neither card can be worked out from the other. One has a large north-south figure and a small east-west one; the other has an east-west figure ten times larger with north-south at exactly zero. No single function of the controls could produce both pairs, which is why the panel spends two cards rather than one and why the drawing has two axes rather than a single bar.
Derived from the two cards, not a readout: at one degree of tilt the east-west card reads 0.2618 arcmin and at five degrees it reads 0.10922 deg, which is 6.5532 arcmin, so five times the tilt gives 25.03 times the wobble. That is a check a reader can do on the table above in their head, and it is the signature of a quantity that grows as a square rather than in proportion.
The altitude card is the one declared exception on this panel, and the lab says so in its own fixed line. The radius is computed from the period and nothing else, so the altitude and the period cell are one fact in two units rather than two independent answers. That is a claim the page is making on purpose: it is why twelve rows of the inclination table and eight of the eccentricity table all print 35786.03 km.
What holds the satellite at that radius is gravity, and this panel takes that as given rather than computing it: there is no force card, no mass control and no inverse-square anything on the screen. The guide to the law of gravitation is where the attraction itself is set out, and the universal gravitation lab is where you can move the two masses about and watch it answer.
Now the drawing, and the one honest difficulty in it. At five degrees of tilt the track is about forty-six times taller than it is wide, and at one degree about two hundred and thirty times. Drawn on a single shared scale inside a canvas that is wider than it is tall, a figure-eight of those proportions is a vertical line a reader cannot see anything in.
So the default fits each axis separately and declares that it has. The caption on the five-degree tilt reads Fit each axis: half-widths 0.10922 deg E-W and 5.0000 deg N-S - the two axes are at different scales, which carries both half-widths and the warning in one line. The tick labels follow the same unit rule the cards do, so the horizontal axis is ticked -0.1, 0, 0.1 while the vertical one is ticked -5, 0, 5.
The toggle is the other half of the bargain. Press Same scale both axes on that same tilt and both axes tick -5, 0, 5 and the figure-eight you were admiring turns into a sliver. Neither view is a lie; the default is the legible one and the toggle is the honest one, and the caption tells you which you are looking at.
That second caption is the one reading on this panel that is not the same at every width, because the frame it describes is fitted to the canvas rather than to the track. At the 480-pixel canvas this page renders at a desktop width it reads Same scale both axes: the frame is 6.6485 deg E-W by 5.4000 deg N-S, so this is the true shape; the north-south figure holds at 5.4000 deg wherever you read it, and the east-west one follows the shape of your window.
The degenerate state needs neither view. With all three conditions held there is nothing to stretch, so the two axes already share a scale and the caption reports a point instead of a half-width: The three days collapse onto the nominal slot - one fixed point on one shared scale. There is no scaling decision left to make there, which is why that is the only first caption line quoted on this page with no half-width in it.
The three day-curves are the other thing to watch. While the drift is zero they lie exactly on top of one another, and the band above the frame says so: Days 1 to 3 coincide - one curve drawn three times. Give the orbit a wrong period and the single band becomes three, one per day, each naming how far west that day has walked.
The band strip is where a wrong period stops being a number. At the 24-hour preset the three bands read Day 1 - at the nominal slot, Day 2 - 0.98565 deg west of it and Day 3 - 1.9713 deg west of it. The caption underneath reads Fit each axis: half-widths 1.9713 deg E-W and 0 N-S - the two axes are at different scales, and that bare 0 with no unit after it is the formatter applied without exception rather than a missing word. A satellite that never comes back is a different failure from one that wobbles, and the drawing makes it look different.
What the picture leaves out is deliberate rather than unfinished, and the references at the foot of this page set out most of the list. One omission changes how the axes should be read: with nothing geographic drawn, the horizontal scale is a distance from your own slot and not a place on the ground. A second hands a whole picture away — the orbit seen in space, with its ellipse and its sectors, belongs to the Kepler’s laws lab — and what this frame holds instead is one ring and three plotted days.
The panel is equally quiet about the things it is not for. It prints no orbital speed, no angular velocity, no force and no energy, and there is no card anywhere on it for any of them. That is not an oversight — it is a geometry instrument, and every one of those quantities belongs to a tool that answers it properly rather than to a footnote on this one.
The two right-hand columns below are written by the canvas rather than by the cards. Each caption line, each band and the slot annotation on the drawing spends its own budget of width, so they are rarely on the same rung of the ladder, and the half-widths inside the caption never change — only the words around them do. Every row was read off this page with the five-degree tilt loaded.
| Viewport | Canvas in CSS pixels | The band strip writes | The first caption line writes |
|---|---|---|---|
| 1280 | 480 by 458 | Days 1 to 3 coincide - one curve drawn three times | Fit each axis: half-widths 0.10922 deg E-W and 5.0000 deg N-S - the two axes are at different scales |
| 860 | 440 by 458 | Days 1 to 3 coincide - one curve drawn three times | Half-widths 0.10922 deg E-W and 5.0000 deg N-S - the two axes are at different scales |
| 480 | 396 by 318 | Days 1 to 3 coincide - one curve drawn three times | 0.10922 deg by 5.0000 deg - the two axes are at different scales |
| 380 | 296 by 318 | One curve drawn three times | 0.10922 deg by 5.0000 deg - different scales |
| 320 | 236 by 318 | One curve drawn three times | 0.10922 deg by 5.0000 deg - different scales |
| 240 | 164 by 318 | Days 1-3 coincide | no room left: the caption strip is dropped |
The caption gives its wording up before the band does, and then the band goes too. At 860 px the caption has already dropped its Fit each axis: prefix while the band is still writing its longest form; at 380 px the band is down to One curve drawn three times; and at 240 px it is down to Days 1-3 coincide with no caption strip at all.
The second caption line climbs down the same ladder, from Longitude offset from the slot, east positive, against latitude, north positive to East is positive across, north is positive up. Its shortest rung, East +, north +, is reached only at 240 px, and even there it is drawn only when the first caption line is short enough for the strip to survive — which is why none of the six widths in the table above ever shows it.
Whatever the drawing has had to drop, the cards in the panel go on printing their labels in full at every one of those widths. That is why every figure quoted on this page is taken from a card or a grid cell rather than read off the picture, and it is the right habit for anyone using the lab too: the drawing is for seeing which failure you have, and the cards are for saying how large it is.
Where the geostationary orbit simulator breaks down
Nothing on this panel can go wrong in the ordinary sense: it evaluates exact spherical kinematics from three slider positions and prints what comes out. What the entries below describe are the edges of that arrangement — a model with nothing perturbing it, sliders that stop where they stop, and one pair of axes asked to hold two wildly unequal half-widths — and what the lab does at each of them.
- One of the three sliders cannot land on the state its own preset publishes
- The period offset steps in hundredths of a minute, so its grid runs 3.90, 3.95 and never reaches 3.931825, which is the offset that makes the period exactly 86,400 seconds. The preset for that state therefore pins the offset itself, and the thumb you can see is only the nearest the grid comes to it. The gap this closes is small but real: the pin prints 35862.96 km and 86400.00 s - one solar day, while the thumb alone prints 35863.31 km and 86401.09 s - 3.95 min long. Read the cards, never the thumb.
- The other two sliders carry no pin, and that is a statement about them rather than an omission
- Every value the presets ask of the inclination and the eccentricity — 0, 5, 63.4 degrees and 0, 0.01 — already sits on its own grid, so a careful hand-drag reaches each of them exactly and prints the same string the preset does. Only one slider needed the mechanism, and only one has it. A page that told you to pin all three would be describing a different lab.
- The north-south card can never show arcminutes, and the other two can
- One formatter serves every swing and every drift on the panel, switching on the rounded figure at a tenth of a degree. The north-south half-swing is exactly the inclination, and that slider steps in tenths of a degree, so its smallest non-zero reading is +/- 0.10000 deg and the arcminute branch is out of reach. The east-west card reaches it at +/- 0.002618 arcmin and the drift card at 0.7521 arcmin westward, so two of the three cards on this panel can print a unit the third never will.
- The visibility limit moves with the period, so only one of its values belongs here
- It is geometry done at whatever radius the period gives, which means the third slider moves it: 81.2995 deg at a sidereal day, 81.3155 deg at the 24-hour preset, 81.2954 deg a minute short and 81.3198 deg at the top of the slider. Only the first of those is the figure for a geostationary orbit, because only the first row is one. Quoting any of the others as the visibility limit would be quoting arithmetic about a different orbit.
- Stretching the orbit changes its shape and not its size, so the altitude card is a mean
- The eccentricity slider holds the semi-major axis fixed, which is why the altitude column is flat down the whole eccentricity table. A real stretched orbit is higher than 35786.03 km at one end of its lap and lower at the other, and this panel prints neither of those two altitudes. What the card gives is the altitude that belongs to the period, which is the right answer to a different question from the one a reader may be asking.
- Nothing on this panel is perturbed, so zero inclination here is set rather than held
- The model is exact spherical kinematics with two fixed constants and no oblateness, no luni-solar pull and no atmospheric drag in it. Real orbits are dragged off zero inclination continuously, which is why satellites carry fuel for the job, and none of that appears here: move the slider to 0 and it stays at 0 for all three days the lab draws. Treat a reading from this panel as the geometry a real operator is trying to maintain, not as a prediction of where anything will be next year.
- Three days is a short look at a slow failure
- The drawing shows three successive sidereal days and no more, so a drift of 0.7521 arcmin westward moves the curve by an amount you will struggle to see even though the card has already named it. The cards are the instrument for small drifts and the drawing is the instrument for large ones. If you want to know where a slow drift ends up, read the figure off the card and multiply it yourself rather than looking for it in the picture.
- There is no map, so a longitude on this plot is not a place
- The horizontal axis is the offset from the nominal slot, which is wherever you have decided to put the satellite, and the small ring at the centre is that slot and nothing else. The plot therefore says how far the satellite wanders from where it should be, and says nothing at all about what is underneath it. Nothing geographic was fetched for this lab, and a drawn coastline would have been an invented claim rather than a measured one.
- The panel computes no speed, no force and no energy
- There is no card for any of them and no control that would feed one. The satellite on this plot is moving, and quickly, and the whole point of the word stationary is that it is stationary with respect to the turning ground rather than to anything else — but the figure for that speed is not on this panel and no page should quote one from it. The guide to centripetal force is where the inward force a circular path needs is answered on its own terms.
- Two browsers were checked against each other, and a third was never exercised
- Chrome and Firefox agree on this lab’s readouts at every viewport width the cluster’s cross-browser gate drives, which is what that gate reports. Safari is the gap: that engine is installed on this machine but will not start without privileges the harness does not have, so no sentence here is a claim about it. Should a figure on your screen ever disagree with one printed here, we would want to hear about it — and until then the running lab, not this page, is the thing to trust.
Where the geostationary orbit simulator is actually used
- Settling whether the period really is 24 hours, in one button press
- This is the misconception the lab was built for. Press The 24-hour mistake and the period cell reads 86400.00 s - one solar day while the drift card reads 0.98565 deg westward; press A fixed point in the sky and the cell reads 86164.09 s - one sidereal day with the drift at none. Two presses, four seconds, and the difference between a shorthand and an answer is on the screen.
- Showing that tilting or stretching an orbit does not raise or lower it
- Press A fixed point in the sky, then Tilt it five degrees, then Stretch it one percent: Altitude above the equator never leaves 35786.03 km, while the pair of swing cards beside it reads differently at every press. Most people expect a satellite that has started to wander to be sitting at a different height as well, and three presses against one unchanged string correct that faster than any sentence here can. The twelve-row inclination table above is the same demonstration done slowly.
- Putting a number on which fault matters more
- Ask someone whether five degrees of tilt or one per cent of eccentricity moves a satellite further east and west, and most will pick the tilt because five degrees sounds large. Press the two presets: +/- 0.10922 deg against +/- 1.1459 deg. One button each settles it, and the drawing makes the two shapes look as different as the figures are.
- Seeing a figure-eight at its real proportions before drawing one
- Textbook analemmas are fat and symmetrical, and this one is neither. Load Tilt it, then stretch it as well, read the half-widths off the caption, then press Same scale both axes and watch the shape you were about to copy collapse. Anyone about to put a ground track in a diagram should spend ten seconds with that toggle first.
- Getting the vocabulary right before using it
- The Verdict cell has four strings and three of them contain the word geosynchronous, which is exactly the trap in this subject. A tilted orbit and a stretched one are both still geosynchronous; only the state with all three conditions held earns Geostationary - a single fixed point; and a mis-timed one is Not even geosynchronous - it marches away. Pressing the five presets in order is a faster way to learn that distinction than reading it.
- Sizing how far a mis-timed satellite walks before anyone has to intervene
- Drag the period offset by one step and the drift card answers 0.7521 arcmin westward; drag it to a whole minute and it answers 0.25068 deg westward; take it to the 24-hour value and it answers 0.98565 deg westward. The band labels then put the same figures on the picture, day by day. That is the quantity any argument about keeping a satellite in its slot actually turns on.
- Finding the latitude past which no dish can see one at all
- The grid cell answers it directly: 81.2995 deg with the orbit set correctly. Beyond that latitude the satellite is below the horizon and no amount of pointing will help, which is a hard geometric limit rather than an equipment problem. It is also the one readout here that has nothing to do with the ground track, and it is the reason the panel carries a compact grid as well as four cards.
- Fixing the one distance a satellite link cannot design away
- The altitude card is the start of every argument about the delay on a geostationary connection: the signal has that far to go up and the same again coming down, whatever the equipment at either end does. This panel does not divide it by anything — the guide to the speed of light is where the constant that division needs is set out — but it does fix the distance, to seven significant figures, for whichever period you give it.
Where to go next
Three sliders can show you which of the three conditions you have broken, and they stop there. Geostationary Orbit Explained is where the subject itself is written out: the definition stated from the beginning, geostationary set against geosynchronous, the two days compared, the one altitude and its visibility limit, and the problems worked through from their own figures. The calculator that turns a period straight into that radius heads the list of related tools below.
The relation itself has a page of its own. The guide to Kepler’s laws is where the cube root is actually worked, the guide to the law of gravitation is what holds the satellite there, and the guide to circular motion is the motion this orbit is one case of.
Further out, the guide to escape velocity is what it would take to leave instead of settling into a ring, the guide to gravitational potential energy is the energy cost of getting this high, and the guide to weight on other planets is why the same arithmetic gives a different ring somewhere else. Everything else lives in the simulation library, the index of calculators and the blog itself.
Frequently asked questions
Why does the altitude card not move when I tilt or stretch the orbit?
Because the card reports the altitude that belongs to the period, and neither slider touches the period. The lab prints the relation on itself: the radius comes from the period alone, so tilting or stretching at a fixed period cannot raise or lower it. Press the first three presets in turn and Altitude above the equator holds at 35786.03 km through all of them, while the two swing cards move a long way.
The period offset slider steps in hundredths of a minute, so how does the lab reach a 24-hour day?
The preset pins the exact value and then derives the thumb. That slider runs minus 5.00 to plus 5.00 minutes in steps of 0.05, so its grid goes 3.90, 3.95 and never lands on 3.931825; The 24-hour mistake pins 3.931825 and puts the thumb at 3.95. Touch the slider and the pin drops: the period cell falls from 86400.00 s to 86401.09 s and the altitude card from 35862.96 km to 35863.31 km.
Why does the east-west card sometimes read degrees and sometimes arcminutes?
One formatter serves every swing on the panel and it switches on the rounded figure, not the raw one. Anything that rounds to a tenth of a degree or more is printed to five significant figures in degrees, and anything smaller is multiplied by sixty and printed to four figures in arcminutes. On the inclination slider the switch happens between 4.7 degrees, which reads 5.790 arcmin, and 4.8 degrees, which reads 0.10065 deg.
Why is the north-south card never in arcminutes?
Because the inclination slider cannot ask for a swing small enough. The north-south half-swing is exactly the inclination, and the slider steps in tenths of a degree, so its smallest non-zero position is 0.1 degrees, which prints as 0.10000 deg and sits just inside the degree branch. The east-west card and the drift card both reach arcminutes easily, because both can be far smaller than the control that drives them.
What is the difference between the Verdict cell and the sentence strip under the drawing?
The Verdict cell classifies the orbit and the strip says what you are looking at. Verdict has four fixed strings and only one of them needs all three conditions at once; the strip has five and names the shape instead. A tilted orbit reads Geosynchronous - it traces a figure-eight in the cell and Tilt sends it north and south - the eight is far taller than it is wide in the strip.
Why does Visible up to latitude change when I move the period offset?
Because it is geometry done at the radius the period gives, and the period offset is the one slider that changes the radius. The cell reads 81.2995 deg at a sidereal day, 81.3155 deg with a 24-hour period and 81.2954 deg a minute short. Only the first of those is the figure this site publishes for a geostationary orbit; the others belong to orbits that are not one.
Why are the two axes at different scales by default, and what does the toggle change?
Because a figure-eight at this altitude is tens of times taller than it is wide, so one shared scale would draw it as an invisible vertical line. The default fits each axis separately and the caption declares it in words with both half-widths. Press Same scale both axes and the frame becomes square-ruled, the track shrinks to a near-vertical sliver, and the caption changes to say that this is the true shape.
Does the drawing show a map of the Earth?
No, and deliberately not. What is drawn is a bare latitude and longitude frame, round-number ticks on both axes, one small ring marking the nominal slot, and three day-tracks that collapse to dots when nothing is swinging. There is no coastline, no globe, no Earth disc, no view of the orbit in space, no ellipse around a central body and no satellite of any kind. The horizontal axis is an offset from your own slot, not a place.
References & formula source
- Every figure on this panel comes out of two constants and three slider positions, and nothing is fitted. The lab prints both constants on itself: the standard gravitational parameter of the Earth, 3.986004418e14 cubic metres per second squared, and the equatorial radius, 6378.137 km, which are the WGS-84 values. They are also the two that this site has already used in print, which is why the altitude card lands on the 35786.03 km our own pages publish rather than on a figure of its own.
- The nominal period the third slider offsets from is one sidereal day, which the fixed line gives as 86164.0905 s and as 23 h 56 min 4 s, and which the first grid cell prints rounded to 86164.09 s. That is a statement about this orbit rather than about the planet underneath it, and the distinction is the whole reason the third slider exists. The wording for the geostationary orbit itself, for its altitude and radius pair and for the four orbital properties it is defined by is the Wikipedia article on the geostationary orbit, retrieved for this cluster on 2026-10-15.
- The genus and species wording, the sidereal day in hours, minutes and seconds and the ground-track claims come from the Wikipedia article on the geosynchronous orbit, retrieved on the same date. That article is the source for a geostationary orbit being the special case with inclination and eccentricity both zero, for the ground track of that special case being a single point on the equator, and for the general case being a more or less distorted figure-eight that returns to the same places once per sidereal day. The 63.4 degrees the fifth preset uses is that article's own Tundra inclination.
- The ground track is computed by exact spherical kinematics and no small-angle approximation is used anywhere in it. The two familiar rules of thumb, that the east-west wobble from a tilt grows as the square of the tilt and that the east-west swing from an eccentric orbit is about twice the eccentricity in radians, are close for small values and are not used by this lab at all: at five degrees the rule gives a figure that differs from the card in the fourth significant digit, and at 63.4 degrees it is out by more than a tenth. The exact relations are printed on the cards themselves.
- The eccentricity slider holds the semi-major axis fixed, so stretching the orbit changes its shape and not its size. That is why the altitude card does not move down the eccentricity table above, and it is also a limit on how the card may be read: a stretched orbit is higher than 35786.03 km at one end and lower at the other, and this panel prints neither of those two altitudes. What it prints is the altitude that belongs to the period.
- What this panel will not tell you is as deliberate as what it will. It computes no orbital speed, no angular velocity, no force and no energy, it models no oblateness, no luni-solar perturbation and no atmospheric drag, and it therefore has nothing to say about station-keeping, which is the business of holding an inclination near zero rather than setting it there. It draws no map, no coastline, no globe and no Earth disc, because nothing geographic was fetched for this cluster and a drawn coastline would be an invented claim. No satellite, operator, frequency band or orbital slot is named anywhere on it.
- Every readout figure quoted on this page is a string this simulation printed for the button or the slider position named beside it, read back out of the running lab in a browser rather than worked out by hand. Each is computed from the exact value and rounded once, so re-deriving one printed figure from another will not always reproduce the last digit; the two ratios and the one subtraction in the sections above say in their own sentences that they are divisions and differences of cards rather than readouts. Where a figure here and the lab part company, believe the lab, and verify anything you rely on before quoting it.
- Further reading: Geostationary orbit — Wikipedia