The isothermal process simulator draws the curve P = nRT/V that a gas follows while its temperature is held still, and shades the region under it between the volume you start from and the volume you finish at. That gold region is the work. Four sliders move the amount of gas, the temperature and both volumes; four cards and six cells answer, and one button swaps the whole route for a free expansion into a vacuum. Load a case below, change one thing, and watch the picture as well as the figures.
The Isothermal Process: Work as Area
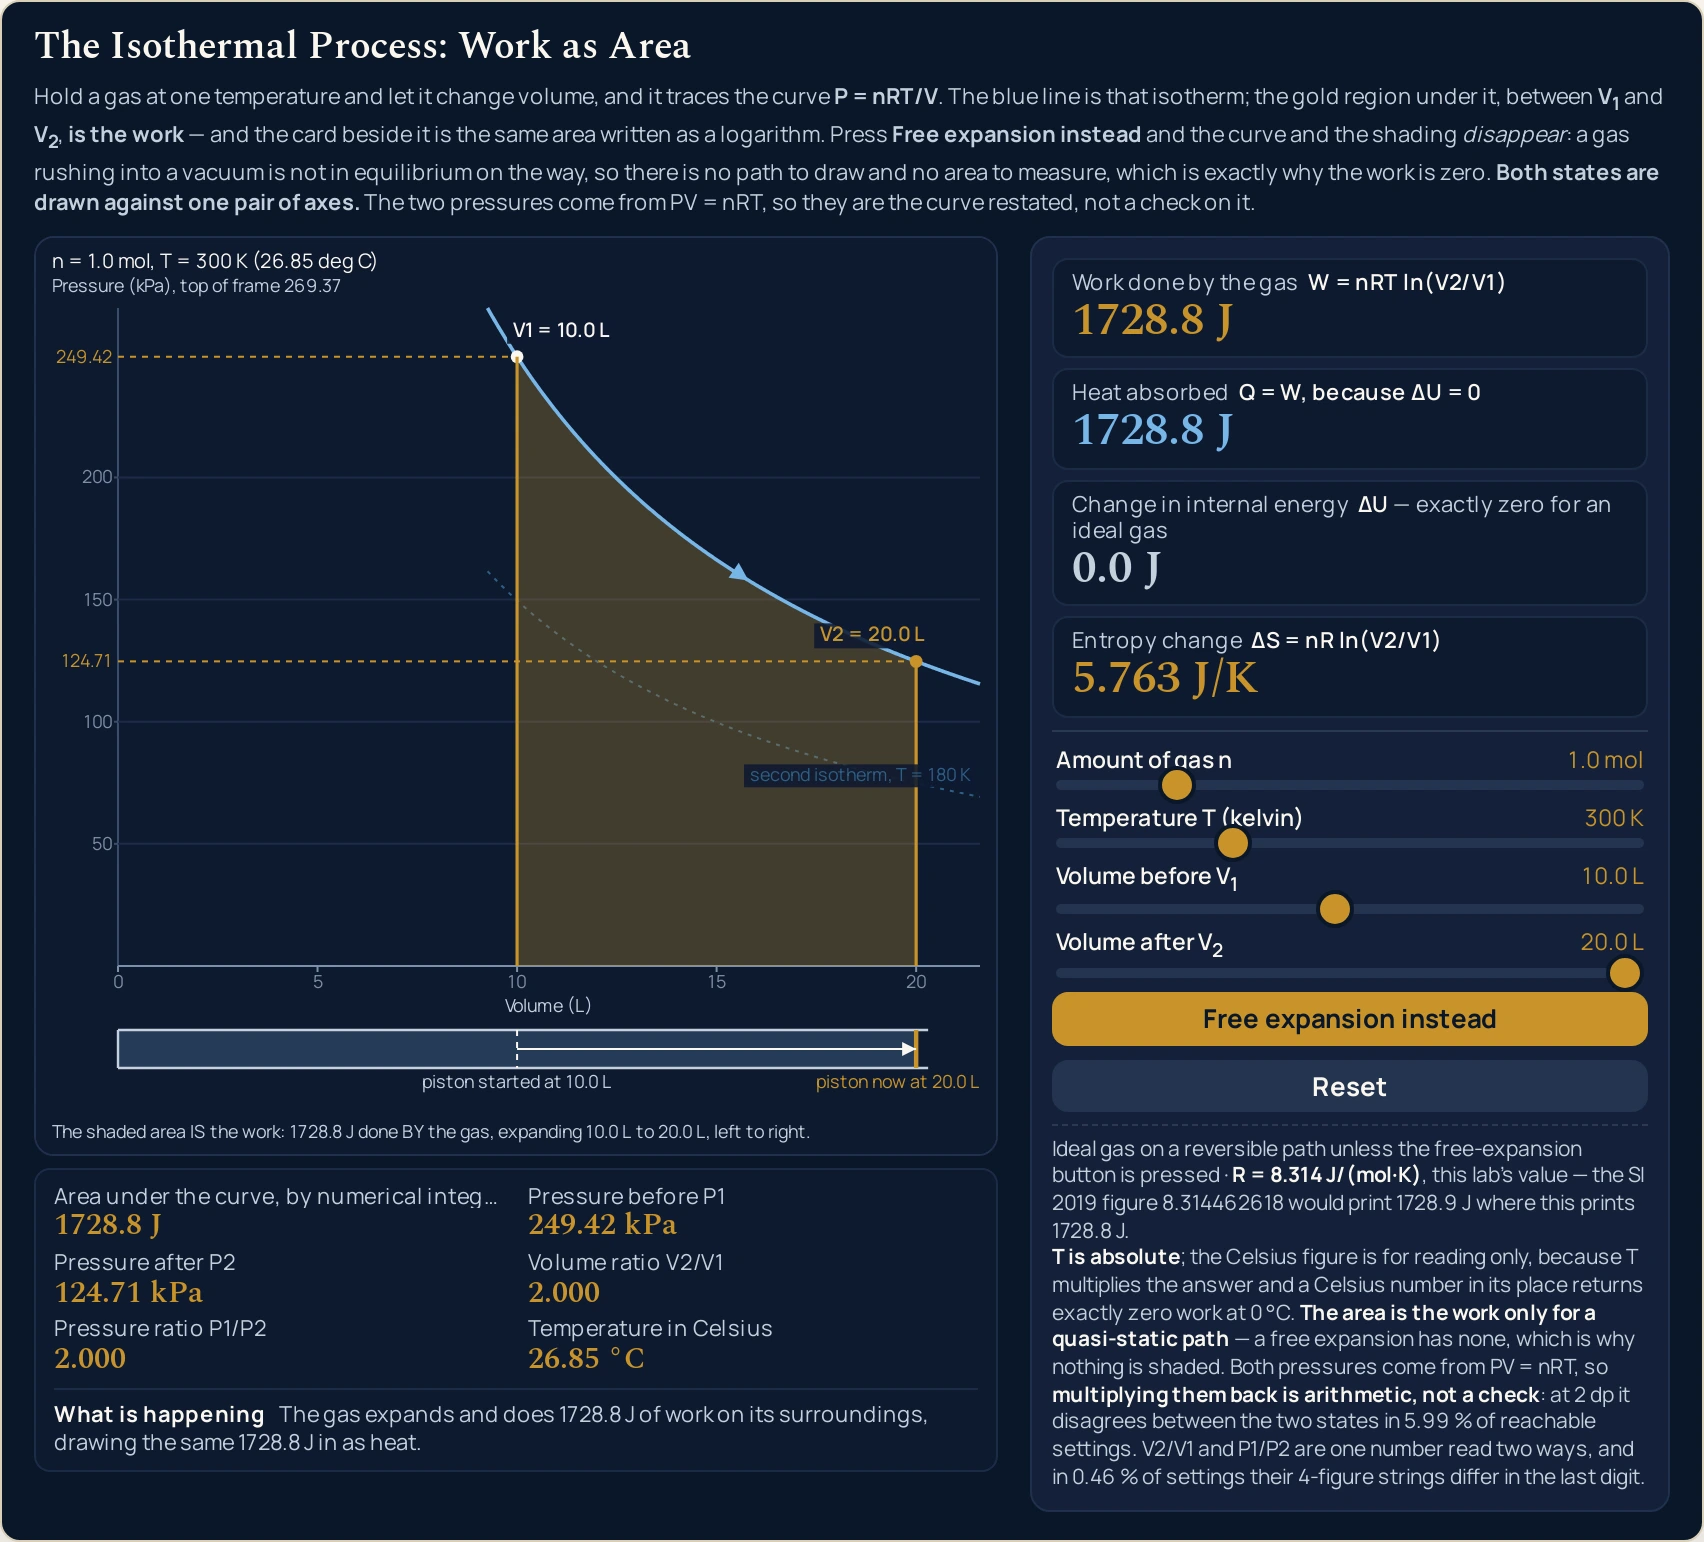
Hold a gas at one temperature and let it change volume, and it traces the curve P = nRT/V. The blue line is that isotherm; the gold region under it, between V1 and V2, is the work — and the card beside it is the same area written as a logarithm. Press Free expansion instead and the curve and the shading disappear: a gas rushing into a vacuum is not in equilibrium on the way, so there is no path to draw and no area to measure, which is exactly why the work is zero. Both states are drawn against one pair of axes. The two pressures come from PV = nRT, so they are the curve restated, not a check on it.
Area under the curve, by numerical integration1728.8 J
Pressure before P1249.42 kPa
Pressure after P2124.71 kPa
Volume ratio V2/V12.000
Pressure ratio P1/P22.000
Temperature in Celsius26.85 °C
What is happeningThe gas expands and does 1728.8 J of work on its surroundings, drawing the same 1728.8 J in as heat.
Work done by the gas W = nRT ln(V2/V1)
1728.8 J
Heat absorbed Q = W, because ΔU = 0
1728.8 J
Change in internal energy ΔU — exactly zero for an ideal gas
0.0 J
Entropy change ΔS = nR ln(V2/V1)
5.763 J/K
Amount of gas n1.0 mol
Temperature T (kelvin)300 K
Volume before V110.0 L
Volume after V220.0 L
Ideal gas on a reversible path unless the free-expansion button is pressed · R = 8.314 J/(mol·K), this lab's value — the SI 2019 figure 8.314462618 would print 1728.9 J where this prints 1728.8 J.
T is absolute; the Celsius figure is for reading only, because T multiplies the answer and a Celsius number in its place returns exactly zero work at 0 °C. The area is the work only for a quasi-static path — a free expansion has none, which is why nothing is shaded. Both pressures come from PV = nRT, so multiplying them back is arithmetic, not a check: at 2 dp it disagrees between the two states in 5.99 % of reachable settings. V2/V1 and P1/P2 are one number read two ways, and in 0.46 % of settings their 4-figure strings differ in the last digit.
T is absolute; the Celsius figure is for reading only, because T multiplies the answer and a Celsius number in its place returns exactly zero work at 0 °C. The area is the work only for a quasi-static path — a free expansion has none, which is why nothing is shaded. Both pressures come from PV = nRT, so multiplying them back is arithmetic, not a check: at 2 dp it disagrees between the two states in 5.99 % of reachable settings. V2/V1 and P1/P2 are one number read two ways, and in 0.46 % of settings their 4-figure strings differ in the last digit.
Load a real expansion on the sliders
Each button presses the lab’s own Reset first, so every load starts from the same place, and the last two press Free expansion instead straight after it. Work down the list in order: the first six change the route the gas takes, and the last two remove the route altogether.
Pick a case above, or drag the four sliders yourself.
What Is the Isothermal Process Simulator?
The isothermal process simulator is a free interactive physics lab that runs in your browser, with nothing to install and no sign-up. It draws a pressure–volume diagram with the isotherm P = nRT/V across it and shades the region under that curve between the volume the gas starts at and the volume it finishes at. That shaded region is the work, and the card beside it prints the same area written as W = nRT ln(V2/V1).
Four sliders set the amount of gas from 0.1 to 5.0 mol, the temperature from 100 to 800 K, and each of the two volumes from 1.0 to 20.0 L. Four cards answer with the work, the heat, the change in internal energy — exactly zero for an ideal gas, wherever the sliders are — and the entropy change. Six smaller cells carry the same area measured by numerical integration, the pressure before and after, both ratios and the temperature in degrees Celsius.
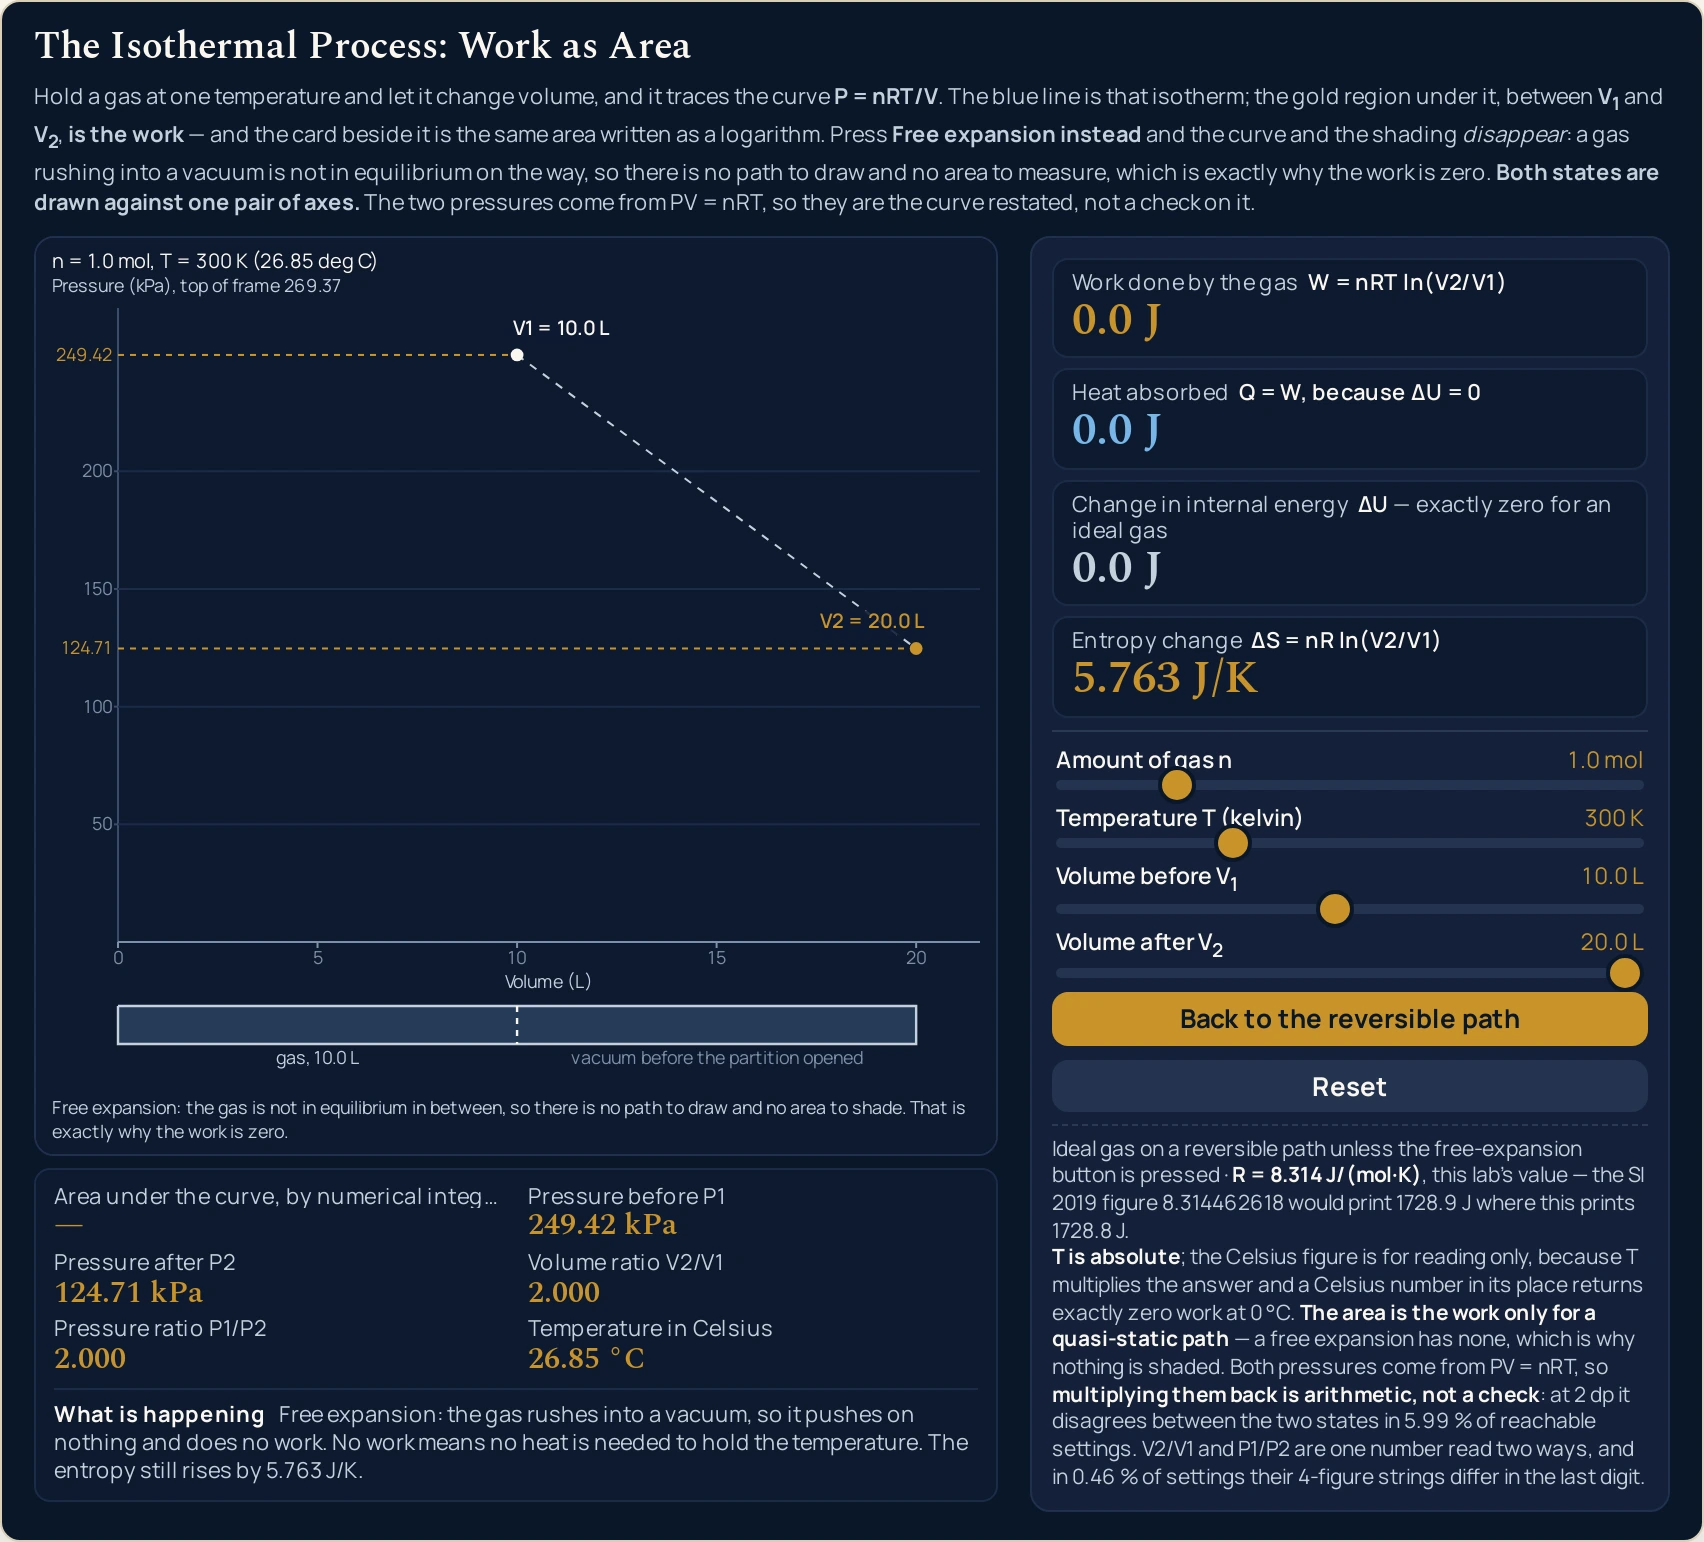
A button marked Free expansion instead is the teaching control. Press it and the curve, the shading and the direction arrow all vanish, leaving the two end points joined by a dashed line: a gas rushing into a vacuum is not in equilibrium on the way, so there is no path to draw and no area to measure. The work and the heat drop to zero while the entropy change does not move at all, because entropy depends on the end points alone.
The temperature slider is in kelvin only and the Celsius figure sits beside it as a reading rather than a control, because here the temperature multiplies the whole answer instead of cancelling inside a ratio. Reset restores 1.0 mol at 300 K going from 10.0 to 20.0 L and clears free mode. The gas constant typed into this lab is R = 8.314 J/(mol·K); the SI 2019 figure 8.314462618 would print 1728.9 J where this lab prints 1728.8 J.
| Control | Range | Step |
|---|---|---|
| Amount of gas | 0.1 to 5.0 mol | 0.1 mol |
| Temperature | 100 to 800 K | 10 K |
| Volume before | 1.0 to 20.0 L | 0.5 L |
| Volume after | 1.0 to 20.0 L | 0.5 L |
How to use the isothermal process simulator
- Start from the state it opens in. The lab boots on Amount of gas n 1.0 mol, Temperature T (kelvin) 300 K, Volume before 10.0 L and Volume after 20.0 L, with the four cards reading 1728.8 J, 1728.8 J, 0.0 J and 5.763 J/K. Reset returns all four sliders to exactly that and clears free mode.
- Move one volume and watch the gold region, not the number. Volume before and Volume after both run from 1.0 to 20.0 L in steps of 0.5, and the region shaded between them is what the work card is reporting. Widen it and the card climbs; narrow it and the card falls.
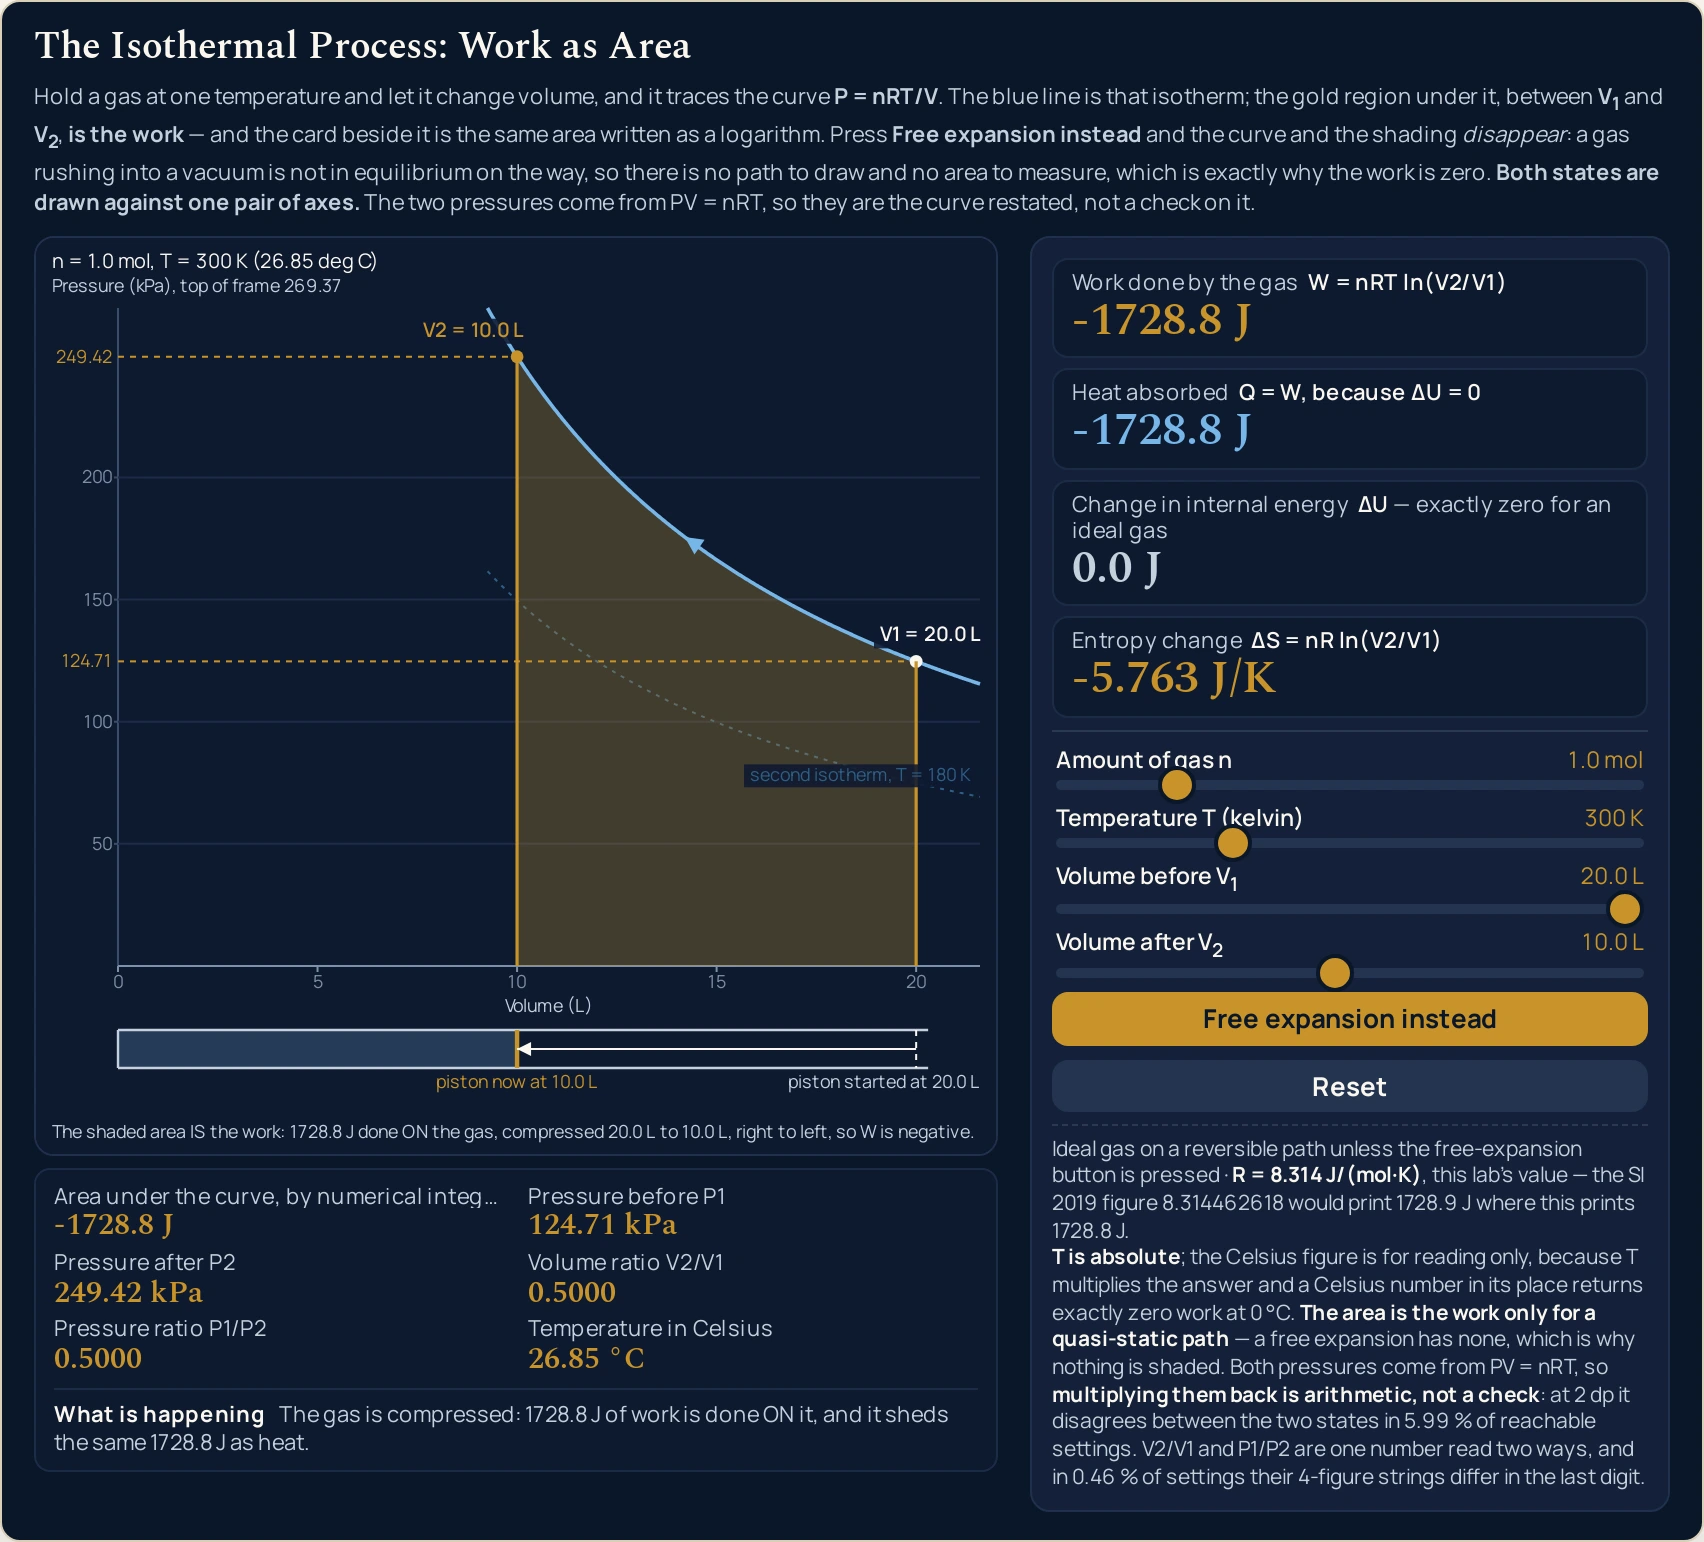
- Put the volume after below the volume before. The two are never sorted for you. The arrow on the curve turns round, the vessel strip beneath the plot squeezes instead of stretching, and the work card goes negative — -1728.8 J for 20.0 back down to 10.0 L, which means that much work done on the gas.
- Move the temperature and watch what does not change. Temperature T (kelvin) runs from 100 to 800 K in steps of 10. Take it up with the volumes untouched and the work card, both pressure cells and the area cell all move, while the Entropy change card stays where it is.
- Move the amount of gas. Amount of gas n runs from 0.1 to 5.0 mol in steps of 0.1 and scales the work and the entropy change together: 5.0 mol on the opening volumes gives 8644.2 J and 28.81 J/K, 0.1 mol gives 172.9 J and 0.5763 J/K.
- Read the four cards down the right. Work done by the gas carries
W = nRT ln(V2/V1); Heat absorbed carriesQ = Wwith the reason printed beside it; Change in internal energy is labelled exactly zero for an ideal gas; and Entropy change carriesnR ln(V2/V1). - Read the six cells under the canvas. They give the area under the curve by numerical integration, the pressure before and after, the volume ratio, the pressure ratio and the temperature in degrees Celsius. The strip headed What is happening puts the current state into one sentence and is rewritten on every move.
- Press Free expansion instead. The curve, the shading, the arrow and the faint second isotherm all go, the button relabels itself Back to the reversible path, and the work and heat cards fall to 0.0 J. The Entropy change card does not move at all.
The step worth repeating is the fourth one. Hold the volumes at 10.0 and 20.0 L and step the temperature through 100, 300 and 800 K: the work card reads 576.3, 1728.8 and 4610.3 J while the entropy card prints 5.763 J/K all three times. The work depends on the ratio and the temperature; the entropy change depends on the ratio alone.
If it is the heat you know rather than the volumes, this is the wrong lab and the first law of thermodynamics simulator is the right one: it holds the gas fixed and drives the change from a heat slider, so it answers “this much heat went in — where did the volume end up?”. This lab answers the opposite question, and neither can be asked on the other. The first law of thermodynamics guide sets out the ledger both of them are working inside.
Worked example: change one thing at a time
Every row below is one setting of the four sliders, and every cell is a string the running lab printed there. The first six are on the preset buttons above; the last six are a drag away. Where a cell and the lab ever part company, believe the lab.
| Setting | Sliders, as the panel reads them | Work done by the gas | Heat absorbed | Entropy change | Area under the curve |
|---|---|---|---|---|---|
| The classic doubling | 1.0 mol · 300 K · 10.0 L · 20.0 L | 1728.8 J | 1728.8 J | 5.763 J/K | 1728.8 J |
| Squeeze it back | 1.0 mol · 300 K · 20.0 L · 10.0 L | -1728.8 J | -1728.8 J | -5.763 J/K | -1728.8 J |
| Nothing moves | 1.0 mol · 300 K · 10.0 L · 10.0 L | 0.0 J | 0.0 J | 0.000 J/K | 0.0 J |
| Same ratio, hotter gas | 1.0 mol · 800 K · 10.0 L · 20.0 L | 4610.3 J | 4610.3 J | 5.763 J/K | 4610.3 J |
| Same ratio, colder gas | 1.0 mol · 100 K · 10.0 L · 20.0 L | 576.3 J | 576.3 J | 5.763 J/K | 576.3 J |
| Five moles | 5.0 mol · 300 K · 10.0 L · 20.0 L | 8644.2 J | 8644.2 J | 28.81 J/K | 8644.2 J |
| A tenth of a mole | 0.1 mol · 300 K · 10.0 L · 20.0 L | 172.9 J | 172.9 J | 0.5763 J/K | 172.9 J |
| The widest expansion | 5.0 mol · 800 K · 1.0 L · 20.0 L | 99626.1 J | 99626.1 J | 124.5 J/K | 99626.1 J |
| The deepest squeeze | 5.0 mol · 800 K · 20.0 L · 1.0 L | -99626.1 J | -99626.1 J | -124.5 J/K | -99626.1 J |
| The smallest step | 0.1 mol · 100 K · 19.5 L · 20.0 L | 2.1 J | 2.1 J | 0.02105 J/K | 2.1 J |
| Tenfold | 1.0 mol · 300 K · 2.0 L · 20.0 L | 5743.1 J | 5743.1 J | 19.14 J/K | 5743.1 J |
| Awkward numbers | 2.3 mol · 370 K · 3.5 L · 16.5 L | 10970.8 J | 10970.8 J | 29.65 J/K | 10970.8 J |
Rows 4 and 5 are the pair to read together. They share the first row’s volumes and differ only in temperature, and all three print 5.763 J/K in the entropy column while the work column runs from 576.3 to 4610.3 J. Nothing has gone wrong: the temperature stands in front of the logarithm in the work and is absent from the entropy change altogether.
Rows 1 and 11 are the diminishing return. Doubling the volume buys 1728.8 J and going tenfold buys 5743.1 J at the same mole and temperature — more, but nowhere near five times more. Drag the volume before down to 1.0 L for a twentyfold expansion and the card reads 7472.0 J. The work goes as the logarithm of the ratio, so twenty times the room is worth ln 20 over ln 2, about 4.32 times a doubling, and doubling the work means squaring the ratio rather than doubling it.
Rows 2 and 9 carry the signs. Running a setting backwards flips the work, the heat and the entropy change together, which is the convention this lab uses: a positive work is work done by the gas, so a compression has to come out negative. The internal-energy card is not in the table because it reads 0.0 J in every one of these settings, and in all twelve free-mode settings too.
The last column is a measurement, not a copy. The area cell runs Simpson’s rule over 400 panels on the curve the canvas draws, and the work card calls a logarithm once; they are different computations that happen to agree to the digit they print in all twelve rows. They are not guaranteed to, as the limits further down quantify, so read them as two routes to one quantity rather than as a check on each other. If entropy is the part you came for and you already have a heat, the entropy change calculator takes it directly.
| Readout | Reversible path | Free expansion instead |
|---|---|---|
| Work done by the gas | 1728.8 J | 0.0 J |
| Heat absorbed | 1728.8 J | 0.0 J |
| Change in internal energy | 0.0 J | 0.0 J |
| Entropy change | 5.763 J/K | 5.763 J/K |
| Area under the curve | 1728.8 J | — |
That table is the reason this lab exists. The gas starts in the same place and finishes in the same place down both columns, the internal-energy row is zero in both, and the entropy row is identical — yet one route does 1728.8 J of work and draws the same in as heat, and the other does nothing at all. Work and heat are properties of the journey; internal energy and entropy are properties of the two ends.
Formula and symbol reference
The lab works from one relation and its two consequences. The path is P = nRT/V, so the product of pressure and volume holds at nRT; the work is the area under that path, W = nRT ln(V2/V1); and the entropy change is the same logarithm without the temperature in front, nR ln(V2/V1). The heat follows from the first law once the internal-energy term is gone.
Only one constant is typed into the lab: R = 8.314 J/(mol·K), the rounded value behind every figure on this page rather than the full SI one. Everything else on the screen comes from your four slider positions. The pressures are absolute pressures, never gauge, and the relation PV = nRT itself belongs with the rest of the gas laws rather than to this page.
| Symbol | Meaning | SI unit | In this lab |
|---|---|---|---|
| n | Amount of gas, set by the Amount of gas n slider. It is held fixed for the whole change and scales both the work and the entropy change in direct proportion | mole, mol | 0.1 to 5.0 in steps of 0.1, printed to one decimal: “1.0 mol” after Reset, “0.1 mol” and “5.0 mol” at the two stops. |
| T | Absolute temperature, held still by whatever surrounds the gas, set by the Temperature T (kelvin) slider. There is no Celsius slider, deliberately | kelvin, K | 100 to 800 in steps of 10, printed as a whole number: “300 K” after Reset. The Temperature in Celsius cell reads “26.85 °C” there, “-173.15 °C” at the bottom stop and “526.85 °C” at the top. |
| V1 | Volume before the change, set by Volume before. Only the ratio of the two volumes decides the work, but their actual sizes decide both pressure cells | cubic metre, m³ (the slider is in litres) | 1.0 to 20.0 in steps of 0.5, printed to one decimal: “10.0 L” after Reset, “19.5 L” on the smallest step and “1.0 L” at the bottom stop. |
| V2 | Volume after the change, set by Volume after. It is never ordered against the first one: setting it lower is a compression, which is half of what this lab exists to show | cubic metre, m³ (the slider is in litres) | 1.0 to 20.0 in steps of 0.5: “20.0 L” after Reset and “1.0 L” on the deepest squeeze. |
| W | Work done by the gas, the headline card and the size of the gold region | joule, J | one decimal throughout: “1728.8 J” after Reset, “99626.1 J” the largest these sliders reach, “-99626.1 J” the most negative and “2.1 J” the smallest positive. |
| Q | Heat absorbed from whatever is holding the temperature, printed by the Heat absorbed card | joule, J | one decimal, and equal to the work in every state with a path, because the card below it is zero: “1728.8 J” after Reset, “-1728.8 J” on the compression. |
| ΔU | Change in internal energy, printed by the card the lab labels exactly zero for an ideal gas | joule, J | “0.0 J” in all twenty-four states harvested for this page, in both modes. It is an identity for an ideal gas rather than a measurement. |
| ΔS | Entropy change of the gas, printed by the Entropy change card | joule per kelvin, J/K | four significant figures: “5.763 J/K” after Reset, “124.5 J/K” at the widest, “0.02105 J/K” on the smallest step and “0.000 J/K” when the two volumes match. |
| P1, P2 | Absolute pressure before and after, printed by the Pressure before P1 and Pressure after P2 cells and labelled on the vertical axis | pascal, Pa (the cells are in kPa) | two decimals: “249.42 kPa” and “124.71 kPa” after Reset, rising to “33256.00 kPa” at 5.0 mol, 800 K and 1.0 L. |
| V2/V1 | Volume ratio, printed by the Volume ratio V2/V1 cell. It is the only thing the entropy change depends on besides the amount of gas | dimensionless | four significant figures: “2.000” after Reset, “20.00” at the widest, “0.05000” at the deepest squeeze and “1.026” on the smallest step. |
| P1/P2 | Pressure ratio, printed by the Pressure ratio P1/P2 cell. Note which way up it is: the pressure ratio is the volume ratio, not its reciprocal | dimensionless | four significant figures, chosen from the value in that cell alone rather than copied from the one above it, so a figure a hair under ten carries one decimal more than a figure at ten. |
| area | The gold region measured rather than solved for, printed by the Area under the curve, by numerical integration cell | joule, J | Simpson’s rule over 400 panels on the same curve the canvas draws: “1728.8 J” after Reset, and a dash whenever the free-expansion button is down, because then there is no curve. |
| R | The molar gas constant, the one number typed into this lab rather than chosen by you | joule per mole per kelvin, J/(mol·K) | 8.314 exactly, which is what every figure on this page was computed from. The SI 2019 figure 8.314462618 would print 1728.9 J where this lab prints 1728.8 J, which is why the panel names the constant it used. |
One row there is a formatting rule rather than a physical one. The two ratio cells are one quantity read two ways, and each is rounded from its own cell’s value to four significant figures, so on the tenfold setting one of them carries an extra decimal. Read either as the ratio; do not read one as a check on the other.
The physics: an area, a logarithm, and the route you did not take
Naming the curve is the easy half. PV = nRT tells you where the gas ends up, and this lab computes both pressures from it, which is precisely why watching them agree proves nothing: it is the definition of the curve restated. Move either volume slider and the pressure cells report the new state at once, but the gold region the canvas shades between the two volumes is the part that has to be swept out, and that area is what the expansion cost.
Step Volume after up one notch at a time and watch the work card: every half-litre adds less than the one before it, because each is swept against a lower pressure, and a running total whose increments fall as 1/V like that is a logarithm. That is where the shape of the work comes from, and it is why the returns fall away so fast: at 1.0 mol and 300 K a doubling gives 1728.8 J and a twentyfold expansion gives 7472.0 J, not twenty times as much.
The area cell is the only honest check on the screen. It measures the gold region numerically, panel by panel, while the work card evaluates a logarithm once; the two arrive at the same printed figure by genuinely different routes. That is worth more than any amount of multiplying the two pressures together, which is arithmetic the lab has already done for you.
The heat has no freedom here. For an ideal gas the internal energy depends on temperature alone, so holding the temperature still holds it still, and the card says 0.0 J for that reason rather than as a finding. The first law then has two terms where it had three, and the heat card can only repeat the work card — every joule the gas does is paid for in real time by the reservoir.
Now press the free-expansion button, and watch the drawing tell the truth. The gas goes from the same volume to the same volume, so both dots stay exactly where they were, but the curve between them is gone. A gas rushing into a vacuum is not in equilibrium on the way, so it has no pressure and no volume to plot in between, and a lab that shaded the region anyway and then printed 0.0 J would be lying with a picture.
The entropy card does not flinch, because entropy depends on the end points and those have not moved. What changes is where the entropy went: on the reversible route the reservoir loses exactly what the gas gains and the universe comes out level, while the free route takes nothing from anywhere, so the universe gains 5.763 J/K and the change cannot be undone. The full guide to the isothermal process works that argument through with the derivation and eight problems beside it.
Where the isothermal process simulator breaks down
The lab solves its own model exactly, so nothing on the screen ever fails. Everything below is a limit of that model, of the numbers you feed it, or of what the display can carry, and each item says what this lab does about it.
- The gas has to be ideal for the internal-energy card to read zero
- That card is an identity for an ideal gas, whose internal energy depends on temperature alone. A real gas carries an internal energy that depends on volume too, because its molecules pull on one another, so a real isothermal change does not have exactly zero there and the heat is not exactly the work. A real gas expanding freely also changes temperature rather than holding it. No figure here describes any particular real gas, because none was measured.
- The area is the work only on a slow, reversible path
- Every shaded region on this canvas assumes the gas stays in equilibrium the whole way, so that it has one pressure at each volume and the curve means something. Free expansion is exactly the case that breaks the assumption, which is why the lab stops drawing a curve rather than shading a region it cannot justify. Any real expansion fast enough to leave equilibrium sits somewhere between the two columns of that table.
- Something has to be holding the temperature still
- An expanding gas does work, and without a supply of heat it would cool. The lab assumes a reservoir large enough that the temperature never budges, and the heat card is the bill that reservoir pays. Take that away and the process is no longer isothermal at all, whatever the slider says, and the change becomes an adiabatic one with a different curve and a different area.
- The amount of gas is held for the whole change
- One slider sets the moles and it describes the gas before and after, so nothing leaks in or out between the two states. A vessel that is being filled or emptied is a different problem and this lab will quietly give you the wrong answer for it. Where the end state is the question rather than the cost of getting there, the Boyle’s law calculator is the tool.
- Kelvin is not a preference here, it is a prefactor
- The temperature multiplies the whole answer instead of appearing on both sides of a ratio, so the 273.15 between the two scales never cancels. The slider is in kelvin only and the Celsius figure is a reading beside it, which is the one design decision on this page that removes a mistake rather than warning about it. Across the whole 100 to 800 K band the error is exactly 273.15 divided by the kelvin temperature, so a Celsius number used in its place is at least 34.14 % wrong, and the sliders only reach that floor at their 800 K stop.
- The two pressures on screen will not always multiply back out
- Both cells are rounded to two decimals before you see them, and multiplying each by its own volume gives products that disagree in 5.99 % of the settings these sliders reach. It is right often enough to look dependable, which is what makes it a trap. It would not be a check even if it worked every time, because both pressures come from nRT divided by a volume in the first place.
- The area cell and the work card are two computations, not one
- They agree to the figure they print in all twelve settings tabulated above and in almost every other one, but the area is a sum over 400 panels and the work is a single logarithm, so their last digits can part company. That happens in 78 of 526,110 settings, which is rare rather than never. It is the ordinary signature of numerical integration and is worth knowing before you treat a match as a verification.
- The work never lands on a round figure
- The cards print one decimal and the underlying value is irrational for every slider position, so nothing here comes out tidy: in 42,600 sampled settings the work landed exactly on a printed tenth not once. If a textbook answer is round, it has been rounded. Compare to the precision on the card rather than expecting the digits to agree all the way down.
- The sliders stop where they stop, and the published figures stop with them
- The amount of gas runs 0.1 to 5.0 mol, the temperature 100 to 800 K and both volumes 1.0 to 20.0 L. Every extreme quoted on this page — the 99626.1 J at the top, the 2.1 J at the bottom — is the most those four ranges can do and nothing more. A wider range would give a different largest work, and this lab is not the place to find it.
- Nothing here has been measured
- The four sliders are figures you choose, the gas is an ideal one rather than any real substance, and no reading on this page describes a particular cylinder, compressor or experiment. The pressures are absolute pressures, so a gauge reading has to have the atmosphere added to it before it belongs on this axis. Verify anything you intend to rely on against your own data first.
Where isothermal work is actually used
- Putting a floor under the cost of compressing a gas
- Squeezing a gas slowly enough to stay at one temperature is the cheapest way to do it, and this lab gives that floor directly: set the volume after below the volume before and read the negative number on the work card. A real compressor runs too fast to stay cool and always needs more than that figure. The gap between the two is what intercooling is for.
- Setting a question that almost everyone gets wrong first
- “A gas doubles its volume at constant temperature. How much work does it do?” has no single answer until the route is named, and the two preset buttons at the end of the list settle it in about ten seconds. Ask for the entropy change as a follow-up and the surprise lands properly, because that one really is the same down both routes.
- Telling a state function from a path function without algebra
- Two cards move when you press the free-expansion button and two do not, on one screen, with the end points untouched. That is the whole distinction, drawn rather than defined. It is the reason the entropy of an irreversible change is still computed along an imaginary reversible path, which is a step that looks like cheating until you have watched these four cards behave.
- Reading somebody else’s pressure-volume diagram
- On a PV plot the work is an area, and areas are easy to misjudge by eye when one axis spans a factor of twenty. Load The widest expansion and the Pressure before P1 cell reads 33256.00 kPa, so the vertical axis has to stretch past that while the work card reports 99626.1 J. Read the axis labels before reading the shape, on this canvas and on any other.
- Getting an entropy change without measuring any heat
- The entropy card needs only the amount of gas and the ratio of the volumes, so it answers for the free route where there is no heat to measure at all. That is the standard way round a process nobody can follow: take the end points, invent a reversible path between them and compute along that. The dash in the work cell and a real figure in the entropy cell are that idea in two readouts.
- Costing one leg of a cycle before drawing the whole thing
- Engine cycles are built from legs, and the isothermal ones are where heat crosses the boundary in step with the work. Price a single leg here first, with its own sign, and the cycle diagram stops being a wall of symbols. The Carnot efficiency simulator takes over at the point where two of these legs are joined by two adiabatic ones.
Where to go next
For the derivation, the eight worked problems and the diagrams that go with them, read how to find the work in an isothermal process. If you would rather type figures than drag them, the isothermal process calculator takes the same four and also runs the relation backwards, returning either volume, the amount of gas or the temperature from a work you already have.
The neighbouring questions have tools of their own. Boyle’s law and its simulator own where the gas ends up; the guide to entropy and the entropy lab own the card this page leaves unchanged; and the ideal gas law with its calculator covers a single state rather than a process.
Further out, the complete guide to the gas laws places PV = nRT among the rest, the laws of thermodynamics and their lab set out the rules all of this obeys, and the guide to work done in physics covers the force-times-distance version of the quantity shaded here. The rest is in the library of physics simulations and on the blog, and the site search will find a topic by name.
Frequently asked questions
Why does the shaded area not change when I switch to free expansion?
It does change, and more drastically than a number would: the gold region and the blue curve both disappear, leaving two dots joined by a dashed line. A gas rushing into a vacuum is not in equilibrium on the way, so it has no path and no area at all. The area cell stops printing joules and prints a dash instead.
Why do the two pressures not quite multiply out to the same thing?
Your arithmetic is fine; the cells are rounded to two decimals before you see them. Multiply the rounded pressure by the rounded volume at each end and the two products disagree in 5.99 per cent of the settings these sliders reach. Both pressures are worked out as nRT divided by a volume anyway, so their product is the curve restated rather than a test of it.
Why do the work card and the heat card always print the same figure?
Because the internal energy of an ideal gas depends on its temperature alone, and this process holds the temperature still, so the internal-energy card reads 0.0 J. The first law then has only two terms left and they must balance. It is the ledger with one entry removed, not a coincidence the lab turned up, and it means the reservoir pays for every joule the gas does.
What do the cards do if I set both volumes to the same number?
The work, the heat and the area all read 0.0 J, the entropy change reads 0.000 J/K, and the status line says that nothing moves. That is a real answer about a gas that did not go anywhere rather than a refusal. The two dots land on top of each other on the plot, so there is no region left to shade.
Which readouts move when I change the temperature, and which do not?
The work, the heat, both pressures and the area all move; the entropy change does not. Hold the volumes at 10.0 and 20.0 L and take the temperature slider from 100 K to 300 K to 800 K: the work reads 576.3 J, then 1728.8 J, then 4610.3 J, while the entropy change prints 5.763 J/K at all three.
Why does the free-expansion mode print a dash when the gas gets smaller?
Because there is no such route. A gas will not gather itself into a smaller volume on its own, so the work, the heat and the area have no value to report and the sim prints a dash rather than a zero. The internal-energy card still reads 0.0 J and the entropy change still reads a figure, because both depend only on where the gas starts and ends.
What is the biggest work these four sliders can reach?
The work card reads 99626.1 J with the amount of gas at 5.0 mol, the temperature at 800 K and the volume going from 1.0 to 20.0 L, which is every slider at its most generous. Run the same setting backwards and it reads -99626.1 J. Press the free-expansion button on the first of those and all of it goes.
References & formula source
- The work is the integral of P dV along the path, which for P = nRT/V between two volumes gives nRT ln(V2/V1). This is the standard treatment of a reversible isothermal change in an ideal gas; Halliday, Resnick and Walker, Fundamentals of Physics, works it through in the chapter on the kinetic theory of gases.
- The sign convention here is the physics one: the first law is written as the change in internal energy equalling the heat in minus the work out, so a positive work means the gas expanded. It is the same convention this site uses on its first law of thermodynamics calculator, whose own notes cover the chemistry alternative.
- The area cell is a composite Simpson evaluation of the same curve the canvas draws, over 400 panels, and it is a genuinely separate computation from the logarithm in the work card. The two agree to the digit they print in almost every setting, but not in quite all of them, and neither cell confirms the other.
- One constant is typed into this simulation: the molar gas constant R = 8.314 J/(mol K), the rounded figure every reading on this page was computed from. Several other calculators on this site carry the full SI 2019 value instead, 8.314462618 J/(mol K), about 56 parts per million larger, and that difference is visible at the precision these cards print. Check which value a textbook, a spreadsheet or another page used before deciding that anything disagrees.
- The free-expansion route stays at one temperature only because the gas is ideal. A real gas has an internal energy that depends on its volume as well as its temperature, so a real free expansion changes the temperature. It is the Joule effect, an expansion into a vacuum at constant internal energy, rather than the Joule-Thomson effect, which is the constant-enthalpy temperature change across a throttle or a valve. No figure anywhere on this page describes a particular real gas, because none was measured for it.
- Every figure quoted here is a string this simulation printed for the four slider positions named beside it, read back out of the running lab rather than worked out by hand. Where a figure here and the lab ever part company, believe the lab, and verify anything you intend to rely on against your own data before you quote it.
- Further reading: Isothermal process — Wikipedia