No heat engine can beat eta = 1 - Tc ÷ Th, and the two reservoir temperatures are the only things that set it. Drag the hot and cold sliders below and watch the energy split in front of you: the gold band is the work you keep, the pale band is the heat you are obliged to throw away.
Carnot Efficiency: The Ceiling on a Heat Engine
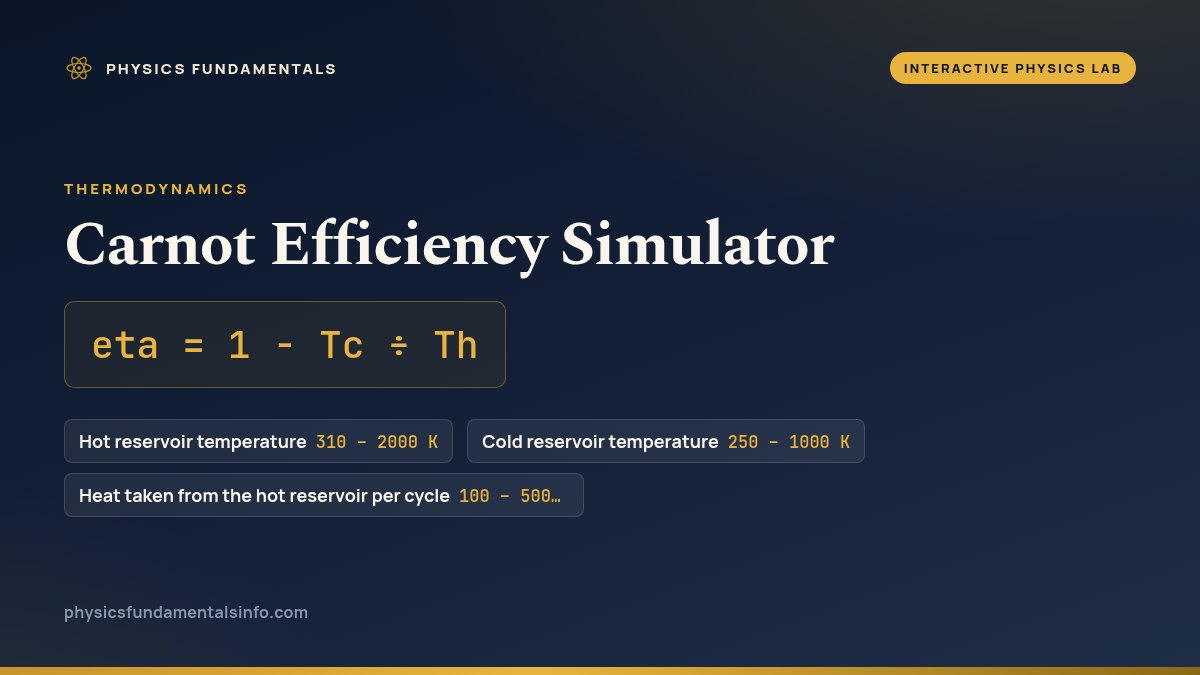
Heat leaves a hot reservoir, an engine takes a share of it as work, and the rest is dumped into a cold one. The share it can take is fixed by the two temperatures alone: eta = 1 - Tc ÷ Th. Drag the sliders and watch the gold work band widen and narrow.
What Is the Carnot Efficiency Simulator?
The Carnot efficiency simulator is a free interactive physics lab that runs in your browser — nothing to install and no sign-up. Drag the hot and cold reservoir temperatures and watch work and waste heat split live, from eta = 1 - Tc/Th. It reports Carnot efficiency eta as you drag the sliders.
| Control | Range | Step |
|---|---|---|
| Hot reservoir temperature | 310 – 2000 K | 5 |
| Cold reservoir temperature | 250 – 1000 K | 5 |
| Heat taken from the hot reservoir per cycle | 100 – 5000 J | 50 |
How to Use the Carnot Efficiency Simulator
Only two of the three sliders touch the headline number. Th sets the hot reservoir in kelvin and Tc the cold one, and the diagram redraws as you move either: a wine band of heat leaves the hot reservoir and enters the engine, the gold band branching off to the right is the work the engine keeps, and the pale band falling into the cold reservoir is what must be thrown away. The gold band's share of the incoming band is the efficiency — that is what eta = 1 - Tc ÷ Th looks like drawn rather than evaluated.
Run one experiment before anything else. From the default 600 K and 300 K, pull Tc down by 50 K and watch how far the gold band widens. Press Reset, then raise Th by 50 K instead. The same fifty kelvin is worth more than twice as much on the cold side, because Tc sits on top of the fraction being subtracted while Th sits underneath it. Nearly everyone predicts this the other way round, which is why the practical route to a better engine so often runs through better cooling rather than a hotter flame. The second law of thermodynamics is what puts the ceiling there; no amount of engineering moves it.
Underneath the Carnot number the simulator prints a second one: 1 - sqrt(Tc ÷ Th), the efficiency of an engine optimised for maximum power rather than maximum efficiency. It sits well below the Carnot line — 29.3 percent against 50 at the default settings — and much closer to what real power stations manage. Keep both in view: a plant measured against its Carnot figure alone always reads as a failure when it is in fact running near the best a machine that must deliver power at a useful rate can do.
The third slider teaches by doing nothing at all. Drag Qh, the heat drawn from the hot reservoir each cycle, and the work and waste readouts move in exact proportion while the efficiency does not budge by a hundredth of a percent. Efficiency is a ratio, fixed by the two temperatures and nothing else; more heat buys more work and more waste together. For a precise figure rather than the shape of a trend, the Carnot efficiency calculator also rearranges the formula to solve for either reservoir temperature.
Frequently asked questions
What does the Carnot efficiency simulator show?
It shows where the energy goes. A band of heat, Qh, leaves the hot reservoir and enters the engine; the gold band branching off to the right is the work the engine delivers; the pale band continuing downward is the waste heat dumped into the cold reservoir. The three widths are drawn to scale against one another, so the gold share of the incoming band is literally the efficiency, eta = 1 - Tc/Th. Move any slider and all three ease to their new widths over a couple of seconds, while the readouts beside the diagram give the same result as numbers in joules.
Why does changing the heat input not change the efficiency?
Because efficiency is a ratio, not an amount. It asks what fraction of the heat you put in comes back out as work, and that fraction is fixed entirely by the two reservoir temperatures. Doubling Qh doubles the work and doubles the waste heat in the same breath, so the ratio between them is untouched. You can watch it happen: drag the Qh slider from one end to the other and the work and waste readouts sweep across their whole range while the efficiency percentage sits perfectly still.
Why must I enter kelvin and not Celsius?
Because the formula divides one temperature by the other, and a ratio only means anything when the scale starts at absolute zero. Zero on the Celsius scale is an arbitrary point, so 200 C is not twice as hot as 100 C in any physical sense - and a Celsius value can be negative or zero, which would make the ratio meaningless or send it to infinity. Convert first: kelvin equals degrees Celsius plus 273.15. A steam plant at 327 C rejecting into a river at 27 C is 600 K against 300 K, which the simulator reads as a 50 percent ceiling.
What is the second efficiency figure the simulator displays?
It is the Curzon-Ahlborn efficiency, 1 - sqrt(Tc/Th), usually called the efficiency at maximum power. A true Carnot engine only reaches its quoted figure if it runs infinitely slowly, because any finite rate of heat transfer needs a temperature difference to drive it and every such difference wastes availability. Optimise the engine for the most power output instead of the highest efficiency and you land on this lower number. At 600 K and 300 K it gives 29.3 percent against Carnot's 50, and real power stations cluster far nearer the lower figure - which is why judging a plant against its Carnot number alone always makes it look like a failure.
Can the simulator show a refrigerator or heat pump?
Indirectly. The fourth readout is the coefficient of performance you would get by running the same reversible machine backwards as a heat pump: Th divided by (Th - Tc). It is the reciprocal of the Carnot efficiency, so it is largest exactly where the efficiency is smallest. A heat pump moving heat across a small temperature gap delivers several times more heat than the electrical work you feed it, which is why a COP well above 1 breaks no rules - the machine is moving heat, not creating it. The energy-flow diagram itself always runs as an engine, hot to cold.
References & formula source
- Çengel & Boles — Thermodynamics: An Engineering Approach, Chapter 6 (the second law, the Carnot principles) and Chapter 7 (entropy and the reversible bound).
- Zemansky & Dittman — Heat and Thermodynamics, Chapter 7 (the Carnot cycle and the thermodynamic temperature scale).
- Young & Freedman — University Physics with Modern Physics, §20.6 (The Carnot Cycle) and §20.7 (Entropy).
- Curzon & Ahlborn — "Efficiency of a Carnot engine at maximum power output", American Journal of Physics 43, 22 (1975), the source of the 1 - sqrt(Tc/Th) figure.
- Further reading: Carnot heat engine — Wikipedia