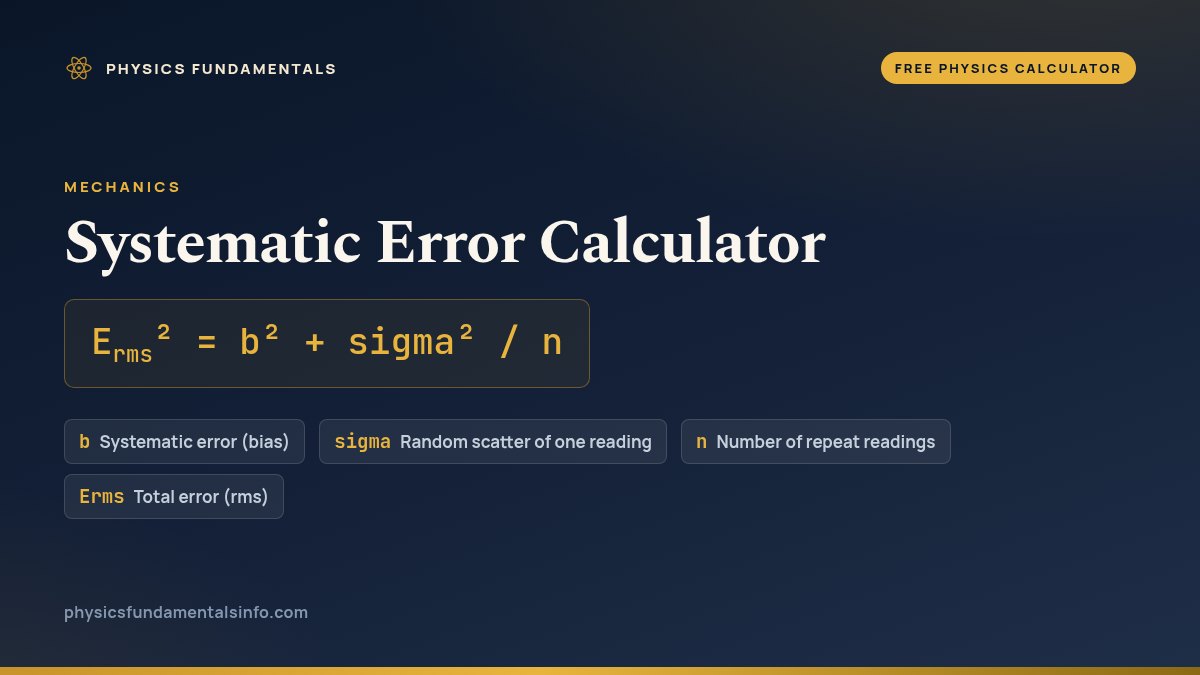
A measurement carries two errors that behave completely differently: a systematic one that is the same in every reading, and a random one that is not. Averaging n readings shrinks the random part to sigma / sqrt(n) and leaves the systematic part exactly as it was, so the two combine as a right-angled triangle: Erms² = b² + sigma² / n. This free systematic error calculator runs that relation in all four directions — point Solve for at the total error, the bias, the scatter or the number of readings — and prints the repeat ceiling, the share of the mean square error the instrument owns and what a hundred readings would actually buy you. Put all three error boxes in one unit of your choosing and the answer comes back in it.
Put all three error boxes in the same unit, and the answer comes back in it. The relation is scale free, so b, sigma and Erms may be micrometres, millimetres, grams, seconds or volts — whatever your bench uses — as long as they are all the same one. There is deliberately no unit menu here, because the physics does not need one and a menu would turn this into a micrometer page. The readings box takes a whole number of 1 or more: half a reading does not exist, and n is the one dimensionless box on the page. The three error boxes accept 0 to 1e9; a negative entry is declined rather than squared into a positive one, and so is anything outside that range. A bias below 1e-15 of the largest figure you typed is reported as exactly zero, because two faults that cancel leave the last bit of a subtraction rather than a clean zero, and dividing by that bit gives a repeat ceiling of 3.32e+29 readings where the honest answer is no ceiling at all.
Load a real case
Every button writes all four boxes at once, so whichever quantity the Solve for menu is pointing at, the remaining three already agree with it. The line underneath quotes back whatever the widget works out from that, so nothing in it is stored text.
Pick a case above, or type your own numbers.
What Is the Systematic Error Calculator?
The systematic error calculator is a free online tool for one relation: Erms^2 = b^2 + sigma^2 / n. Give it any three of the bias, the scatter of a single reading, the number of readings and the total error, and it returns the fourth with every step of the substitution. The equation is a right-angled triangle rather than a sum, and the two legs behave completely differently.
One unit of your choosing goes in all three error boxes, and the answer comes back in it. The relation is scale free, so micrometres, millimetres, grams, seconds and volts all work, and there is deliberately no unit menu because the physics does not need one. Only the number of readings is dimensionless, and it has to be a whole number of one or more. Three boxes in three different units is the single mistake this page cannot detect for you.
Averaging cannot touch the systematic term, and that is the whole subject. A random error varies from one observation to the next, so the mean of n readings carries only sigma over the square root of n of it. A systematic error occurs with the same value every time the instrument is used in the same way, so the mean carries all of it. Independent errors combine in quadrature, which means shrinking the shorter leg of the triangle barely moves the hypotenuse, which is why taking more readings stops being useful at a particular count.
That count is the repeat ceiling, the square of the ratio of the scatter to the bias rounded up, and it is the second of four readings printed beside the answer. Past it the instrument is the limit. Beside it is the count it takes to see the fault against the noise at the two-sigma level, which rounds up four times that same ratio squared rather than quadrupling the ceiling. Detecting a bias therefore costs up to four times what tolerating it costs, and both counts come out as a single reading once the bias is at least twice the scatter. Because the bias is squared in the denominator, halving it quadruples the ceiling: the better the instrument, the sooner averaging stops paying.
The other three readings are the random error of the mean with the share of the mean square error the bias owns, what the same state would leave at a hundred readings with the percentage that cuts, and how far the total error sits above the bias. The first of those is the one to read: above about ninety per cent the instrument is the limit and more readings will not help, and below about ten per cent your hand is the limit and they will. All four are worked out from the complete state with the solved value substituted back, not from the boxes, so they are the same in every mode.
Every box is checked against a declared range rather than merely against zero. The three error boxes accept nought to one thousand million, a negative entry is declined instead of being squared into a positive one, and the readings box additionally refuses anything that is not a whole number, because half a reading does not exist. A sign test alone would not be enough either: infinity is greater than zero, and an infinite entry would otherwise sail through into a finite-looking answer.
Two of the four modes take the square root of a difference, and both clamp at zero rather than returning a NaN. That difference is exactly zero when a total error is entirely scatter or entirely bias, and both are real states: a perfectly repeatable instrument that is simply wrong is one of them. The mode that solves for the number of readings declines outright when the target total error is at or below the bias, because no count of readings reaches it and the honest answer is that only a calibration will.
A bias below one part in a thousand million million of the largest figure in play is reported as exactly zero. Two instrument faults that cancel, a zero error one way and a proportional error the other, leave the last bit of a floating-point subtraction instead of a clean zero, and dividing by that bit gives a repeat ceiling of roughly three hundred thousand million million million million readings where the correct answer is that there is no ceiling at all. The same rule is applied to the denominator of the readings mode, which is the only other place a cancellation remainder gets divided by.
The headline carries six significant figures rather than ten, and that is measured rather than cautious. The scatter mode and the readings mode both subtract the dominant term when the bias is the larger of the two, and across all 32768 states of the companion simulator their worst relative errors are about two and four parts in ten million against about two parts in ten thousand million for the mode that solves for the bias. The fourth reading beside the answer prints the ratio that conditioning depends on and says in words when the last digits you typed are deciding the result.
What the page does not model, stated as omissions rather than as assumptions that happen to hold: where the bias came from, since a zero error that is the same at every reading and a proportional error that grows with it both enter as the single number b; drift, which is not the same value in every reading and is the easier fault to catch because the readings trend with time; correlated readings, which make the random error of the mean optimistic with no warning in the formula; and the rounding of a dial, which makes the scatter uniform on the resolution rather than symmetric about the long-run mean. None of those is a measurement, and the case names on the buttons are shorthand for the figures behind them rather than claims about any particular instrument.
| Symbol | Quantity | Default unit | Also accepts | Example value |
|---|---|---|---|---|
| b | Systematic error (bias) | — | — | 0.02 |
| sigma | Random scatter of one reading | — | — | 0.004 |
| n | Number of repeat readings | — | — | 9 |
| Erms | Total error (rms) | — | — | 0.0200443951712 |
How to use the systematic error calculator
- Choose the unknown. The Solve for menu opens on Total error (rms), and the other three choices are Systematic error (bias), Random scatter of one reading and Number of repeat readings. Switching the menu returns every box to its opening value, so set the menu first and type second.
- Pick one unit and use it in all three error boxes. Micrometres, millimetres, grams, seconds, volts — whatever your bench uses. What they cannot be is three different units, and that is the one mistake this page cannot detect for you.
- Type the systematic error. The part that is the same in every reading, entered as a magnitude with no sign, opening on 0.020. The box accepts 0 to 1e9, and a zero here is meaningful rather than empty.
- Type the random scatter of one reading. The standard deviation of a single measurement, not of the mean — the page divides by
sqrt(n)for you. It opens on 0.004 and accepts 0 to 1e9. - Type the number of repeat readings. A whole number of 1 or more, opening on 9, with presets at 1, 9, 25 and 100. One reading is a legitimate entry and is where the whole argument starts.
- Read the answer. The headline carries the answer to six significant figures, trailing zeros dropped, in the unit your three error boxes were in. Six rather than ten is deliberate: two of the four modes subtract the dominant term and are known to about seven figures.
- Read the two terms and the bias share. The first reading gives
sigma / sqrt(n)and the share of the mean square error the bias owns. Above about 90 per cent the instrument is the limit; below about 10 per cent your hand is. - Read the repeat ceiling. The second reading is
(sigma / b)²rounded up — the readings at which the random error of the mean has fallen to the bias — and beside it is4 (sigma / b)²rounded up in its own right, which is what it takes to see the fault at the two-sigma level. Two separate roundings, so the second count is at most four times the first, and both read a single reading once the bias is at least twice the scatter. - Read what a hundred readings would leave. The third reading runs your own state at
n = 100and prints the percentage it cuts. On the opening state that is a fraction of one per cent; with no bias at all it is the full tenfold gain. - Read the sensitivity chip before you quote the answer. The fourth reading prints
(Erms - b) / Erms. Below about1e-6the scatter is far smaller than the bias, the two subtracting modes are working on your last digits, and the chip says so. - Open Show working. The steps restate the relation as a triangle, quote the boxes back, substitute, put the two terms beside the head-to-head sum you should not use, work the ceiling and the detection count beside it, price a hundred readings, print the conditioning ratio and close on what the equation does not model.
This page exists for the one step that turns a bias and a scatter into a single number, and then tells you whether more readings would move it. The systematic error guide is the prose half of it, where the two kinds of fault are separated, the null length is derived and the problems are worked. The n in the third box is a count of readings, not a figure count: how many digits you are entitled to write down is the significant figures calculator’s question and not this one.
Three mistakes account for most wrong answers here. The first is typing the scatter of the mean into the scatter box, which divides by the square root of the readings twice. The second is mixing units across the three error boxes, which the page cannot see. The third is adding the two errors head to head instead of in quadrature, which the working prints beside the right answer so you can see the size of the difference.
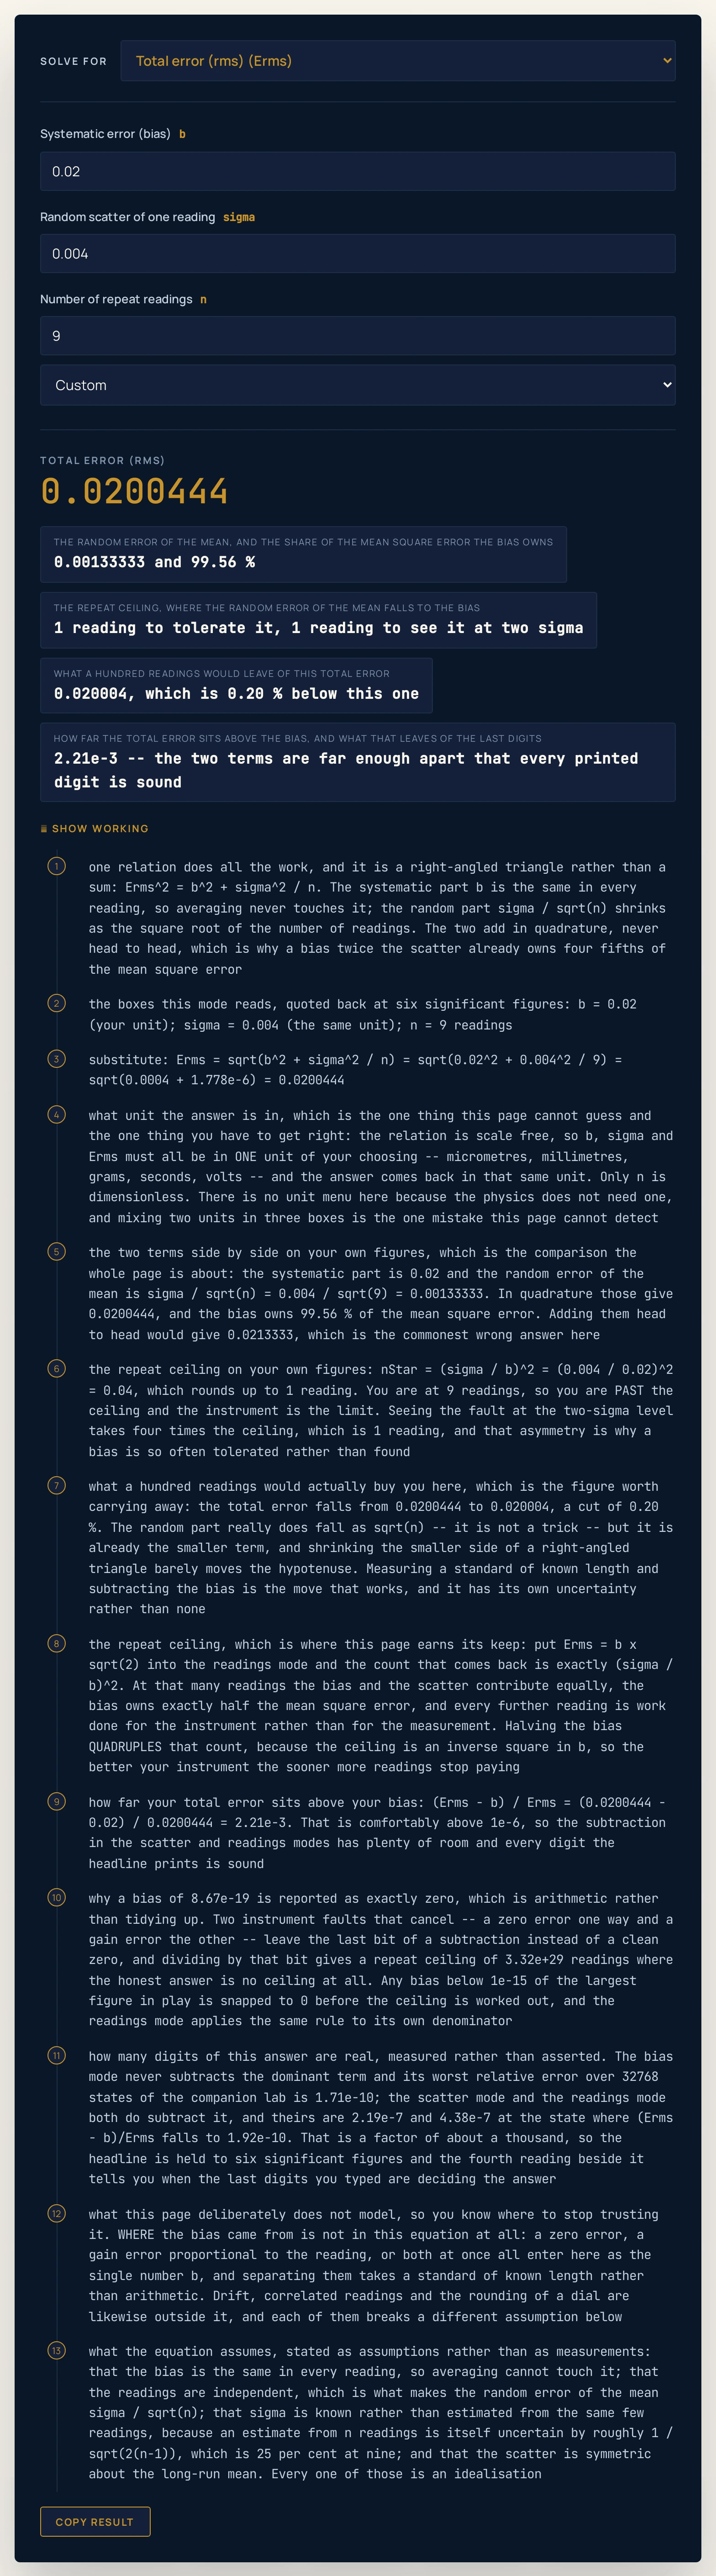
0.02, a scatter of 0.004 and nine readings give 0.0200444. The instrument owns 99.56 % of the mean square error, the ceiling was reached at the first reading, and a hundred readings would take 0.20 % off.Worked example: change one thing at a time
The table starts at the defaults, runs the unknown through all four modes on one state, then changes exactly one thing at a time: the readings, the bias, the scatter. It ends on the boundary cases and the entries the calculator declines. Every answer and reading cell was taken from the running widget rather than worked out by hand, and where a cell and the tool ever part company, believe the tool.
| Step | Solving for | What you type | Headline answer | Error of the mean and bias share | Repeat ceiling | Sensitivity |
|---|---|---|---|---|---|---|
| The page as it opens: a bias of 0.020, a scatter of 0.004, nine readings | Total error (rms) | b = 0.02, sigma = 0.004, n = 9 | 0.0200444 | 0.00133333 and 99.56 % | 1 reading to tolerate it, 1 reading to see it at two sigma | 2.21e-3 -- the two terms are far enough apart that every printed digit is sound |
| The same state, solved for the systematic error | Systematic error (bias) | Erms = 0.0200443951712, sigma = 0.004, n = 9 | 0.02 | 0.00133333 and 99.56 % | 1 reading to tolerate it, 1 reading to see it at two sigma | 2.21e-3 -- the two terms are far enough apart that every printed digit is sound |
| The same state, solved for the random scatter | Random scatter of one reading | Erms = 0.0200443951712, b = 0.02, n = 9 | 0.004 | 0.00133333 and 99.56 % | 1 reading to tolerate it, 1 reading to see it at two sigma | 2.21e-3 -- the two terms are far enough apart that every printed digit is sound |
| The same state, solved for the readings | Number of repeat readings | Erms = 0.0200443951712, b = 0.02, sigma = 0.004 | 9 | 0.00133333 and 99.56 % | 1 reading to tolerate it, 1 reading to see it at two sigma | 2.21e-3 -- the two terms are far enough apart that every printed digit is sound |
| Change ONE thing: the same instrument, a hundred readings | Total error (rms) | b = 0.02, sigma = 0.004, n = 100 | 0.020004 | 0.0004 and 99.96 % | 1 reading to tolerate it, 1 reading to see it at two sigma | 2.00e-4 -- the two terms are far enough apart that every printed digit is sound |
| Change ONE thing: the same instrument, a single reading | Total error (rms) | b = 0.02, sigma = 0.004, n = 1 | 0.0203961 | 0.004 and 96.15 % | 1 reading to tolerate it, 1 reading to see it at two sigma | 1.94e-2 -- the two terms are far enough apart that every printed digit is sound |
| Change ONE thing: the bias cut to a twenty-fifth, still nine readings | Total error (rms) | b = 0.0008, sigma = 0.004, n = 9 | 0.00155492 | 0.00133333 and 26.47 % | 25 readings to tolerate it, 100 readings to see it at two sigma | 4.86e-1 -- the two terms are far enough apart that every printed digit is sound |
| The crossover: bias and error of the mean exactly equal | Total error (rms) | b = 0.0008, sigma = 0.004, n = 25 | 0.00113137 | 0.0008 and 50.00 % | 25 readings to tolerate it, 100 readings to see it at two sigma | 2.93e-1 -- the two terms are far enough apart that every printed digit is sound |
| The crossover, solved for the readings instead | Number of repeat readings | Erms = 0.0011313708499, b = 0.0008, sigma = 0.004 | 25 | 0.0008 and 50.00 % | 25 readings to tolerate it, 100 readings to see it at two sigma | 2.93e-1 -- the two terms are far enough apart that every printed digit is sound |
| No bias at all: a hundred readings with a scatter of 0.016 | Total error (rms) | b = 0, sigma = 0.016, n = 100 | 0.0016 | 0.0016 and 0.00 % | no ceiling -- there is no bias to run into | 1.00e+0 -- the two terms are far enough apart that every printed digit is sound |
| No bias at all, solved for the systematic error (the clamp) | Systematic error (bias) | Erms = 0.0016, sigma = 0.016, n = 100 | 0 | 0.0016 and 0.00 % | no ceiling -- there is no bias to run into | 1.00e+0 -- the two terms are far enough apart that every printed digit is sound |
| Scatter sixteen times the bias, one reading | Total error (rms) | b = 0.001, sigma = 0.016, n = 1 | 0.0160312 | 0.016 and 0.39 % | 256 readings to tolerate it, 1024 readings to see it at two sigma | 9.38e-1 -- the two terms are far enough apart that every printed digit is sound |
| A bias 250 times the scatter: the same fault on a 50 mm block | Total error (rms) | b = 1, sigma = 0.004, n = 9 | 1 | 0.00133333 and 100.00 % | 1 reading to tolerate it, 1 reading to see it at two sigma | 8.89e-7 -- the scatter is far smaller than the bias here, so this answer turns on the last digits you typed: trust about seven figures, not ten |
| The ill-conditioned corner: a bias 2000 times the scatter, a hundred readings | Total error (rms) | b = 1, sigma = 0.0005, n = 100 | 1 | 5.000e-5 and 100.00 % | 1 reading to tolerate it, 1 reading to see it at two sigma | 1.25e-9 -- the scatter is far smaller than the bias here, so this answer turns on the last digits you typed: trust about seven figures, not ten |
| The repeat ceiling asked directly: a total error of b times the square root of 2 | Number of repeat readings | Erms = 0.00113137084989848, b = 0.0008, sigma = 0.004 | 25 | 0.0008 and 50.00 % | 25 readings to tolerate it, 100 readings to see it at two sigma | 2.93e-1 -- the two terms are far enough apart that every printed digit is sound |
| Two cancelling faults: the bias is a float residue, not a bias | Total error (rms) | b = 8.673617379884035e-19, sigma = 0.0005, n = 1 | 0.0005 | 0.0005 and 0.00 % | no ceiling -- there is no bias to run into | 1.00e+0 -- the two terms are far enough apart that every printed digit is sound |
| A perfectly repeatable instrument that is simply wrong | Random scatter of one reading | Erms = 0.02, b = 0.02, n = 9 | 0 | 0 and 100.00 % | 1 reading to tolerate it, 1 reading to see it at two sigma | 0.00e+0 -- the total error is at or below the bias, so there is no room left for any scatter at all |
| A total error at the bias has no reading count | Number of repeat readings | Erms = 0.0008, b = 0.0008, sigma = 0.004 | no answer | - | - | - |
| A target total error BELOW the bias is declined | Number of repeat readings | Erms = 0.0004, b = 0.0008, sigma = 0.004 | no answer | - | - | - |
| Half a reading is declined | Total error (rms) | b = 0.02, sigma = 0.004, n = 9.5 | no answer | - | - | - |
| A negative scatter is declined | Total error (rms) | b = 0.02, sigma = -0.004, n = 9 | no answer | - | - | - |
| A scatter past 1e9 is declined | Total error (rms) | b = 0.02, sigma = 2e9, n = 9 | no answer | - | - | - |
Rows 1 to 4 are one state — a bias of 0.020, a scatter of 0.004 and nine readings — with the Solve for menu in each of its four positions. All three reading columns are identical down all four rows, because the readings describe the state rather than the mode. That is the round trip in one block: the headline prints the total error as 0.0200444, and the twelve-digit 0.0200443951712 the box carries returns 0.02, 0.004 and 9 as printed.
Rows 5 to 9 change exactly one thing at a time, and row 5 is the whole argument. A hundred readings instead of nine move the total error from 0.0200444 to 0.020004 — eleven times the work for a cut the third reading prices at 0.20 %. Row 7 cuts the bias to a twenty-fifth instead and the total error falls from 0.0200444 to 0.00155492, which is the same page making the opposite point.
Rows 8 to 12 are the cases worth keeping. At the crossover the bias share is exactly 50.00 % and the ceiling is 25 readings, and row 9 reaches that same count from the other direction by asking the readings mode for it. Rows 10 and 11 are the no-bias case in both directions: the total error is the random error of the mean, and solving back for the bias clamps to 0 rather than returning nothing at all.
Rows 13 and 14 are where the page stops trusting its own digits, and row 13 carries a rounding worth naming: the bias share prints 100.00 % because the chip is held to two decimals, while the share is really 99.9998 % — it is never exactly all of it while any scatter remains. Row 16 is the cancellation case: two faults that cancel hand the box a bias of 8.67e-19, the page snaps it to zero and reports no ceiling instead of 3.32e+29 readings. Rows 18 to 22 are the refusals, declined on the input rather than tidied up afterwards.
Formula and symbol reference
One relation does all the work: Erms² = b² + sigma² / n, which rearranges to b = (Erms² - sigma²/n)^(1/2), to sigma = (n (Erms² - b²))^(1/2) and to n = sigma² / (Erms² - b²). It comes from one fact about the mean: the systematic part is a constant and survives averaging intact, while the random part has standard deviation sigma / sqrt(n). Independent errors combine in quadrature, so the total is the hypotenuse of those two.
Only n carries a unit on this page, and it carries none: it is a count. The three error boxes share whichever unit you choose, which is why no SI unit is named in the table below — the SI units guide is where the base units and their prefixes are set out, and the significant figures calculator is where the question of how many digits a written number claims belongs.
Four symbols on this page are not boxes. sigma / sqrt(n) is the random error of the mean, nStar is the repeat ceiling, the bias share is a fraction of the mean square error rather than of the error itself, and (Erms - b) / Erms is the headroom the two subtracting modes need. All four appear in the readings beside the answer; none of them appears in the widget.
| Symbol | Meaning | Unit | Values used on this page |
|---|---|---|---|
| b | Systematic error, or bias: the part of the error that is the same in every reading, so averaging never touches it. Entered as a magnitude, because the relation squares it | the unit you chose | No unit menu — the box takes whatever unit the other two error boxes are in: 0.020 is the default, and the buttons above the widget also write 0, 0.0008 and 1. The box accepts 0 to 1e9. |
| sigma | Random scatter of ONE reading: the standard deviation of a single measurement, not of the mean. The page divides it by the square root of n for you | the same unit as b | Same unit as b and Erms: 0.004 is the default, and the buttons also write 0.016. The box accepts 0 to 1e9. Written as the word sigma and never as the Greek letter, because the result label is uppercased by CSS. |
| n | Number of repeat readings that were averaged. The one dimensionless box on the page, and the only one with a preset menu | dimensionless | A whole number of 1 or more: 9 is the default, with presets at 1, 9, 25 and 100. The box accepts 1 to 1e9. As an ANSWER it is not a whole number, and the reading beside it is that count rounded up. |
| Erms | Total error of the mean of n readings, root mean square: the hypotenuse of the bias and the random error of the mean | the same unit as b | Same unit again. The box opens on 0.0200443951712, which is the twelve-figure answer for the opening state — a bias of 0.020, a scatter of 0.004 and nine readings. |
| sigma / sqrt(n) | Random error of the MEAN, often called the standard error. This is the term that falls as you take more readings, and the only one that does | the same unit as b | A derived quantity, printed in the first reading beside the answer: 0.00133333 on the opening state, 0.0008 at twenty-five readings with a scatter of 0.004. |
| nStar | Repeat ceiling: the number of readings at which the random error of the mean has fallen to the bias. Past it, more readings buy almost nothing | dimensionless | A derived quantity, printed in the second reading: 1 reading for the opening state, 25 readings for a bias of 0.0008 with a scatter of 0.004, and no ceiling at all when the bias is 0. |
| b² / (b² + sigma²/n) | Share of the MEAN SQUARE error the bias owns. Above about 90 per cent the instrument is the limit; below about 10 per cent your hand is | dimensionless | A derived quantity, printed as a percentage: 99.56 % on the opening state, exactly 50.00 % when the bias equals the random error of the mean, 0.00 % when there is no bias. |
| (Erms - b) / Erms | How far the total error sits above the bias. The conditioning of the two subtracting modes depends on it, and it is printed so you can see when it is small | dimensionless | A derived quantity, printed in the fourth reading: 2.21e-3 on the opening state, 2.93e-1 at the crossover, and down to 1.92e-10 at the worst state of the companion lab grid. |
The physics: why the two errors add in quadrature, and what that costs you
A systematic error is defined by what repeating a measurement does not do to it. The random part of a reading differs from reading to reading, so the mean of n readings carries only sigma / sqrt(n) of it; the systematic part occurs with the same value every time the instrument is used the same way, so the mean carries all of it. That asymmetry is the whole subject, and it is why the two terms can never be traded against each other.
Independent errors add in quadrature because their squares add, not their sizes. So the total error is the hypotenuse of a right-angled triangle whose legs are the bias and the random error of the mean, and shrinking the shorter leg barely moves the hypotenuse. That one geometric fact is the reason “take more readings” stops being advice at a particular count.
That count is the repeat ceiling, nStar = (sigma / b)², and this page reaches it from the other direction: set the total error to the bias times the square root of two and the readings mode returns exactly (sigma / b)². At that target the two terms contribute equally and the bias owns exactly half the mean square error. Because the bias is squared in the denominator, halving it quadruples the ceiling — an inverse square, so the better the instrument, the sooner averaging stops paying.
Four figures are worth carrying away, and all four are this page’s own output rather than rules of thumb. A bias equal to the scatter of one reading reaches its ceiling at the first reading. A bias one fifth of the scatter reaches it at twenty-five, and seeing that fault at the two-sigma level takes a hundred readings. Going from twenty-five readings to a hundred halves the random error of the mean exactly and still cuts the total error by only about a fifth.
Three different things get called uncertainty and only one of them is on this page. A figure count is a statement about how a number was written, which is the significant figures guide’s subject and which that guide itself calls a coarse stand-in for precision rather than the precision itself. The Heisenberg uncertainty principle guide is a statement about nature, and a bias is a statement about an instrument. All three limit a measurement, and care about one buys nothing for the other two.
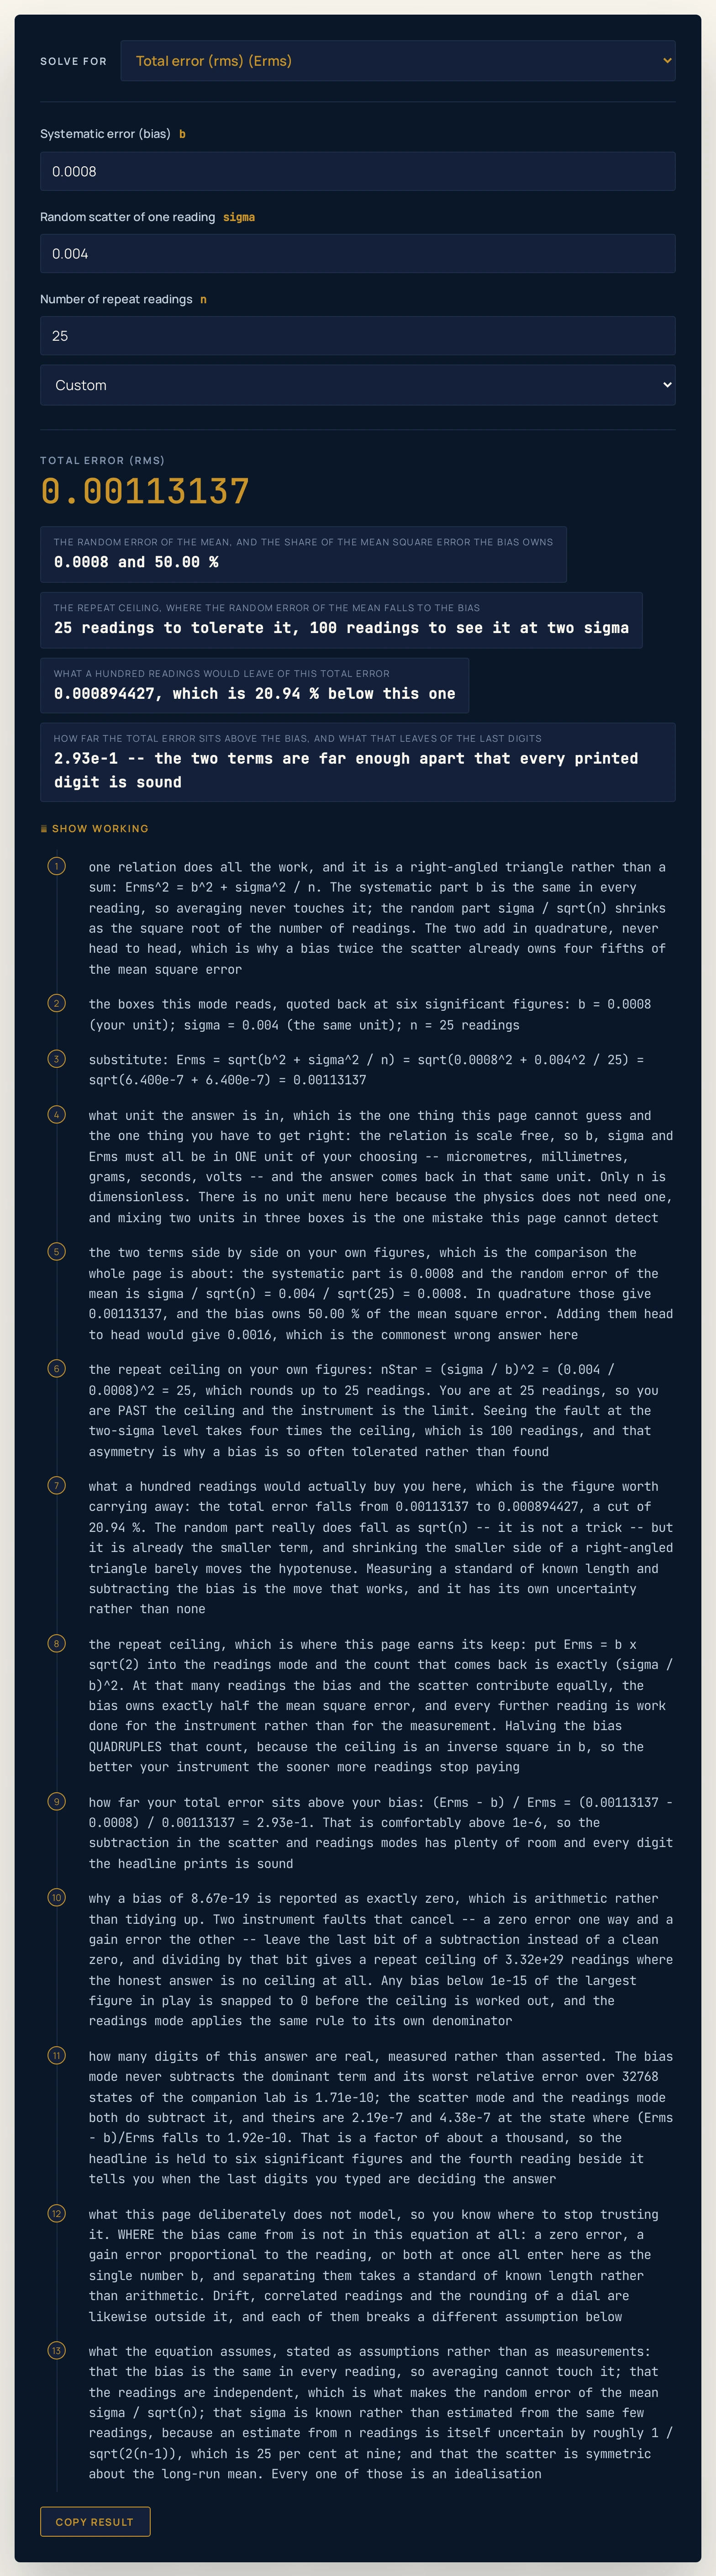
25 readings. Note the fourth row of the price list — going on to a hundred readings quadruples the work and still takes only 20.94 % off the total.Where this arithmetic breaks down
The arithmetic here is exact to the last digit a double can hold in two of its four modes, and good to about seven figures in the other two. What goes wrong is physical, and the first item on this list is the one metrologists would raise first.
- The random-and-systematic split is not how metrology books the arithmetic
- This is the one to read. NIST’s summary of its Technical Note 1297 classifies components of uncertainty by the method used to evaluate them — Type A from the statistical analysis of a series of observations, Type B from anything else — and not by whether the cause wobbles. The same physical fault is Type A if you estimated it by measuring a standard twenty times and Type B if you read it off a certificate. The split this page uses is the right one to learn, because it answers the question of whether more readings help; it is not the one the paperwork uses.
- A correction has its own uncertainty, so a corrected reading is not exact
- NIST is explicit that the measurement equation should express a measurement process rather than simply a physical law, and that the quantities in it include the corrections. Subtracting a measured bias does not delete it; it replaces a bias with the smaller uncertainty of the correction. This page takes
bas a given number and models neither where it came from nor how well you know it. - Repeats with the same instrument and the same observer cannot see the fault
- The source is blunt about this: a fixed systematic error can only be found either by measuring a known quantity or by comparing the readings with readings made using a different apparatus known to be more accurate. Nothing in
sigma / sqrt(n)warns you that a bias is there. What this page can give you is the largest bias your figures are consistent with, and the count it would take to see it. - Where the bias came from is not in this equation
- A zero error that is the same at every length and a gain error proportional to the reading both enter here as one number
b, and they behave completely differently. An instrument with one of each is correct at exactly one length — calibrate it there and it certifies itself as perfect, while reading low on a foil and high on a block. Separating the two takes two standards of known length rather than any amount of arithmetic, and the companion simulator is where that split has its own sliders. - A gain error is a percentage of a physical quantity, not of a scale reading
- A proportional fault multiplies the quantity, and the quantity has to be measured from its own zero. A two per cent gain on a thermometer is not two per cent of the Celsius reading, because the Celsius scale’s zero is the ice point and not absolute zero — the absolute zero guide is where that distinction is set out. Say which one your percentage is of before you turn it into a bias for this page.
- Drift breaks the constant-bias assumption, and partly averages out
- A fault that walks with time is not the same value in every reading, so the mean of a symmetric ramp is its mid-value and half the drift does average away. Drift is also the easier fault to catch, because the readings trend with time instead of varying randomly about a mean, and it inflates the apparent scatter while a constant offset adds exactly none. That asymmetry is why a constant offset is the dangerous one.
- Correlated readings make the standard error optimistic
sigma / sqrt(n)assumes the readings are independent. Nine readings taken by the same operator in the same five minutes are not, and nothing in the formula warns you — the printed random error of the mean is then too small and the bias share too low. The fix is a measurement design that breaks the correlation, not a different sum.- Quantisation makes the scatter uniform, not symmetric about the truth
- A dial read to its last division rounds rather than wobbles, so the scatter is uniform on the resolution rather than bell-shaped, and below one resolution step it can read as exactly zero while the rounding bias is entirely real. Rounding to whole centimetres has a standard deviation of ten over the square root of twelve, about 2.9 mm, which is why the source’s claim that a whole-centimetre ruler gives an error of several millimetres is exactly right.
- Sigma is usually estimated, not known
- The relation treats the scatter as a known number. In practice it is estimated from the same handful of readings with
n - 1degrees of freedom, and that estimate is itself uncertain by roughly1 / sqrt(2(n-1))— about 25 per cent at nine readings. So a repeat ceiling computed from nine readings is itself only good to a factor, and the right reading of “25 readings” is “a few tens”. - The two subtracting modes lose digits, and the page says when
- The scatter mode and the readings mode both subtract the dominant term when the bias is the bigger of the two. Measured over 32768 states of the companion lab their worst relative errors are 2.19e-7 and 4.38e-7 against 1.71e-10 for the bias mode — a factor of about a thousand. That is why the headline stops at six significant figures and why the fourth reading prints
(Erms - b) / Erms. - Three different things get called uncertainty
- A figure count describes how a number was written. The Heisenberg principle describes a limit in nature. A bias describes an instrument. The uncertainty principle calculator handles the second of those, and it is worth knowing that no calibration touches it — unlike a bias, which is exactly what calibration is for.
- The calculator measures nothing — you supply the numbers
- One bias, one scatter and one count go in, one relation is used, and the answer describes the situation you described. The case names on the buttons are shorthand for the figures behind them and are not claims about any particular micrometer, balance, stopwatch or meter.
Where the systematic error calculator is actually used
- Deciding whether another forty readings are worth taking
- Load A zero error, nine readings and the answer is on screen in one line: the ceiling was passed at the first reading, and the third chip prices a hundred readings at a fraction of one per cent of the error. That is the question this page was built for, and the honest answer is usually no.
- Finding the largest bias your figures are consistent with
- Point Solve for at the systematic error and feed it a total error from a comparison against a standard plus a scatter from a long run. The answer is an upper bound dressed as a number, and it is the one mode of the four that never subtracts the dominant term, so it is also the one you can quote to six figures without a caveat.
- Setting a reading count from a target total error
- Point Solve for at the readings and type the total error you need. If the target is at or below your bias the page declines, and that refusal is the useful answer: no number of readings reaches it, and the next move is a calibration. If it answers, the count beside the headline is the whole number to take.
- Checking a published error budget adds up
- A budget that quotes a bias, a scatter and a total error is testable in one line: square the first two terms, divide the second by the readings, add, take the root. If the published total matches, the budget combined its terms in quadrature. If it is larger by roughly the smaller term, the terms were added head to head.
- Separating a timing fault from a timing wobble
- A stopwatch that starts with a second already on it is the classic constant offset, and averaging twenty attempts leaves it entirely intact. Timing twenty swings once and dividing by twenty divides that offset by twenty, which is a change of measurement design rather than of statistics — the pendulum period calculator is where the period itself comes from, and this page is where you price the two procedures against each other.
- Reading a calibration certificate against your own repeatability
- A certificate gives a bias; a run of readings gives a scatter. Put both in, with the count you actually take, and the bias share tells you which of the two is worth spending money on. Above about 90 per cent the money goes on the instrument; below about 10 per cent it goes on the procedure.
- Teaching the difference between accuracy and precision with numbers
- Load No bias at all: the mean finds the truth and then A bias 250 times the scatter. The first has no ceiling and a tenfold gain from a hundred readings; the second is hopeless at one reading and hopeless at a thousand. Two clicks, two readings beside each other, and the words stop being interchangeable.
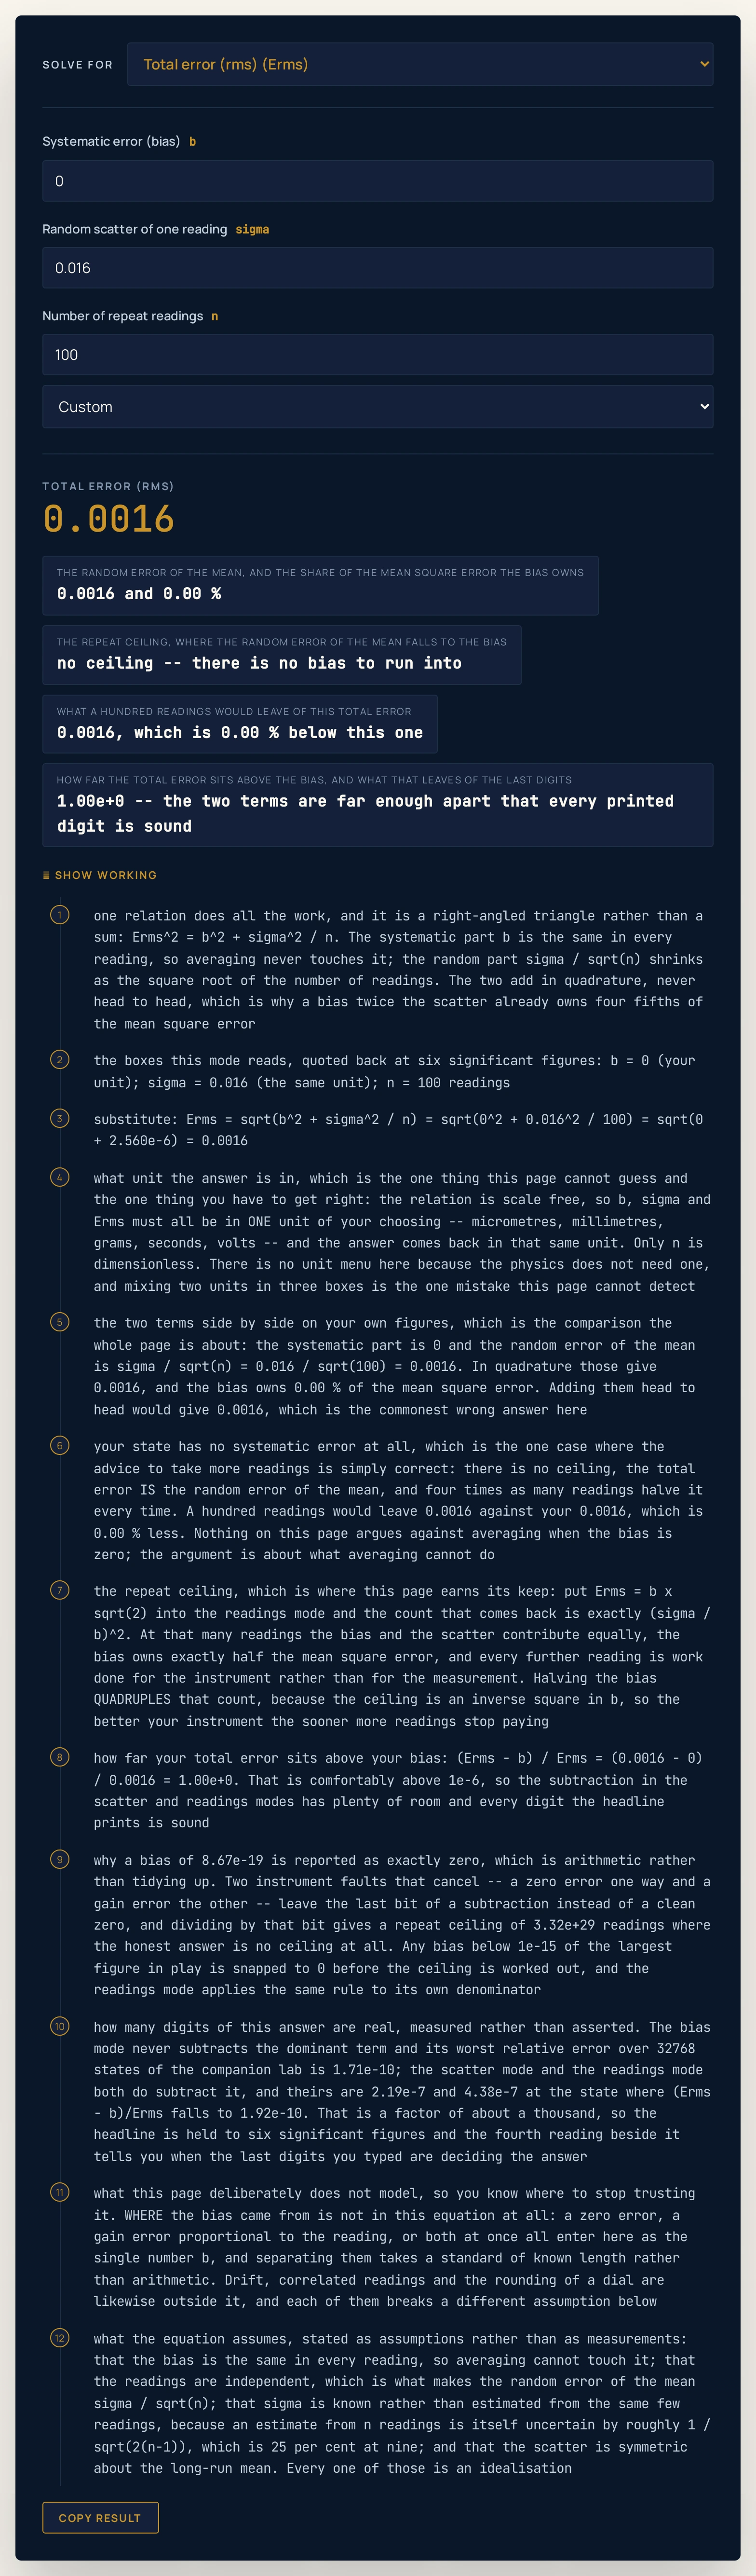
b = 0 the ceiling reading says no ceiling, the bias share is 0.00 %, and the total error is the random error of the mean. Nothing here argues against averaging — the argument is about what averaging cannot do.Where to go next
For the argument this arithmetic supports — the two kinds of fault, the single length at which a two-fault instrument reads correctly, the twenty-readings-against-twenty-swings case and the one in which a bias really can be beaten — read the systematic error guide, which this tool is the calculating half of.
Five posts pick up the pieces this page uses but does not explain. The significant figures guide and the Heisenberg uncertainty principle guide are the other two things called uncertainty, the SI units guide and the unit conversions guide are where the unit you choose comes from, and the physics constants reference is where every quoted value arrives with an uncertainty attached.
Four tools sit next to this one. The significant figures calculator handles precision as written, the uncertainty principle calculator handles the limit nature imposes, the pendulum period calculator gives the quantity the stopwatch case is about, and the unit conversions simulator is where a mixed-unit entry gets sorted out before it reaches this page.
The full physics lab library and the calculator index are open too.
Frequently asked questions
What does the systematic error calculator work out?
It solves one relation, the total error squared equals the bias squared plus the scatter squared over the number of readings, for any one of four quantities: the total error, the systematic error, the random scatter of one reading, or the number of repeat readings a target total error needs. Beside the answer it prints the random error of the mean, the share of the mean square error the bias owns, the repeat ceiling, the count it takes to detect the fault, what a hundred readings would leave, and how sensitive the answer is to the last digits you typed.
What unit should I use?
Any one unit, used in all three error boxes. The relation is scale free, so put the bias, the scatter and the total error in micrometres, millimetres, grams, seconds or volts and the answer comes back in that same unit. The number of readings is dimensionless. There is deliberately no unit menu, because the physics does not need one and a menu would turn this into a page about one instrument.
Why does averaging not reduce the systematic error?
Because the bias is the same in every reading, so the mean of the readings carries it in full. Averaging works on the part that differs from reading to reading, and the standard error of the mean falls as one over the square root of the number of readings. A systematic error has nothing to average away, which is why the relation keeps the two terms separate and adds them in quadrature.
What is the repeat ceiling and why does halving the bias quadruple it?
The repeat ceiling is the number of readings at which the random error of the mean has fallen to the size of the bias, and it is the square of the ratio of the scatter to the bias, rounded up. Past that count the total error is dominated by the instrument and more readings barely move it. Because the bias is squared in the denominator, halving it multiplies the ceiling by four: the better your instrument, the sooner more readings stop paying.
Why does the calculator sometimes answer zero instead of refusing?
Because zero is the honest answer at the boundary. Two of the four modes take the square root of a difference, and that difference is exactly zero when a total error is entirely scatter or entirely bias. An unclamped square root would return no number at all there and the page would show nothing, so both modes clamp at zero and the working says which term filled the total. A total error below the bias has no number of readings that reaches it, and that mode declines rather than returning an infinity.
Why is a tiny bias reported as exactly zero?
Because a bias below one part in a thousand million million of the largest figure in play is the remainder of a subtraction rather than a measurement. Two instrument faults that cancel, a zero error one way and a gain error the other, leave the last bit of a floating-point subtraction instead of a clean zero. Dividing by that bit gives a repeat ceiling of about three hundred thousand million million million million readings, which is arithmetic rather than physics, so the page snaps it to zero and reports no ceiling at all.
Why only six digits in the answer?
Because two of the four modes are not worth ten. The scatter mode and the readings mode both subtract the dominant term, and on the thirty-two thousand states of the companion simulator their worst relative errors are about two in ten million and four in ten million, against about two in ten thousand million for the systematic-error mode. Six significant figures is inside that, and the fourth reading beside the answer tells you when even those are being decided by the last digits you entered.
Does subtracting the bias make the reading exact?
No. Correcting a reading replaces a bias with the uncertainty of the correction, which is smaller but not nothing. The measurement equation should describe the measurement process including its corrections, which is how NIST puts it, so a corrected reading still carries a term for how well the correction itself is known. This page takes the bias as a given number and does not model where it came from or how well you know it.
Is this the same thing as significant figures?
No, and the difference is worth keeping. A figure count is a statement about how a number was written, so it is a coarse stand-in for precision and never the precision itself. A systematic error is a statement about an instrument, and the Heisenberg uncertainty principle is a statement about nature. All three limit what a measurement can tell you, and no amount of care about one of them helps with the other two.
Can I use this to find whether my instrument has a bias at all?
Only indirectly, and the working says so. Repeating a measurement with the same instrument and the same observer cannot see a fault common to both, so the only routes to a fixed bias are measuring a quantity whose value you already know or comparing against apparatus known to be more accurate. What this page gives you is the largest bias your total error and your scatter are consistent with, and the number of readings it would take to see that bias against the noise.
References & formula source
- The relation solved on this page is the additive measurement model: a single reading is the true value plus a systematic part that is the same every time plus a random part that is not. The mean of n readings carries the systematic part in full and the random part reduced by the square root of n, so the two combine in quadrature and the total error is the square root of the bias squared plus the scatter squared over n. Everything else here is that relation rearranged, or a quantity derived from the state it describes. It is stated rather than derived.
- The source for the two kinds of error and for their standard treatment is the Wikipedia article on observational error, read on 11 November 2026. Five things are quoted from it rather than paraphrased: that the model has two additive parts, a random error which may vary from observation to observation and a systematic error which always occurs with the same value when the instrument is used in the same way and in the same case; that random errors can be reduced by averaging multiple measurements while constant systematic errors cannot be removed by repeating measurements or averaging large numbers of results; that a systematic error can be either constant or related, for example proportional or a percentage, to the actual value, and that when it is constant it is simply due to incorrect zeroing; that drift is easier to detect because measurements indicate trends with time rather than varying randomly about a mean; and that a fixed systematic error can only be found either by measuring a known quantity or by comparing the readings with readings made using a different apparatus known to be more accurate.
- The second source is the NIST summary Essentials of expressing measurement uncertainty, read on 11 November 2026, which is adapted from NIST Technical Note 1297 and based on the ISO Guide to the Expression of Uncertainty in Measurement. Three things are taken from it: that components of uncertainty may be categorised according to the method used to evaluate them, with Type A being evaluation by the statistical analysis of a series of observations and Type B being evaluation by means other than that; that every component however evaluated is represented by an estimated standard deviation called the standard uncertainty; and that the measurement equation should express not simply a physical law but a measurement process, and that the quantities in it include the corrections. Neither NIST Technical Note 1297 nor the ISO Guide was read directly, and nothing is attributed to either beyond the NIST summary naming them.
- That classification matters here because it contradicts the framing this page teaches, and the honest thing is to say so. Dividing errors into random and systematic is the right thing to learn and is not how formal metrology books the arithmetic: components are classified by how they were evaluated, not by whether the cause wobbles, so the same physical fault is Type A if you estimated it by measuring a standard twenty times and Type B if you took it off a calibration certificate. This page uses the random and systematic split because it is the split that answers the question of whether more readings help.
- An independent reference script, written before this page existed and sharing no code with it, runs 208 checks with 0 failures over the whole model and prints every figure this cluster quotes. It asserts the four identities the page leans on across all 32768 states of a five-slider grid: that the bias does not depend on the number of readings, that the total error squared is exactly the bias squared plus the squared random error of the mean, that the repeat ceiling is the first number of readings at which the random error of the mean falls to the bias, and that subtracting a zero error and dividing by a gain recovers the true value exactly.
- The same script measures the conditioning of the two inverse modes rather than assuming it, and the figures printed on this page are those measurements. Across all 32768 states the worst relative round-trip error is about 1.7 in ten thousand million for the systematic-error mode, about 2.2 in ten million for the scatter mode and about 4.4 in ten million for the readings mode, the last two at the state where the total error exceeds the bias by only about two parts in ten thousand million. That is why the headline carries six significant figures rather than ten, and why the fourth reading beside the answer prints the ratio the conditioning depends on.
- The cancellation snap is measured too. A zero error of one sign and a gain error of the other cancel exactly once as the measured value changes, and on the companion simulator grid exactly one state leaves a floating-point residue instead of a clean zero: a bias of about 8.7 in ten thousand million million million. Dividing by that residue gives a repeat ceiling of about 3.3 hundred thousand million million million million readings where the correct answer is that there is no ceiling, so every bias on this page is snapped to exactly zero below one part in a thousand million million of the largest figure in play, and the readings mode applies the same rule to its own denominator.
- Every figure quoted in the prose and the tables above is either a string this calculator printed for the inputs named beside it, or a constant the cluster physics contract fixes, or a ratio the unit tests assert. Where a cell and the running widget ever part company, believe the widget. Anything this page declines to put a number on is declined because the model cannot produce one, not because the figure was omitted for brevity. This page computes; it measures nothing and has been near no instrument.
- Further reading: Observational error — Wikipedia