The water waves simulator is a free interactive lab with one wave on it and two ladders to drive it. Pick a water depth, pick a wavelength, and the panel answers with the speed of the crests and with the word for which of two shortcut rules is in reach. On arrival it reads 9.32 m/s, in between, 9.90 m/s and 10.72 s.
That opening setting is chosen to be awkward. Ten metres of water under a 100 m wave gives depth is 0.1000 of a wavelength, which is in neither regime, and the shortcut card is already +6.22% against the full relation. The two settings worth pressing first are the third and the second preset: the same 4 000 m of ocean, answered by that shortcut as +0.26% and +1485.33%.
Water Waves Simulator
One travelling wave on water of a single, constant depth. Drag the two ladders and the answer swings between two rules that have nothing in common: in shallow water the wavelength does not matter at all, and in deep water the depth does not. What decides is the ratio depth ÷ wavelength, and the lab opens on 10 m of water under a 100 m wave, where neither rule is within six per cent.
Load a Real Sea State
Each button writes the two ladders and the time slider and nothing else; the simulation does every calculation itself, exactly as it would if you had dragged them. All five put the time slider back to 0.00 periods, so every comparison below starts from the same instant.
Press the third and then the second if you only press two. Both sit in 4 000 m of ocean and the third card reads an identical 198.09 m/s for both; the first card does not agree with it twice.
Pick one of the five sea states above, or drag the three sliders yourself.
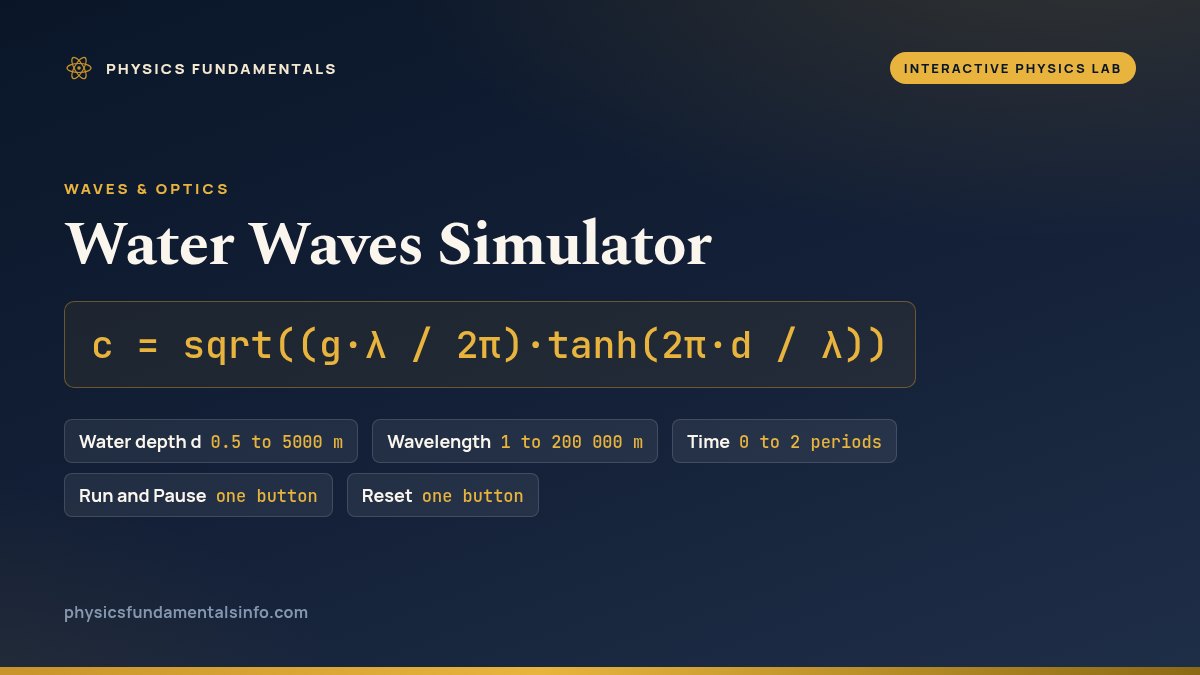
What Is the Water Waves Simulator?
The water waves simulator is a free interactive physics lab that runs in your browser, with nothing to install and no sign-up. One travelling wave sits on water of a single constant depth, and the panel answers one question about it: of the two shortcut rules for its speed, which one is this wave in reach of?
Two ladders drive it. Water depth d steps through 24 fixed values from 0.5 m to 5000 m, and Wavelength through 25 fixed values from 1 m to 200 000 m. Every state the lab can reach is one of those 600 pairs, which is why any reading on this page can be arrived at exactly rather than approached.
Four cards carry the answer. Wave speed prints the speed of the crests, Which water is this? prints one of three words, sqrt(g*d) gives prints what the shallow-water shortcut would have said, and Period prints how long one crest takes to replace the last. On arrival they read 9.32 m/s, in between, 9.90 m/s and 10.72 s.
The lab opens on 10 m of water under a 100 m wave on purpose. That is the awkward case: the ratio card reads depth is 0.1000 of a wavelength, which is neither of the two regimes, and the shortcut is already +6.22% against the full relation. Nothing is broken; the opening state is simply one that no rule of thumb handles.
The third card is the one to watch, because its sub-line is a signed percentage with no branch in it. Drag Wavelength left to 1 m at that same depth and it reads +692.67% against the full relation; drag it right to 200 000 m and it reads +0.00%. The depth never moved, so the shortcut card never moved either - only the gap did.
Three words are all the second card ever prints: shallow water when the ratio rounds to 0.0500 or below, deep water when it rounds to 0.5000 or above, and in between for everything else. Both boundaries are inclusive, and the test is made on the ratio as displayed rather than on a hidden float, so 0.0500 reads shallow water and not the other way about.
Across the whole grid the three words are not evenly spread. Of the 600 reachable states, 202 read shallow water, 102 read in between and 296 read deep water, so more than one state in six is a case where neither shortcut is worth having.
A compact grid under the cards gives four more readings. They are depth ÷ wavelength to four decimal places, sqrt(g*wavelength/2pi) gives for the other shortcut, the energy travels at, and wave speed in km/h. At the opening state they read 0.1000, 12.50 m/s, 8.29 m/s and 33.57 km/h.
The energy row is a real distinction rather than a detail. The speed on the first card is the speed of the crests, and in deep water the energy travels at exactly half of it: on Wind waves far out at sea the cards read 12.50 m/s while that row reads 6.25 m/s. In shallow water the two coincide, and The same tsunami on the shelf prints 9.90 m/s in both places.
Five preset buttons on this landing page write the three sliders and recompute nothing. They load a swell on a beach, wind waves far out at sea, a tsunami in the deep ocean, that same tsunami on a shelf, and harbour chop. Every one of them puts the time slider back to 0.00 periods.
The pair worth pressing in order is the third and then the second. Both sit in 4 000 m of water. The 200 km wave reads shallow water at 197.57 m/s with the shortcut +0.26% against the full relation; the 100 m wave in that same water reads deep water at 12.50 m/s with the same shortcut +1485.33% out.
The Time slider counts periods, not seconds, and runs from 0.00 periods to 2.00 periods in hundredths. Run animates it to the far end, flips its own label to Pause and stops there by itself; it advances nothing else, so the two ladders stay exactly where you left them. Reset restores 10 m, 100 m and 0.00 periods.
Counting in periods is what makes one animation serve every setting. Ten real seconds move a tsunami crest less than one per cent of its own wavelength while they carry harbour chop through 3.64 whole wavelengths, so a clock in seconds would be motionless on one preset and a blur on another. The period in seconds is printed on the fourth card instead.
The drawing beside the panel is three labelled bands. The top band carries the regime word in capitals with the rule that applies under it, the middle band draws the surface over exactly two wavelengths with one crest marked, and the bottom band is a logarithmic axis for depth divided by wavelength with ticks at both boundaries.
The middle band’s vertical is not to scale, and its caption says so at every width it is drawn at. There is no wave height anywhere in this model, so the drawn depth of a trough is a pixel count and never a measurement. The bottom band is a ratio on a log axis, which is not a length in metres either, so no length in one band may be read against a length in the other.
Nothing here is measured. The lab is told the depth and the wavelength and works the rest out, so the crest crossing one wavelength in one period is the definition of the speed restated as a picture rather than evidence for it. What the two ladders are for is the comparison: hold one, move the other, and watch which shortcut the answer walks away from.
The assumptions are the lab’s own and are printed in a fixed line under the drawing: small amplitude, one constant depth, gravity as the only restoring force, and no wind, current or viscosity. They are not measurements of any ocean. The wavelength ladder starts at 1 m so the lab never reaches the very short waves where surface tension, not gravity, is in charge.
| Control | Range | Step, default and what it moves |
|---|---|---|
| Water depth d | 0.5 to 5000 m | a ladder of 24 fixed rungs - 0.5, 1, 2, 3, 5, 7, 10, 15, 20, 30, 50, 70, 100, 150, 200, 300, 500, 700, 1000, 1500, 2000, 3000, 4000 and 5000 m - so the slider itself steps 1 index at a time and opens on rung 6, where the label reads "10 m". The depth is the only thing the "sqrt(g*d) gives" card depends on: drag the wavelength ladder from end to end and that card does not move a character |
| Wavelength | 1 to 200 000 m | a ladder of 25 fixed rungs from 1 m to 200 000 m, stepping 1 index at a time and opening on rung 11, where the label reads "100 m". It starts at 1 m rather than at zero because gravity is the only restoring force in the model, and the very short waves where surface tension takes over are outside what this lab can honestly answer |
| Time | 0 to 2 periods | step 0.01, opens at 0, and the label reads "0.00 periods". It counts periods and not seconds, because the five presets span over 350x in real time: one period advances the drawn surface by exactly one wavelength at every setting, so two periods is two wavelengths whether the wave takes 2.74 s or 1012.29 s to make one |
| Run and Pause | one button | one button that animates the time slider to 2.00 periods, flips its own label to Pause while it runs and stops of its own accord at the far end. It advances the time slider and nothing else, so the depth, the wavelength and every physics figure on the panel are untouched by a run. Pressing Run a second time while one is already in flight does nothing |
| Reset | one button | restores the opening state - 10 m of water, a 100 m wavelength and 0.00 periods - and replays the settle, so the scene is drawn in rather than cut to. That opening state reads "in between" at 9.32 m/s, which is deliberate: it is the case neither shortcut handles |
How to Use the Simulator
- Read the four cards before you touch anything. They are already answering for 10 m of water under a 100 m wave: Wave speed
9.32 m/s, Which water is this?in between, sqrt(g*d) gives9.90 m/s, and Period10.72 s. - Read the sub-line under each card, because that is where it shows its working. They read
from the full relation, at 10 m deep,depth is 0.1000 of a wavelength,+6.22% against the full relationandone crest passes a fixed point every 10.72 s. The third of those is the reading this lab is built around. - Drag Wavelength all the way left and watch the second card, not the first. At
1 mthe regime has gone todeep water, the speed has fallen to1.25 m/s, and the third card still reads9.90 m/s— now+692.67% against the full relation. The depth never moved, so that card never moved either. - Now drag Wavelength all the way right. It passes
deep water, thenin between, then at200 mit readsshallow waterwith the ratio exactly0.0500and the shortcut+1.62%high. By200 000 mthe speed is9.90 m/sand the shortcut is+0.00%. - Hold the wavelength and move Water depth d instead. Every card changes this time, including the third, because the depth is the only thing that shortcut contains. This is the asymmetry the whole lab turns on: one rule ignores the wavelength and the other ignores the depth, and the ratio decides which you are allowed.
- Press Run and watch what it does and does not move. The button flips its own label to Pause, animates the time slider to
2.00 periodsand stops there by itself. Every physics reading on the panel is untouched: a run advances the picture and nothing else. - Drag Time by hand to
0.50 periodsand then to1.00 periods. At a half period the marked crest has moved half a wavelength along; at a full period the surface is back to the shape it started with. That is the definition of the speed being drawn, not a measurement of it. - Press Tsunami crossing the deep ocean, then The same tsunami on the shelf, and watch only the Period card. The speed falls from
197.57 m/sto9.90 m/sand the wavelength from200 000 mto10 000 m, while the period moves from1012.29 sto1009.64 s. That is shoaling in two clicks. - Press Reset when you have finished. It puts the three sliders back to
10 m,100 mand0.00 periodsand replays the opening settle, so the scene is drawn in rather than cut to.
Dragging is the right way to find out which readings move together and a poor way to land on a particular figure, because both ladders step by whole rungs rather than by metres. The five preset buttons above exist for that reason, and the written guide to water waves is where the two regimes are defined from scratch and the problems are worked with every step shown.
One thing this panel cannot do is take a depth or a wavelength that is not on a rung, and the inverse questions are beyond it altogether. The water wave speed calculator takes typed figures, and it will also run the problem backwards: a wavelength from a timed period, or a depth from a measured speed, neither of which can be read off a slider.
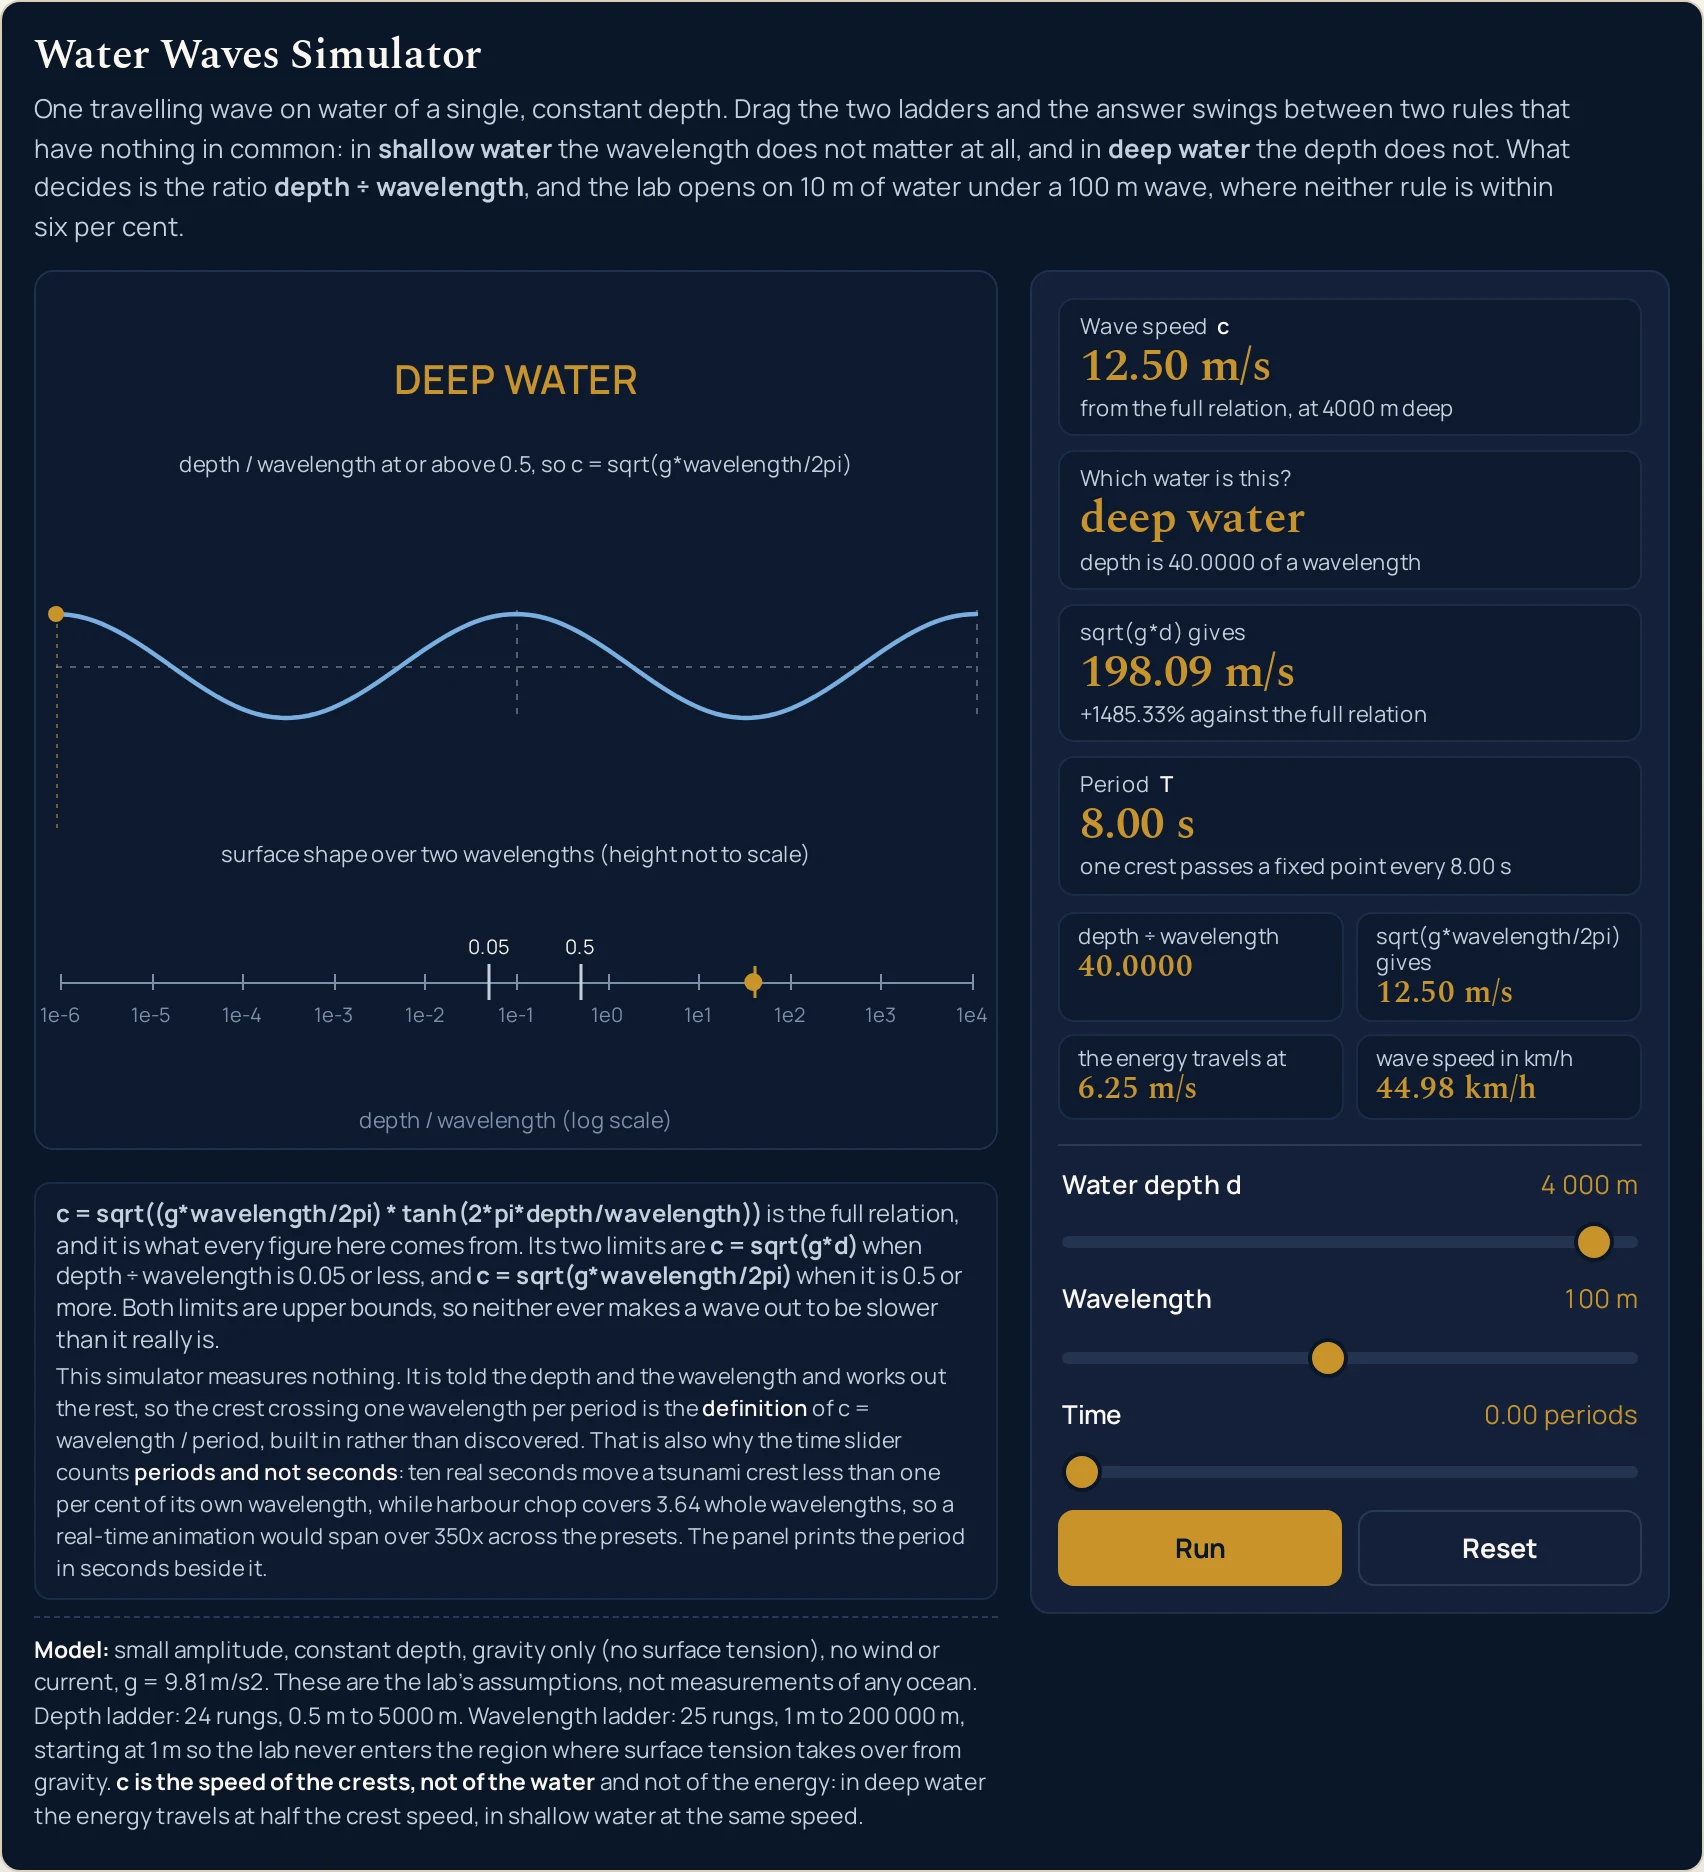
4 000 m of water the shallow-water shortcut claims 198.09 m/s for a wave that is actually doing 12.50 m/s. The band text is what the drawing paints at this page’s own width; it shortens on a narrow column, band by band.Worked Example: The Same 4 000 Metres, Two Different Answers
Nothing in the three tables below was worked out here. Each row is a setting the lab was put into through its own sliders and then read back from, cell by cell, so every string in them is the panel’s own. The first table is the pair the whole lab was built around.
One: one depth, one shortcut, two answers it cannot both be right about
Press Tsunami crossing the deep ocean and then Wind waves far out at sea. Only the wavelength ladder moves between them; the depth stays on the same rung, so column six is the same string twice.
| What was loaded | Wavelength | Wave speed | Which water is this | Depth divided by wavelength | What the shallow rule gives | How far out that is | Period |
|---|---|---|---|---|---|---|---|
| Tsunami crossing the deep ocean | 200 000 m | 197.57 m/s | shallow water | 0.0200 | 198.09 m/s | +0.26% against the full relation | 1012.29 s |
| Wind waves far out at sea | 100 m | 12.50 m/s | deep water | 40.0000 | 198.09 m/s | +1485.33% against the full relation | 8.00 s |
Read column six first and then stop. It is 198.09 m/s in both rows, because it is worked from the depth alone and the depth did not change. The water is identical. If that shortcut were the rule for water-wave speed, these two waves would travel at the same speed, and column three says they do not.
Column seven is the size of the mistake. One wave is answered to +0.26% and the other to +1485.33%, a factor of 15.85 out, by the same arithmetic in the same water. Column five is the only thing that separates them: 0.0200 against 40.0000.
Note which way the error runs. Both shortcuts are upper bounds on the true speed, so no percentage on this panel can ever be negative and no shortcut can ever make a wave out to be slower than it is. Over the whole 600-state grid the sub-line runs from +0.00% to +17624.54% and never once carries a minus sign.
Two: the five sea states, and what each one is for
These are the buttons above with the readings they produce at 0.00 periods. The last two columns are the ones to read across: the error column swings by four orders of magnitude while the period column stays legible.
| Preset | Water depth | Wavelength | Wave speed | Which water is this | How far the shallow rule is out | Period |
|---|---|---|---|---|---|---|
| Swell rolling onto a beach | 2 m | 50 m | 4.38 m/s | shallow water | +1.04% against the full relation | 11.41 s |
| Wind waves far out at sea | 4 000 m | 100 m | 12.50 m/s | deep water | +1485.33% against the full relation | 8.00 s |
| Tsunami crossing the deep ocean | 4 000 m | 200 000 m | 197.57 m/s | shallow water | +0.26% against the full relation | 1012.29 s |
| The same tsunami on the shelf | 10 m | 10 000 m | 9.90 m/s | shallow water | +0.00% against the full relation | 1009.64 s |
| Harbour chop, neither one nor the other | 2 m | 10 m | 3.64 m/s | in between | +21.58% against the full relation | 2.74 s |
Rows one and three are the same kind of wave, and nothing about their size says so. A 50 m swell in 2 m of water and a 200 km wave under 4 km of ocean both read shallow water, both are answered by the shortcut to about one per cent, and the ratio axis in the drawing puts their markers within a third of a decade of each other.
Row five is the one with no rule of thumb at all. Harbour chop at 2 m and 10 m reads in between, and the shortcut is +21.58% out — too wrong to use and not wrong enough to be obviously wrong. Across the whole grid 102 of the 600 states are in that position.
Three: the same wave in two depths, and the reading that survives
Press Tsunami crossing the deep ocean and then The same tsunami on the shelf. This table is transposed so that the two presets are the columns, because the interesting comparison is down a column rather than across a row.
| Panel reading | Tsunami crossing the deep ocean | The same tsunami on the shelf |
|---|---|---|
Water depth d |
4 000 m | 10 m |
| Wavelength | 200 000 m | 10 000 m |
| depth ÷ wavelength | 0.0200 | 0.0010 |
| Which water is this? | shallow water | shallow water |
Wave speed c |
197.57 m/s | 9.90 m/s |
| wave speed in km/h | 711.26 km/h | 35.66 km/h |
sqrt(g*d) gives |
198.09 m/s | 9.90 m/s |
| how far out that is | +0.26% against the full relation | +0.00% against the full relation |
| the energy travels at | 196.54 m/s | 9.90 m/s |
Period T |
1012.29 s | 1009.64 s |
The last row is the one that makes the table worth reading. The speed falls by a factor of 19.95 and the wavelength by exactly 20.00, while the period goes from 1012.29 s to 1009.64 s — a quarter of one per cent. That 19.95 is the ratio of the two speeds before the panel rounded them for display, so dividing the two figures as the table prints them lands slightly high. Crests arrive at the rate they were generated at, so the period is what a change of depth leaves alone.
That is also why the shelf preset carries a 10 km wavelength rather than the 200 km it started with. Pairing 10 m of water with a 200 km wave would describe something of period 20192.75 s, which is five and a half hours between crests and is not that tsunami or anything else. The wavelength shortens in step with the speed; saying it is unchanged is the easiest false sentence on this topic.
If the period is the reading that survives, it is worth knowing what else it fixes. The guide to the frequency formula is where its reciprocal is set out, and that is the quantity a buoy or a stopwatch actually records offshore.
Formula and Symbol Reference: Every Slider and Every Readout
The band at the head of this page is the full relation, and both of the famous shortcuts are approximations to it rather than laws of their own. Each one is quoted with the ratio condition that licenses it, because without that condition neither of them is a true sentence.
The symbol column below uses the panel’s own names for its readings. Where a reading is a quantity with a life outside this lab, the SI unit column says so; where it is a word or a count, it says that instead. The guide to the wavelength formula and its units is where the wavelength is treated as a quantity in its own right, which this page deliberately does not do.
| Symbol or readout | Meaning | SI unit | In this lab |
|---|---|---|---|
| c | The wave speed the lab is about: the rate at which the crests advance. It is never the speed of the water and never the speed of the energy, and the panel keeps a separate row for the last of those | metre per second (m/s) | the first card, to 2 d.p. Across all 600 reachable states it runs from 1.25 m/s, at the corner where 0.5 m of water meets a 1 m wave, to 220.57 m/s, at 5000 m under a 200 km wave. Its sub-line names where it came from and at what depth, as from the full relation, at 4000 m deep. |
| d | The water depth, assumed constant everywhere under the wave. It is the quantity the shallow-water shortcut depends on and the one the deep-water shortcut ignores completely | metre (m) | a ladder of 24 rungs, 0.5 m to 5000 m, opening on 10 m. The slider itself steps one index at a time, so no intermediate depth exists. Large values carry a thousands separator in the label span: 4 000 m and 5 000 m. |
| λ | The wavelength, crest to crest. It is the quantity the deep-water shortcut depends on and the one the shallow-water shortcut ignores, which is the whole of the symmetry this lab is built around | metre (m) | a ladder of 25 rungs, 1 m to 200 000 m, opening on 100 m. The floor of 1 m is deliberate rather than cosmetic and is explained under “Where It Breaks Down”. |
| d / λ | The ratio that decides everything. The regime word, both shortcuts and the size of the error between them are all functions of this one number and of nothing else about the wave | dimensionless | the first grid row, to 4 d.p. It spans 0.0000 at 0.5 m under a 200 km wave to 5000.0000 at 5000 m under a 1 m wave. The regime test is made on the figure as displayed, so a row printing 0.0500 is classified as that and not by a hidden float underneath it. |
| T | The period: how long one full wavelength takes to pass a fixed point. It is the reading that survives a change of depth, which is why the shoaling table above is built on it | second (s) | the fourth card, to 2 d.p., with the sub-line one crest passes a fixed point every 11.41 s. At the four corners of the grid it reads 0.80 s, 90304.73 s, 0.80 s and 906.75 s. |
| g | Gravitational field strength, the only restoring force in the model and the only constant in it. There is nothing to set and nothing to choose | metre per second squared | fixed at 9.81 m/s2 and printed in the model line under the drawing. It is stated once, here, and the lab offers no way to vary it. |
| nT | Elapsed time, counted in wave periods rather than in seconds. It changes the picture and nothing else: no physics reading on the panel depends on it | periods (not an SI quantity) | 0 to 2, in steps of 0.01, opening at 0.00 periods. At 1.00 periods and 2.00 periods the drawn surface is back to the shape it had at zero, to within a millionth of a pixel. |
| which water is this | The regime word, and the only reading on the panel that is not a number. It describes the wave and the water together, never the water on its own | not a physical quantity | the second card, with exactly three values: shallow water at a ratio of 0.0500 or below, deep water at 0.5000 or above, and in between for the rest. Both boundaries are inclusive. Of the 600 reachable states, 202 read the first, 296 the second and 102 the third. |
| sqrt(g*d) gives | What the shallow-water shortcut would have told you at this setting, whether or not the setting is in shallow water. Printing it everywhere is the point: it is only trustworthy where the ratio says so | metre per second (m/s) | the third card, with a signed percentage under it in one unbranched format. It runs from +0.00% against the full relation to +17624.54%, the latter at 5000 m of water under a 1 m wave. It never carries a minus sign, because the shortcut is an upper bound. |
| sqrt(g*wavelength/2pi) gives | What the deep-water shortcut would have told you, again at every setting. It is the mirror of the card above and the two agree with the first card at opposite ends of the grid | metre per second (m/s) | the second grid row. On Wind waves far out at sea it reads 12.50 m/s, exactly the first card; on Tsunami crossing the deep ocean it reads 558.80 m/s against a real 197.57 m/s. |
| the energy travels at | The speed at which the energy of the wave actually moves, which is not the speed of the crests. This is a real distinction rather than a footnote, and the panel gives it a row of its own | metre per second (m/s) | the third grid row. In deep water it is exactly half the first card — 6.25 m/s against 12.50 m/s on the sea preset — and in shallow water the two coincide, both reading 9.90 m/s on the shelf preset. |
| wave speed in km/h | The first card again, in the unit most people have an instinct for. Nothing is computed differently; it is the same reading in a different unit | kilometre per hour | the fourth grid row, to 2 d.p. It is what turns 197.57 m/s into 711.26 km/h and 9.90 m/s into 35.66 km/h, which is the pair that makes the shoaling table legible. |
If you read one row twice, make it the fourth. Everything else on the panel — the regime word, both shortcut cards, the size of the gap between them — is a function of that one ratio and of nothing else about the wave.
Reading the Diagram: Three Bands and Two Scales
The drawing is laid out as three bands and the bands are reserved before anything is placed in them, so no part of it is ever painted across another. The top band carries the classification, the middle band carries the surface, and the bottom band carries the ratio that decided the top one.
| Part of the drawing | What it paints | What it does not claim |
|---|---|---|
| the regime band | The top band. One phrase in capitals — the regime word the second card prints — and under it the rule that applies at this setting, with the condition attached to it. Nothing else is painted in this band | it never names a formula without the ratio condition that licenses it, and in the middle regime it says that neither limit applies |
| the surface band | The middle band. The shape of the surface over exactly two wavelengths, with one crest marked, advancing exactly one wavelength for each period on the time slider | its vertical is not to scale and the caption says so at every width. There is no wave height in the model, so the drawn depth of a trough is a pixel count and not a measurement of anything |
| the ratio axis | The bottom band. A logarithmic axis for depth divided by wavelength with labelled decade ticks, two extra ticks at the boundaries 0.05 and 0.5, and a marker at the current setting | it is a ratio and not a length, so nothing on it may be measured against anything in the band above. The two boundary ticks sit exactly one decade apart at every width |
| what the picture is for | Seeing that two waves nothing alike land in the same place. The tsunami preset marks 0.0200 and the swell preset 0.0400, within a third of a decade of each other and both left of the shallow tick | it is not evidence. The axis is drawn from the two numbers you set, so it shows you the classification rather than discovering it |
The middle band’s vertical is not to scale, and that is a statement about the model rather than about the drawing. Linear theory has no amplitude in it anywhere, so there is no height for the picture to be in proportion to. The caption keeps those words at every width the band is drawn at, and where even the bare clause will not fit, the band is not drawn.
The bottom band is a ratio on a logarithmic axis, which is a different kind of quantity entirely. It spans a millionth to ten thousand, which is wide enough that every reachable state sits inside it with room over, and the two boundary ticks are exactly one decade apart at every width. Nothing on it is a length in metres, so nothing on it may be measured against the band above.
Where the height of a wave belongs as a quantity, with a definition and a unit, is the guide to amplitude. It is absent here because the model cannot produce it, not because the drawing ran out of room.
The Physics: Why One Formula Has Two Faces
One function does all of this. The full relation contains a hyperbolic tangent whose argument is the depth divided by the wavelength, scaled by two pi, and that function behaves completely differently at its two ends. Everything the panel prints is a consequence of that single curve.
At the shallow end the tangent is close to its own argument and the wavelength cancels out of the arithmetic, so the speed is fixed by the depth. Hold the depth at 2 m and run the wavelength from 2 000 m to 50 000 m, a factor of twenty-five, and the first card reads 4.43 m/s at every single rung. Shallow water is non-dispersive, and the panel shows it as a column of identical strings.
At the deep end the tangent is close to one and the depth drops out instead, so the speed is fixed by the wavelength and longer waves are faster. Sit on 5 000 m of water: a 500 m wave reads 27.94 m/s and a 2 000 m wave reads 55.88 m/s. Four times the wavelength is exactly twice the speed, at a ratio of 10.0000 and 2.5000 respectively.
Between those two ends there is no shortcut, and the lab is blunt about how much room that occupies. Of the 600 reachable states, 202 read shallow water, 296 read deep water and 102 read in between. More than one state in six is a case where you have to use the full relation or accept an error you have not measured.
Even at the boundaries the shortcuts are approximations, and the panel prints the size of it. Set 5 m under a 100 m wave for a ratio of exactly 0.0500 and the third card reads +1.62% against the full relation; set 50 m for exactly 0.5000 and the deep-water row reads 12.50 m/s against a real 12.47 m/s. A boundary is where an approximation becomes tolerable, not where it becomes exact.
Why the depth should enter the arithmetic at all comes down to one mechanism, and this is the only line on the page that mentions it: under every crest the water itself runs round closed loops whose reach extends some way downwards, and a seabed shallow enough to cut across those loops is a seabed the wave notices. Anything further about how the water moves belongs to the guide to transverse and longitudinal waves, which is also where what type of wave this is gets settled.
Be blunt about what the simulator is doing, because a panel that keeps agreeing with itself can look like a panel that has found something out. It has not. The simulator measures nothing: it is told the depth and the wavelength and works out the rest, so the crest crossing one wavelength per period is the definition of the speed built into it rather than discovered by it, and the honesty line under the drawing says so in its own words.
What the two ladders are genuinely for is the other direction. They let you hold one quantity still and move the other, then watch the answer walk away from a shortcut you were about to trust — and that is a thing no still picture of a sea can show you. It is also why the time slider is a slider and not only a Run button: every instant is a state you can set and read.
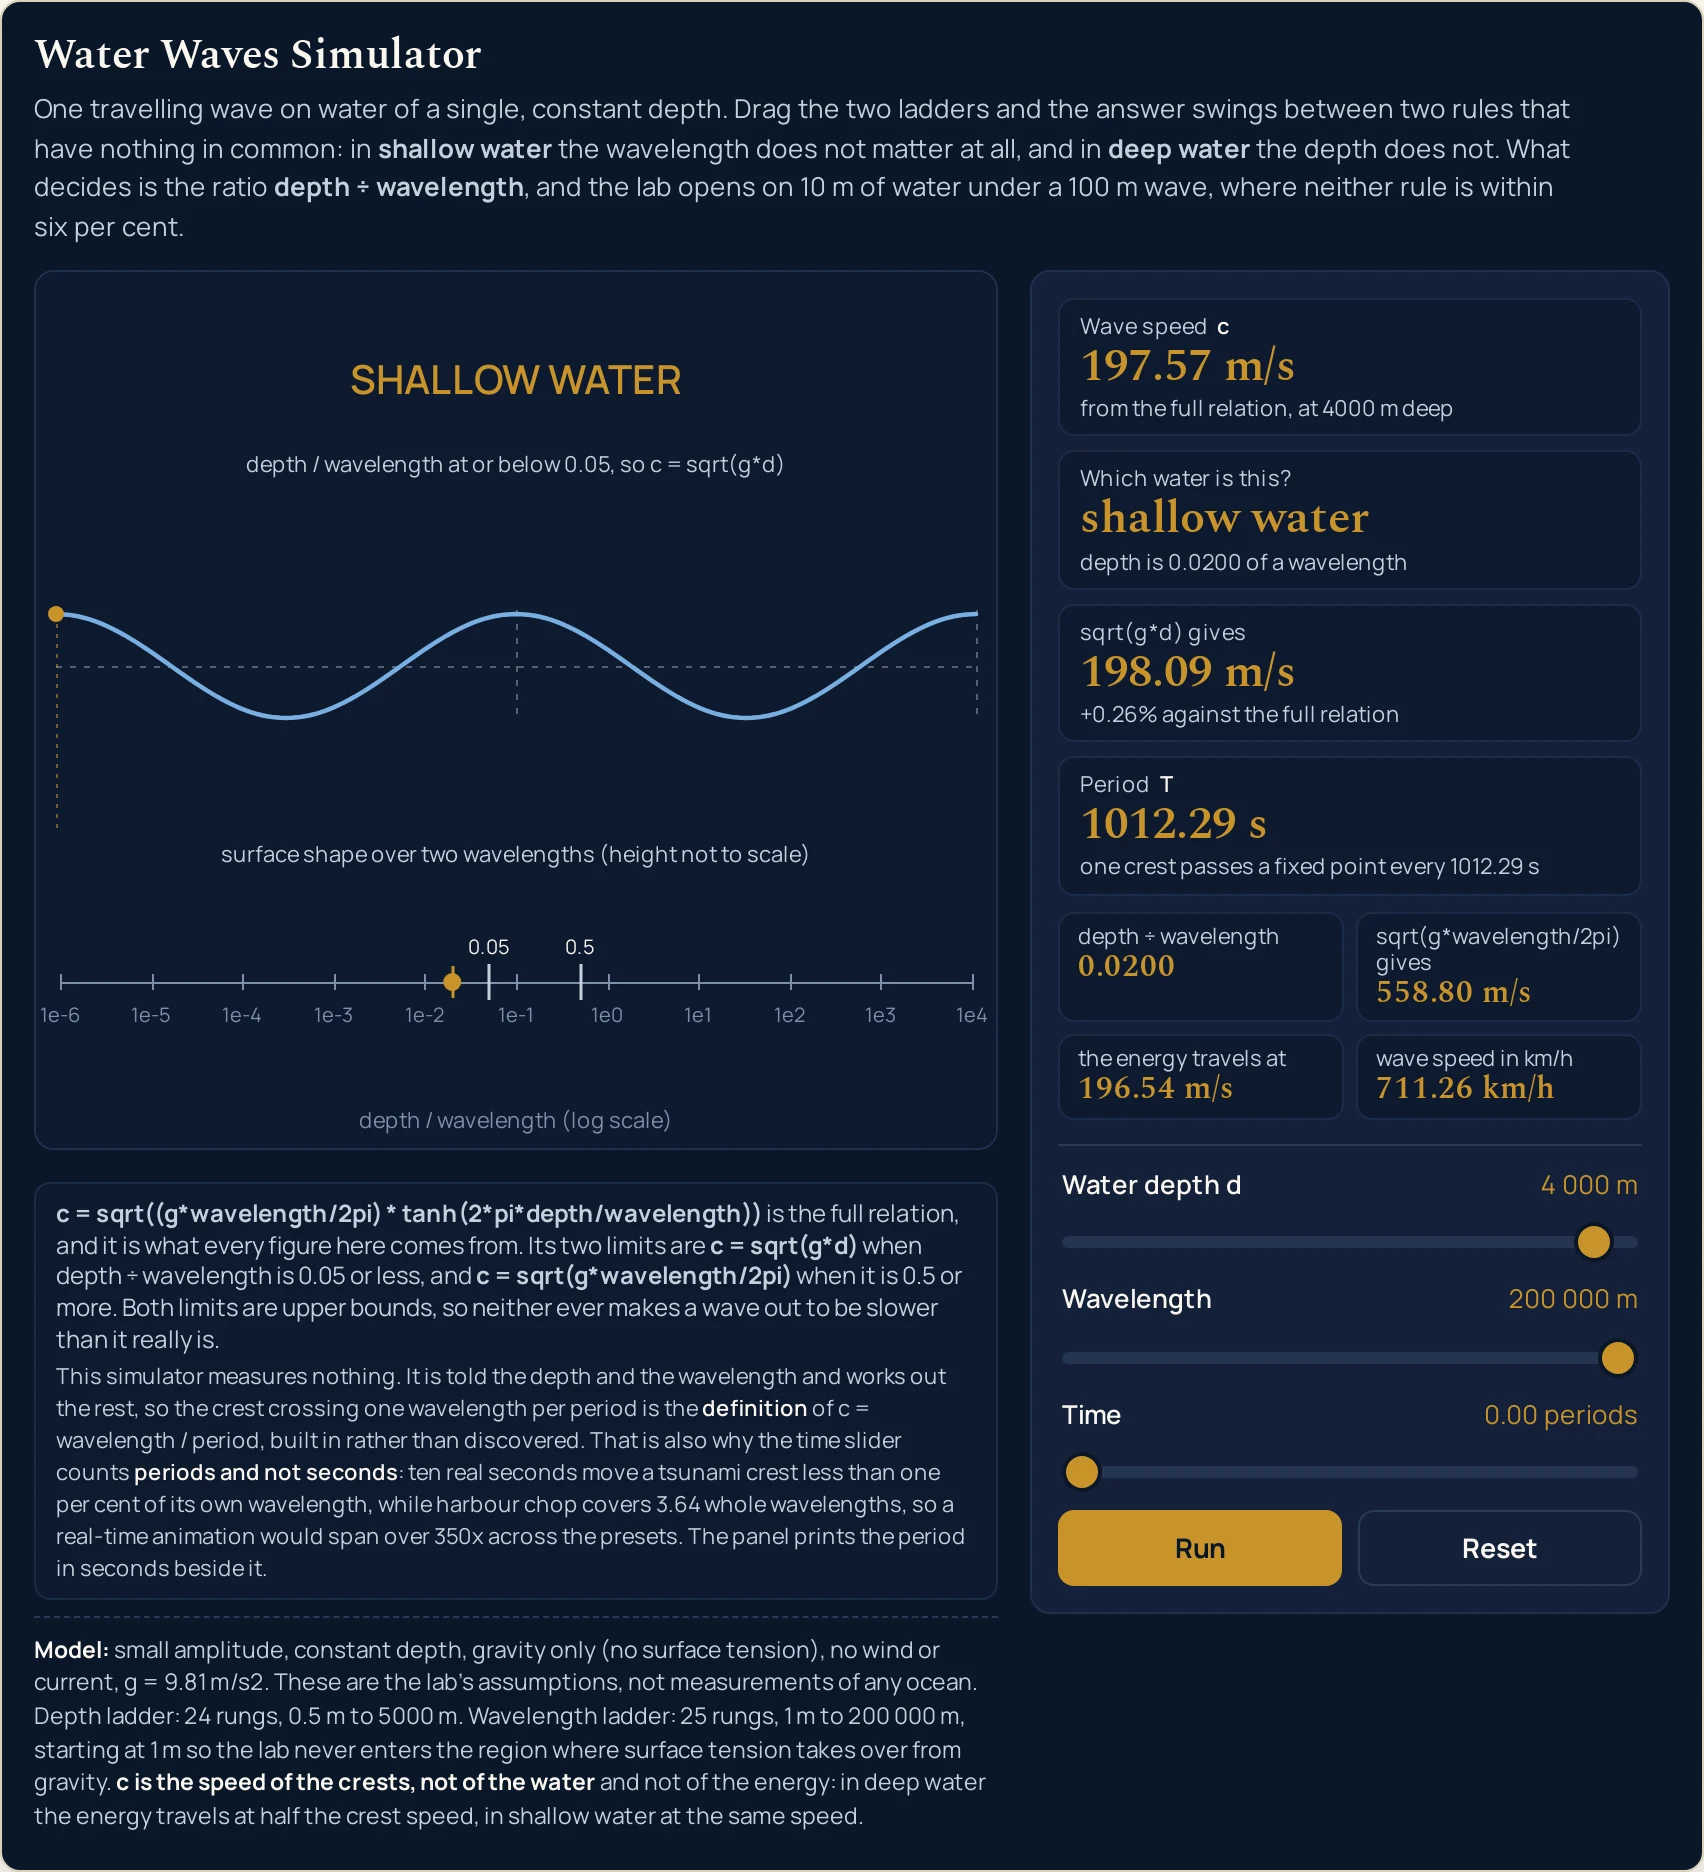
+0.26%. Four kilometres of ocean is shallow water for a wave 200 km long. The marker on the ratio axis has moved left of the shallow tick, and the band text is what this page’s own width paints.Where It Breaks Down
Every state the two ladders can reach is answered, and the arithmetic is not where this lab can let you down. What it cannot do is model a real sea, and what it chooses not to do is treat its own idealisations as facts. Six limits sit under every reading on this page.
- There is no wave height anywhere in the model, and that is the big one
- Linear theory is a small-amplitude theory, so the height of the wave is not a quantity this lab contains. It follows that nothing here can tell you how tall a wave gets, how much energy it carries or how far up a beach it runs, and no figure for any of those appears on this page. A shoaling wave does rear up — the speed and the wavelength both fall and the energy has to go somewhere — but the direction is all that is supported, and the drawn surface in the middle band is a fixed pixel height for exactly this reason.
- Nothing here predicts breaking
- A real wave breaks when it becomes too steep, and that is precisely the point at which a small-amplitude theory stops applying. So the moment you most want a prediction is the moment every figure on this panel stops being valid. There is no steepness criterion printed anywhere in the lab, because the model cannot produce one, and a lab that printed one would be inventing it.
- The depth is one number and a real seabed slopes
- One constant depth under the whole wave is what lets a single speed exist at all. A real beach shelves continuously, so the speed changes continuously with it, and the two-click shoaling comparison in the third table above is a snapshot of a gradual process rather than two states any wave is ever in at once. The lab has no way to represent a slope, and the companion calculator has no way either.
- The wavelength ladder stops at 1 m on purpose
- Gravity is the only restoring force in this model, and for very short waves on water it is not the force in charge: surface tension is, below roughly 1.7 cm of wavelength. Rather than answer in a region where the physics is the wrong physics, the ladder’s lowest rung is 1 m and the lab simply cannot be taken there. The guide to surface tension is the force that takes over at the bottom of that range.
- Four things the open sea has that this model does not
- Wind, flow, friction within the water and the turning of the Earth are all outside the relation, so the first card gives a speed measured against still water and against nothing else. Put a tidal stream under the same wave and the crests reach you at a different rate; this lab has no box for that and will not do the addition. Whether the medium rather than the depth is what changes is a different question entirely, and the guide to wave speed in other media is where it belongs.
- The first card is the speed of the crests, and the third grid row is not the same thing
- The pattern advances at the speed on the first card; the water itself goes nowhere in particular and the energy travels at the speed in the third grid row. In deep water those two differ by a factor of two —
12.50 m/sagainst6.25 m/son the sea preset — and quoting the first as the speed at which something floating would be carried is the most common way to misread this panel.
Where the Depth Rule Is Actually Used
- Working out how long a wave takes to cross an ocean
- Warning systems compute arrival times from a depth chart, because in the shallow-water regime the speed is the depth and nothing else. The lab gives the scale of it: at
4 000 m, with a ratio of0.0200, a 200 km wave moves at711.26 km/h, and at10 mthe same wave is down to35.66 km/h. A deep basin is crossed in hours and the last few kilometres are not. - Turning a buoy’s period record into a forecast inshore
- Offshore instruments record the period, which is exactly the reading a change of depth leaves alone, so a period measured far out still describes the wave when it arrives. The shoaling table above is that in two settings:
1012.29 sagainst1009.64 swhile the speed falls twentyfold. Anyone working the other way — wavelength from a period — needs the inverse the sliders cannot do. - Deciding whether a dredged channel will change how waves arrive
- Deepening a channel makes the water faster for a shallow-water wave, so the part of a crest over the channel runs ahead of the part beside it and the crest turns. The direction is always the same: a crest swings towards the slower, shallower side. The panel gives the two speeds but not the angle; for the swell preset’s period, this cluster’s reference computation turns a 30-degree arrival offshore in
50 mof water into 7.60 degrees on a 2 m shelf, and the guide to refraction is where the law behind that belongs. - Knowing when a long wave will keep its shape across a shallow sea
- In the shallow-water regime every wavelength travels at the same speed, so a long disturbance crossing a shelf sea does not spread out into its components on the way. The lab shows it as a column of repeated strings: at
2 mof depth, the first card reads4.43 m/sfor every wavelength from2 000 mto50 000 m. That is why surge and tide-scale waves are modelled with the depth alone. - Explaining why the long swell from a distant storm arrives first
- In deep water longer waves are genuinely faster, so a storm’s output sorts itself out over the ocean and the long stuff reaches the coast days ahead of the short. The lab’s own numbers at
5 000 m:27.94 m/sfor a500 mwave against55.88 m/sfor a2 000 mone. Set the depth shallow instead and the sorting stops happening at all. - Working out which waves a harbour entrance actually has to stop
- Two waves in the same approach depth can be in different regimes, which is why a marina screen that works against swell can fail against chop. In
2 mof water a50 mswell readsshallow waterat4.38 m/swhile a10 mchop readsin betweenat3.64 m/s, and only one of those is predictable from the depth. For waves crossing into a different medium rather than a different depth, the wave speed lab is the one to open.
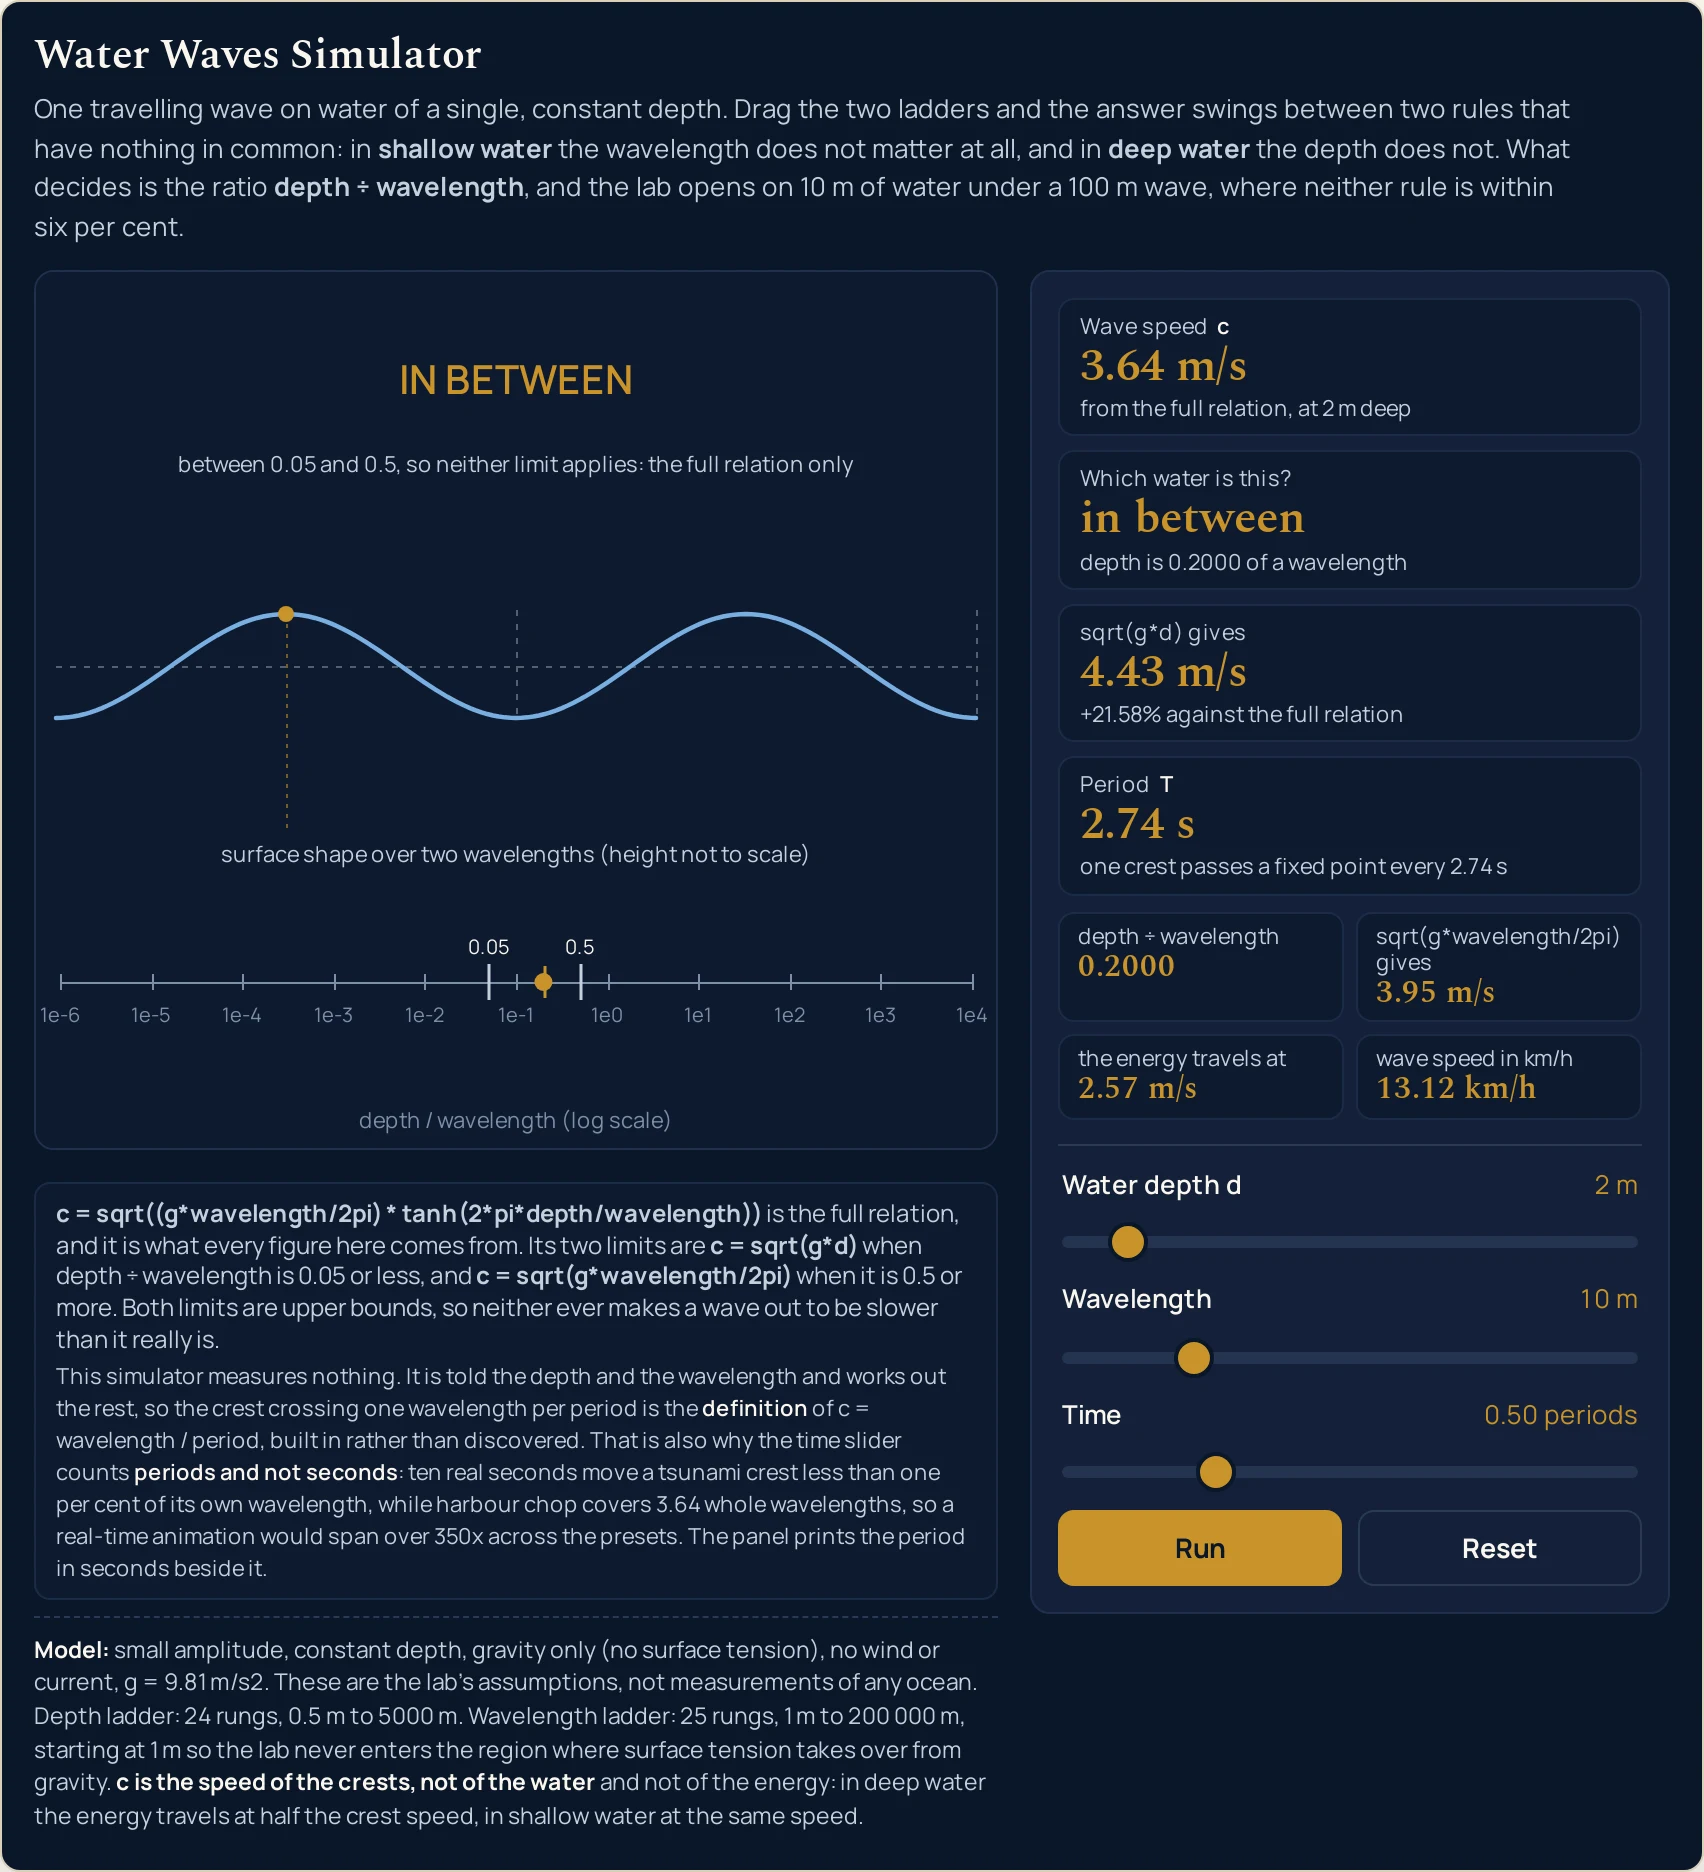
0.50 periods, so the marked crest has travelled half a wavelength. This is the third regime: in between, with the shortcut +21.58% out and the top band saying outright that neither limit applies. The time slider moved the picture and not one figure.Where to Go Next
A panel can put you in a state and let you move one thing at a time, and that is the end of what a panel is for. Water waves is where the subject itself is written out: both regimes defined separately with their own conditions, the decision between them, the shoaling chain worked through, and problems with every step shown.
Two guides sit either side of this one. The guide to wave speed in other media is the separate question of what fixes a wave speed when the medium rather than the depth is what changes, and the guide to transverse and longitudinal waves is where what type of wave a water wave is gets answered properly.
Four more pick up what this lab leaves out. The wavelength formula and units guide treats the wavelength as a quantity, the frequency formula guide is the period’s reciprocal, the amplitude guide is where the height of a wave belongs, and the surface tension guide is the force that takes over below the ladder’s lowest rung. The refraction guide is the law behind crests turning towards a shore.
On the tool side, the water wave speed calculator takes typed depths and wavelengths and runs the problem backwards as well as forwards, the standing waves calculator is the other wave relation with a boundary in it, and the wave speed lab and the transverse and longitudinal waves lab cover the two neighbouring pictures. Beyond them there is the simulation library, an index of calculators, and the blog for everything written out at length.
Frequently asked questions
Why does the simulator open on a setting where neither rule works?
Because that is the honest middle of this subject and it is the whole reason the lab exists. Ten metres of water under a 100 m wave gives a ratio of 0.1000, which is neither regime, and the panel already shows the shallow-water shortcut 6.22 per cent high. Opening on a tidy shallow case would make that shortcut look universal, which it is not.
Why are the depth and wavelength controls ladders instead of free number boxes?
Because a ladder makes every state reproducible and both boundaries exact. The depth slider picks one of 24 fixed rungs and the wavelength slider one of 25, so the lab has 600 reachable states and any reading on this page can be returned to rather than approached. It also puts the ratios 0.0500 and 0.5000 on real rungs instead of near them.
Why is the time slider counted in periods rather than in seconds?
Because one clock in seconds cannot serve these five presets. Harbour chop has a period of 2.74 s and the tsunami one of 1012.29 s, a span of more than 350 times, so a real-time animation would be a blur on one preset and motionless on another. Counting periods makes one period one wavelength of travel everywhere, and the Period card prints the seconds.
Why does the third card not move when I drag the wavelength?
Because that card is the shallow-water shortcut, which holds when the depth is a twentieth of a wavelength or less, and it has no wavelength in it at all. Hold the depth at 10 m and run the wavelength ladder from 1 m to 200 000 m: the card reads 9.90 m/s the whole way while its sub-line falls from +692.67% to +0.00%.
Is the wave height drawn in the middle band the real wave height?
No, and the band caption says so at every width it is drawn at. Linear theory carries no amplitude, so there is no wave height anywhere in this model and the drawn profile sits at a fixed pixel height instead. Read that band for its shape and for the one marked crest, and never for how tall anything is.
Does the animation prove the speed the panel prints?
No. The simulator measures nothing: it is told the depth and the wavelength and works the rest out, so a crest crossing one wavelength in one period is the definition of that speed restated as a picture rather than evidence for it. What the two ladders are genuinely for is the comparison between the full relation and its two shortcuts.
Why does the same 4 000 m of water read shallow water for one wave and deep water for another?
Because the word describes the wave and the water together and never the water on its own. A 200 km wave in 4 000 m of ocean has a ratio of 0.0200 and reads shallow water; a 100 m wave in that identical depth has a ratio of 40.0000 and reads deep water. That ratio is the only quantity the regime test looks at.
Why is every percentage on the panel positive?
Because both shortcuts are upper bounds on the true speed, always. The hyperbolic tangent in the full relation never exceeds either of the two things the limits replace it with, so no shortcut can make a wave out to be slower than it is. Across all 600 reachable states the smallest sub-line reads +0.00% and the largest +17624.54%.
References & formula source
- The model behind every figure on this page is linear surface-gravity-wave theory for one travelling wave on water of constant depth, and the relation the panel uses is the full one rather than either of its two limits. The limits are recovered from it: where the depth is a twentieth of a wavelength or less the wavelength cancels out of the arithmetic, and where it is half a wavelength or more the depth does. Both of those are approximations to the same single expression and neither is a separate law.
- Five things are this lab's STATED ASSUMPTIONS and not measurements of any ocean, and the panel prints all five in a fixed line under the drawing: the wave is of small amplitude, the depth is one constant number everywhere, gravity is the only restoring force, there is no wind, current, viscosity or Coriolis effect, and the gravitational field strength is fixed. "A tsunami travels at 711 kilometres per hour" would be a false claim about tsunamis. "With this lab's stated constant 4 000 m depth, a 200 km wave travels at 711.26 km/h" is what the simulation computed.
- The biggest limitation is the one that costs a number rather than a caveat. Linear theory carries no amplitude at all, so this model contains no wave height, no energy and no run-up, and no figure for any of them appears anywhere on this page or in the panel. A wave does rear up as it shoals, because the speed and the wavelength both fall while the energy has to go somewhere, but the direction is the whole of what is supported here and the size of it is not.
- Nothing in this lab is measured. The depth and the wavelength are given, the speed follows from the relation, the period is the wavelength divided by the speed, and the drawn surface advances by one wavelength for every period on the time slider. So a crest crossing one wavelength per period is the definition of the speed restated as a picture, and it is not evidence that the speed is right; the panel says as much in its own words under the drawing. What the two ladders are for is the opposite job: holding one quantity still, moving the other, and watching which shortcut the answer walks away from.
- The drawing promises two things and refuses a third. The surface band draws the shape of the water over exactly two wavelengths at a fixed pixel height, and the ratio axis is a logarithm of a dimensionless number; neither is a length in metres, the two are labelled separately, and no sentence on this page invites comparing a length in one with a length in the other. The caption on the surface band keeps the words saying its height is not to scale at every width at which that band is drawn at all.
- Every figure quoted on this page is a string the simulation printed. The cluster's simulation report is where those strings are recorded, and it is not a sample: it harvests all 600 reachable ladder states, the five presets at four instants each, both ends of all three sliders, the four corners of the grid, both exact boundary states and the opening state, from a real browser. The cluster's independent reference, written separately from the simulation and solving the same relation by bisection rather than in closed form, runs 5,652 checks against it with none failing.
- The two ladders are a modelling decision with consequences worth stating. Because the depth takes 24 fixed values and the wavelength 25, the lab has exactly 600 reachable states and nothing between them, so the regime census quoted on this page is a count rather than an estimate, and both boundary ratios land on real rungs instead of near them. It also means this lab cannot answer for a depth or a wavelength that is not on a rung; the companion calculator takes typed figures for that.
- Two browser engines were compared reading by reading rather than assumed to agree: the same slider positions were driven in Chrome and in Firefox at four widths and every readout compared per width, 109 values per width, every one identical, with the desktop height agreeing to the pixel. There is a hole in that and it is Safari. The WebKit build on the machine this was tested on will not start without system access it has not been given, so Safari was never exercised and nothing on this page is evidence about it.
- Where this page names something outside the panel - an ocean basin, a shelf, a dredged channel, a buoy record - the figures beside it are the lab's own readings at the stated depth and wavelength, and they are not measurements of any particular sea or event. Real water slopes, carries currents and generates its waves by wind, and none of that is in this model. Treat any figure you intend to act on as unverified until it has been checked against the water in front of you.
- Further reading: Dispersion (water waves) — Wikipedia