Watts to amps is a division by the voltage, I = P / (V × PF) on single-phase AC, with the power factor dropped on DC and an extra sqrt(3) in the denominator for balanced three-phase. This lab lets you watch that division rather than do it. Set a power, a voltage, a supply type and a power factor, and the Current drawn readout, the ammeter needle, the moving charges in the wires and a chart of the same load at four common voltages all answer together.
Watts to Amps: Current from Power and Voltage
The current a load draws is its power divided by the voltage that delivers it: I = P / V for DC, I = P / (V × PF) for single-phase AC and I = P / (sqrt(3) × V × PF) for balanced three-phase, where V is the line-to-line voltage and PF is the power factor. Change the watts, the supply voltage, the supply type and the power factor, and watch the ammeter, the charge dots in the wires and the comparison bars respond.
Load a real appliance
Each button presses one of the lab's three supply buttons, then moves the power, voltage and power-factor sliders to a real load. The line underneath is read from the running simulation after it has updated, so it can only quote the lab's own current and working.
Pick a load above, or drag the sliders yourself.
What Is the Watts to Amps Simulator?
The watts to amps simulator is a free interactive physics lab that runs in your browser — nothing to install and no sign-up. Set a load anywhere from 0 to 10000 W and a supply from 1 to 480 V, choose DC, single-phase or balanced three-phase AC, and give the load a power factor between 0.50 and 1.00. The lab prints the current with the division written out in your numbers, the apparent and reactive power the supply has to carry, and the load resistance whenever the load behaves as a plain resistor.
| Control | Range | Step |
|---|---|---|
| Load power | 0 – 10000 W | 1 |
| Supply voltage | 1 – 480 V | 1 |
| Quick voltages | 12, 120, 230, 400 V | buttons |
| Power factor | 0.50 – 1.00 (off on DC) | 0.01 |
| Supply type | DC, single-phase, three-phase | buttons |
How to use the watts to amps simulator
- Choose the supply. The three buttons under Supply type are DC, Single-phase and Three-phase, and the pressed one is the supply in force. The line beneath names the supply in full, for instance Three-phase AC (balanced), and the note under that says which voltage the lab expects: the rms value on single-phase, the line-to-line value on three-phase.
- Set the load power. Drag Load power P anywhere from 0 to 10000 W in 1 W steps; the figure beside the label reads back what you chose. At 0 W the current is exactly 0 A, the dots stand still and the needle rests on zero.
- Set the supply voltage. Drag Supply voltage V between 1 and 480 V, or press one of the quick buttons for 12, 120, 230 or 400 V. The matching button lights up when the slider sits on its value; at 240 V or 480 V none of them does.
- Set the power factor. Power factor PF runs from 0.50 to 1.00 in steps of 0.01. A load that only heats, such as a kettle element, sits at 1.00; motors and other loads whose current lags the voltage sit lower. On DC the slider is switched off and its readout says 1 (does not apply to DC).
- Read the current. Current drawn prints the answer to four significant figures, such as 4.348 A or 0.5000 A, and as a whole number from 10000 A upwards. The line under it writes the division out with your settings, I = 1000 / (230 × 1.00) = 4.348 A after Reset, and gains a sqrt(3) on three-phase.
- Read what the supply carries. Apparent power gives the volt-amperes, with the reactive power on the line beneath. Load resistance gives V / I when the load acts as a plain resistor, on DC or on single-phase at a power factor of 1.00, and n/a otherwise.
- Watch the picture, then start again. The ammeter picks its own full scale and its needle glides to the reading; the chart repeats the load at 12, 120, 230 and 400 V, with your voltage in gold. Pause freezes the dots while the readouts keep working, and Reset restores 1000 W on 230 V single-phase at 1.00.
Worked example: change one thing at a time
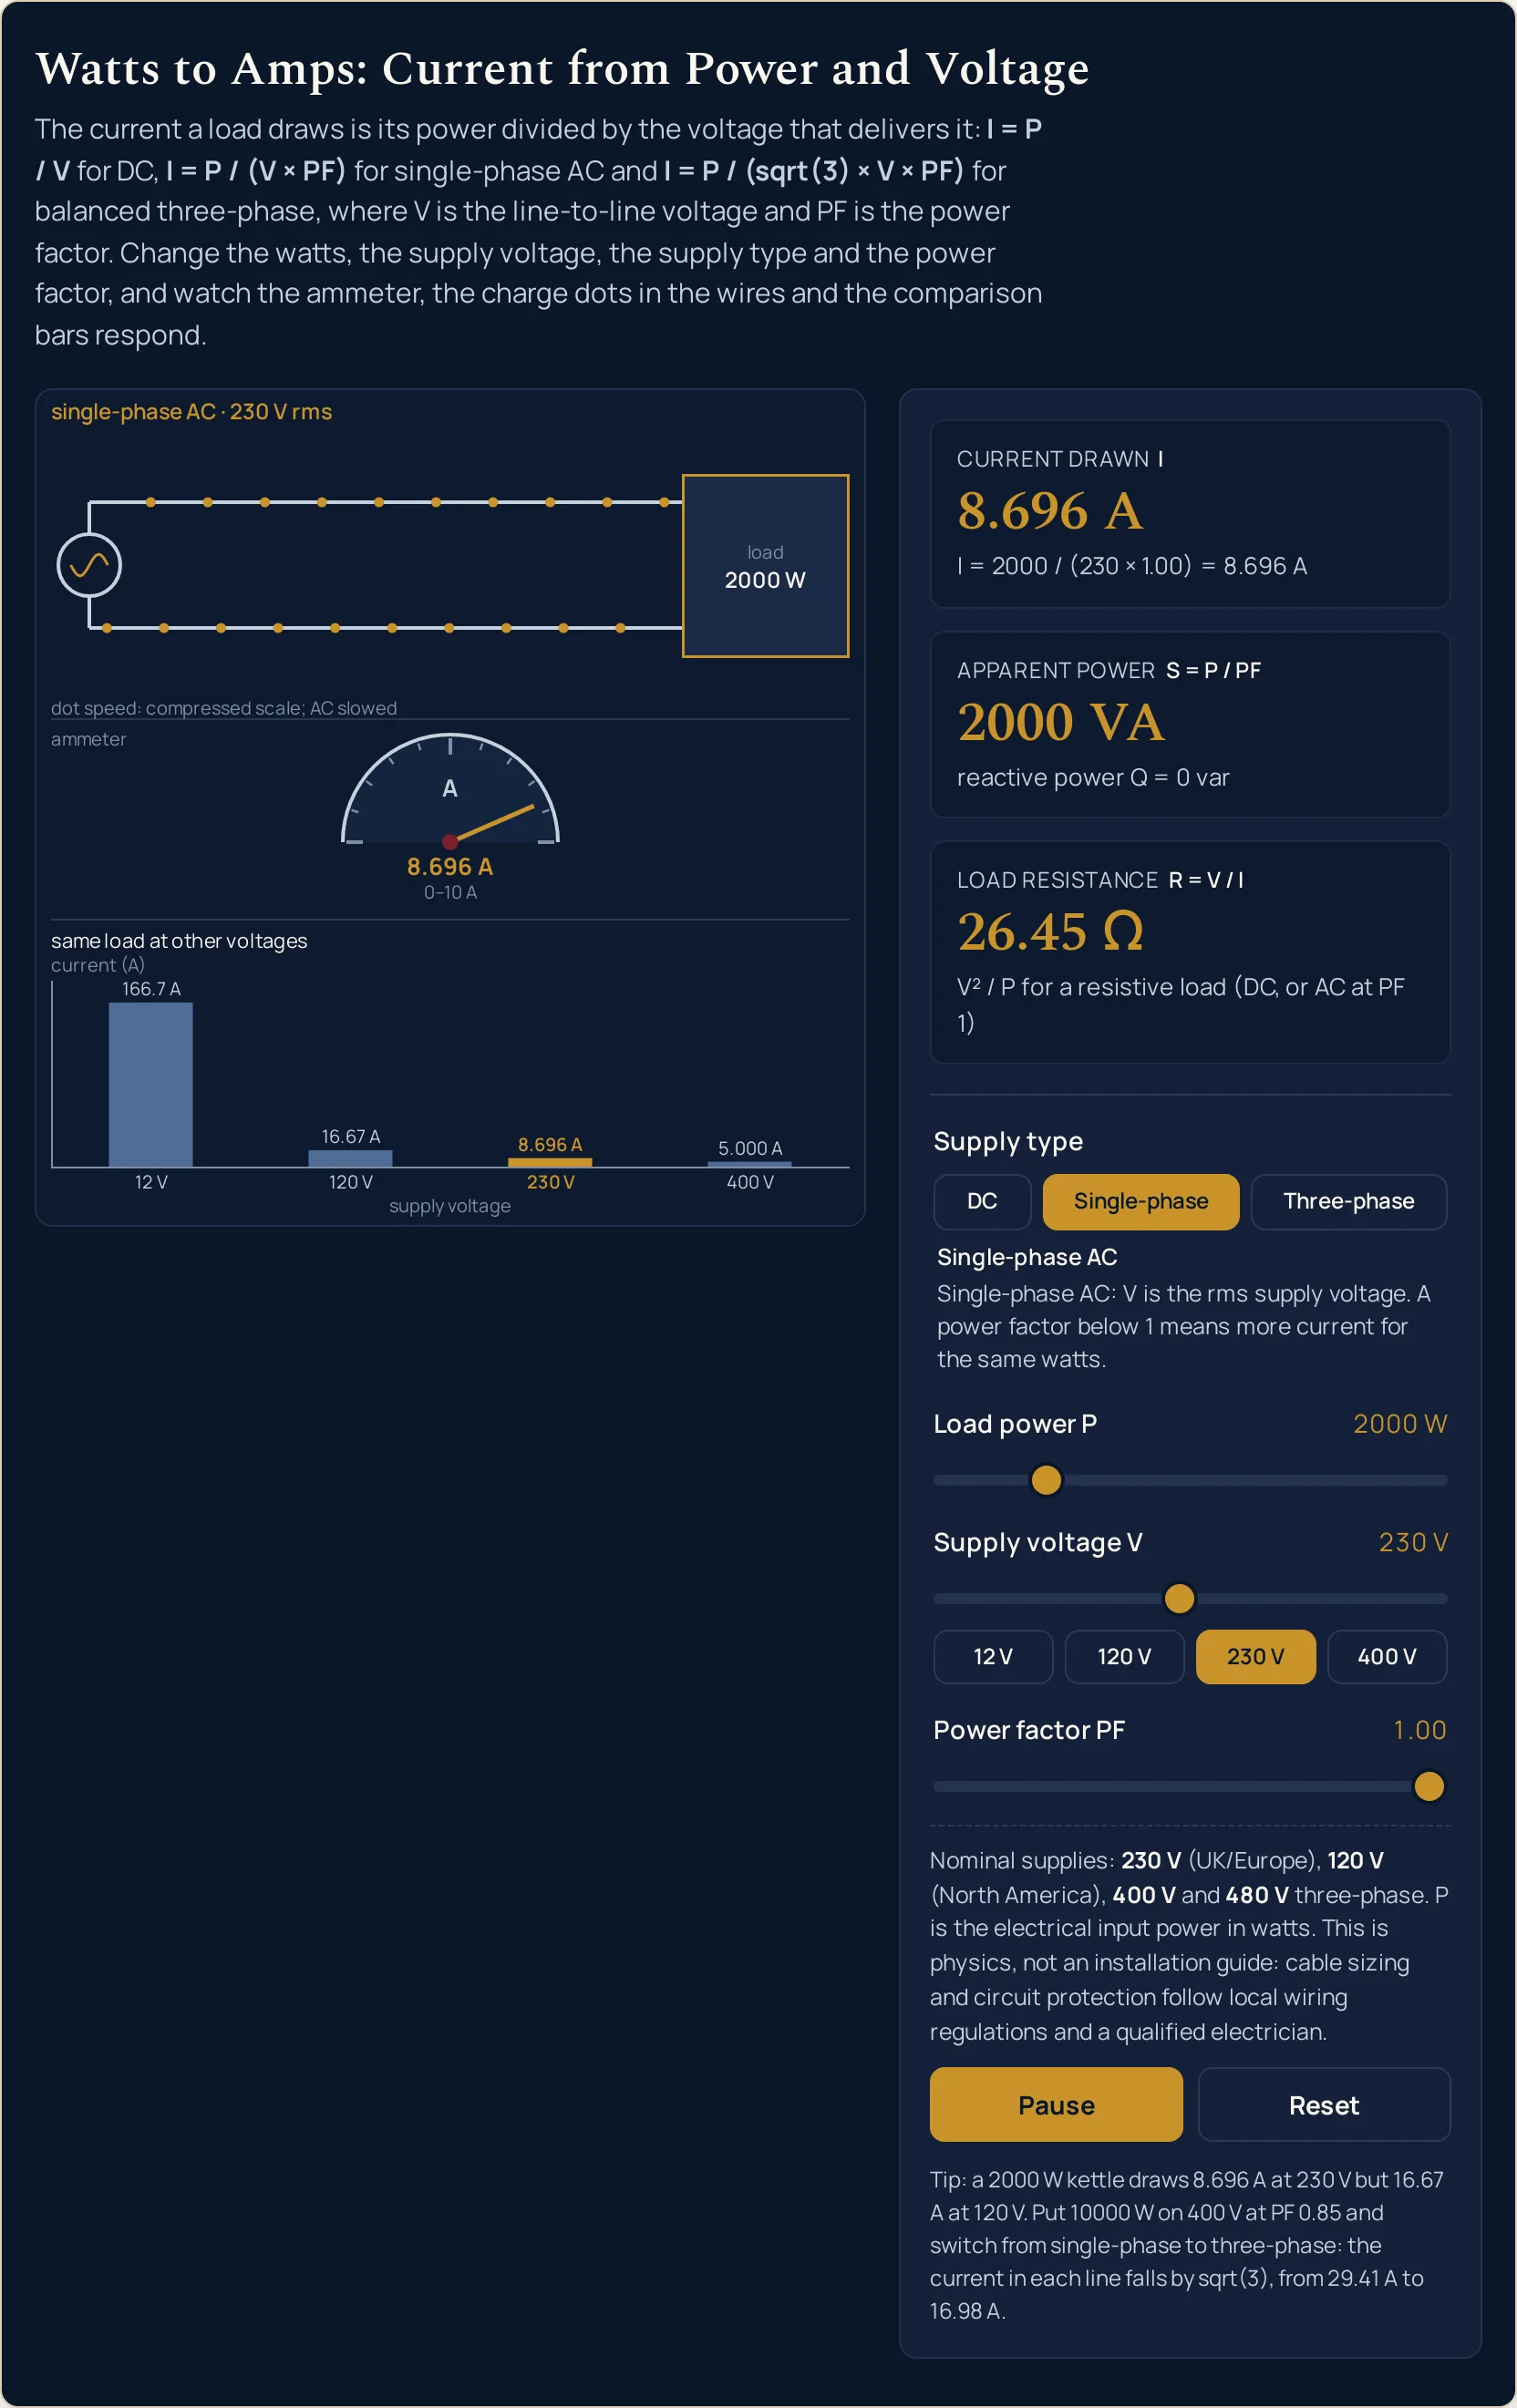
Each row starts where the one above stopped, beginning from the Kettle on 230 V preset, and differs from it by a single slider or button. Every cell is a string the running lab printed at those settings, the supply column being its own supply line, so if a cell and the screen ever disagree, trust the screen.
| Step | Supply | Load power | Supply voltage | Power factor | Current drawn | Apparent power | Load resistance |
|---|---|---|---|---|---|---|---|
| Start: the kettle preset | Single-phase AC | 2000 W | 230 V | 1.00 | 8.696 A | 2000 VA | 26.45 Ω |
| Drop the voltage to 120 V | Single-phase AC | 2000 W | 120 V | 1.00 | 16.67 A | 2000 VA | 7.200 Ω |
| Lower the power to 1500 W | Single-phase AC | 1500 W | 120 V | 1.00 | 12.50 A | 1500 VA | 9.600 Ω |
| Raise the voltage to 230 V | Single-phase AC | 1500 W | 230 V | 1.00 | 6.522 A | 1500 VA | 35.27 Ω |
| Lower the power to 1000 W | Single-phase AC | 1000 W | 230 V | 1.00 | 4.348 A | 1000 VA | 52.90 Ω |
| Raise the power to 10000 W | Single-phase AC | 10000 W | 230 V | 1.00 | 43.48 A | 10000 VA | 5.290 Ω |
| Raise the voltage to 400 V | Single-phase AC | 10000 W | 400 V | 1.00 | 25.00 A | 10000 VA | 16.00 Ω |
| Lower the power factor to 0.85 | Single-phase AC | 10000 W | 400 V | 0.85 | 29.41 A | 11765 VA | n/a (PF below 1 or three-phase) |
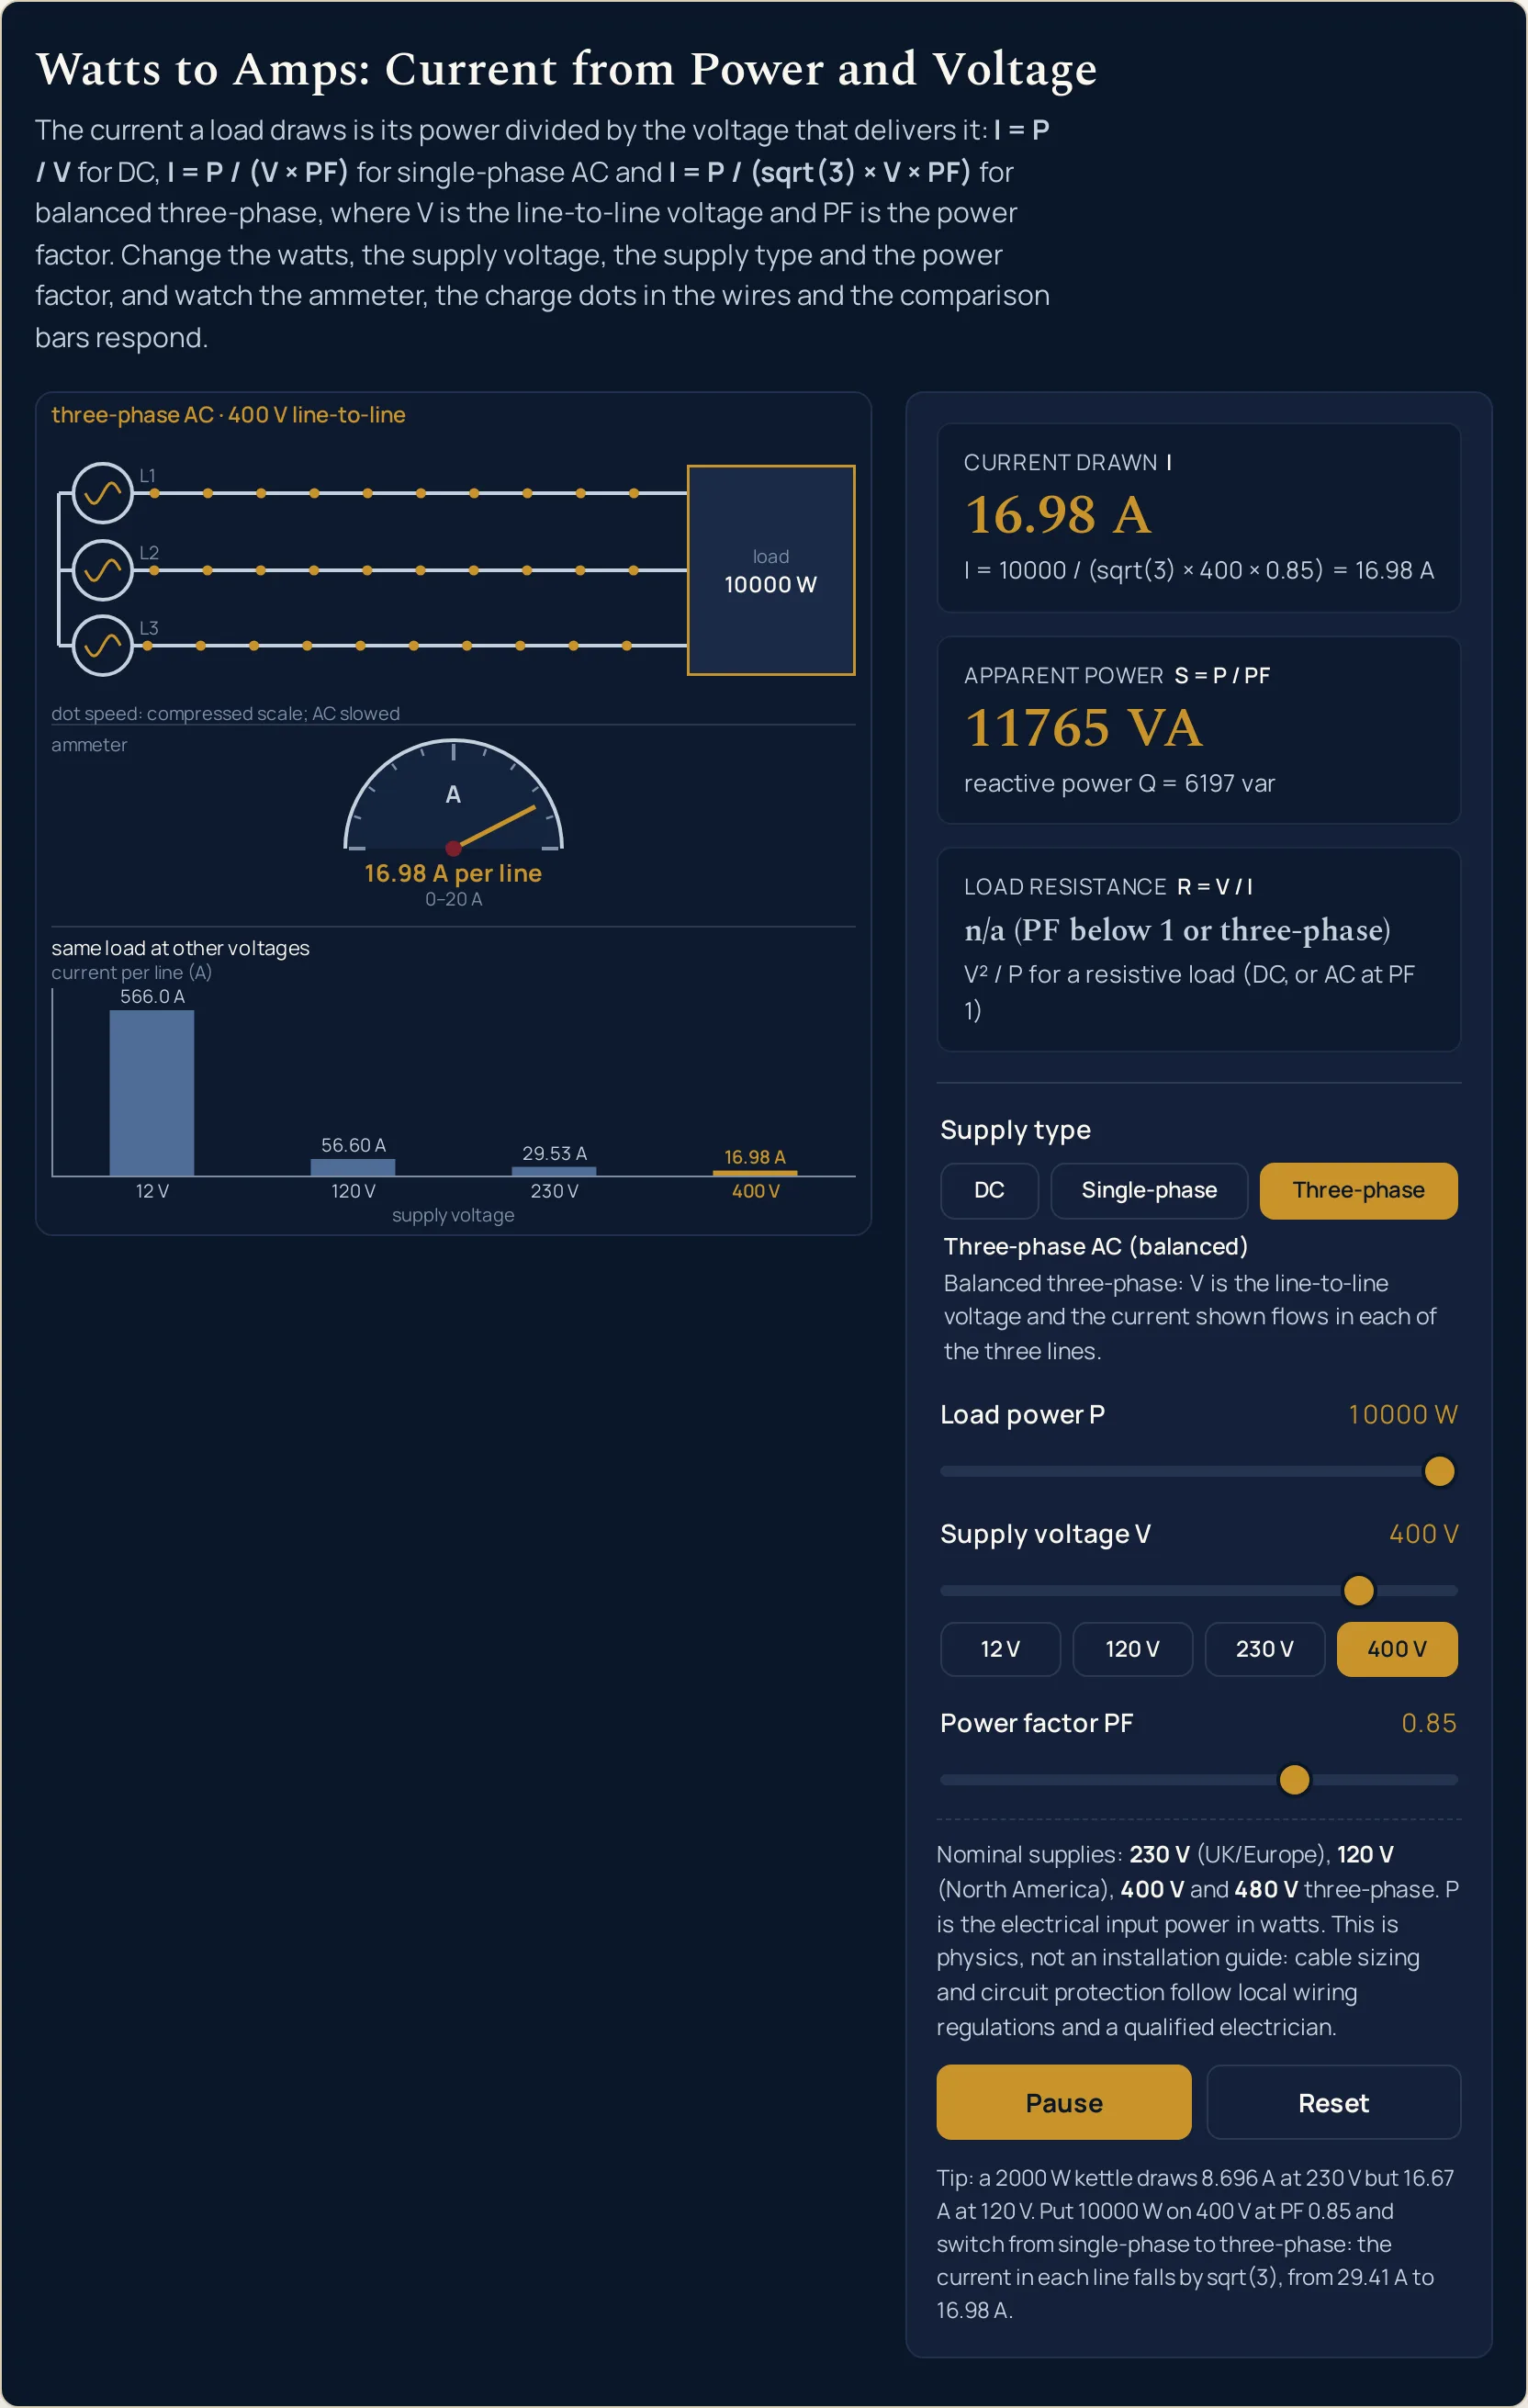
| Press Three-phase | Three-phase AC (balanced) | 10000 W | 400 V | 0.85 | 16.98 A | 11765 VA | n/a (PF below 1 or three-phase) |
| Power factor back to 1.00 | Three-phase AC (balanced) | 10000 W | 400 V | 1.00 | 14.43 A | 10000 VA | n/a (PF below 1 or three-phase) |
Rows 1 and 2 move only the voltage, and the current climbs from 8.696 A to 16.67 A while the ammeter steps up from its 0–10 A scale to 0–20 A. The bar chart confirms that nothing else changed: its four bars keep their heights and labels, and only the gold marker slides from the 230 V bar to the 120 V bar. The resistance readout does move, from 26.45 Ω to 7.200 Ω, because the slider holds the watts fixed and so describes a different element for each voltage.
Rows 3 to 5 work the power slider at two voltages. Lowering the load to 1500 W shrinks every bar in proportion and brings the current to 12.50 A; returning to 230 V gives 6.522 A for that heater, and 1000 W there reads 4.348 A, the Reset value. Throughout the first five rows the apparent power equals the watts exactly, because the power factor is still 1.00.
Rows 6 to 8 build a workshop-sized load one move at a time. Ten kilowatts on 230 V needs 43.48 A, and moving to 400 V brings that down to 25.00 A. Then the power factor drops to 0.85: the watts stay where they were, but the current rises to 29.41 A, the apparent power to 11765 VA, the reactive-power line to 6197 var, and the resistance readout switches to n/a.
Row 9 keeps every slider still and presses Three-phase. The drawing changes to three sources and three line wires, the current falls to 16.98 A and the dial label adds per line, while the apparent power holds at 11765 VA. Row 10 then returns the power factor to 1.00, which brings the line current to 14.43 A and the apparent power back to 10000 VA.
Rows 8 and 9 make a quick check on the three-phase factor. Only the supply button differs between them, so the ratio of their two currents is the three-phase factor on its own. Divide the two readouts and it agrees with sqrt(3) to the last digit the lab prints.
Formula and symbol reference
Which equation sits behind Current drawn depends on the supply button: I = P / V with DC pressed, I = P / (V × PF) with Single-phase, and I = P / (sqrt(3) × V × PF) with Three-phase. The panel's other figures follow from S = P / PF, Q = S × sqrt(1 − PF²) and R = V / I. Ranges marked “in this lab” are the simulator's own readouts at the slider ends and corner settings named.
| Symbol | Meaning | SI unit | In this lab |
|---|---|---|---|
| P | Load power: the real (active) power drawn, which for a motor means its electrical input rather than its shaft output | watt, W | 0 to 10000 W in this lab, in steps of 1 W; 1000 W after Reset. |
| V | Supply voltage: rms on single-phase, line to line on three-phase, the battery or supply voltage on DC | volt, V | 1 to 480 V in this lab, in steps of 1 V, with quick buttons at 12, 120, 230 and 400 V; 230 V after Reset. |
| PF | Power factor, the real power divided by the apparent power | none (a ratio) | 0.50 to 1.00 in this lab, in steps of 0.01; switched off on DC, where the readout says 1 (does not apply to DC). |
| I | Current drawn by the load; on three-phase, the current in each line | ampere, A | 0 A at 0 W up to 20000 A at 10000 W, 1 V and PF 0.50 in this lab; the smallest non-zero reading is 0.001203 A (1 W on 480 V three-phase). |
| S | Apparent power, P / PF: the volt-amperes the wires have to carry | volt-ampere, VA | 0 VA up to 20000 VA (10000 W at PF 0.50) in this lab; n/a (DC) on direct current. |
| Q | Reactive power, S × sqrt(1 − PF²), printed under the apparent power | volt-ampere reactive, var | 0 var at PF 1.00 up to 17321 var at 10000 W and PF 0.50 in this lab; on DC the line reads DC: no reactive power. |
| R | Load resistance, V / I, shown only for DC and for single-phase at PF 1.00 | ohm, Ω | 0.0001000 Ω (10000 W on 1 V DC) to 230400 Ω (1 W on 480 V) in this lab; no load at 0 W. |
| sqrt(3) | The three-phase factor between the line-to-line voltage and the voltage across one phase | none | Written out as sqrt(3) in the working line on three-phase rather than as a rounded decimal. |
| Full scale | The ammeter range, chosen automatically as the smallest step that holds the current | ampere, A | 0–1 A up to 0–20000 A in this lab, in 1, 2, 5 steps: 0–10 A for the kettle on 230 V, 0–20 A on 120 V. |
The physics: why the same watts need different amps
A volt measures the energy each coulomb of charge gives up in the load, so the power delivered is the voltage multiplied by the coulombs arriving every second, P = V × I. Fix the watts and the current must be whatever makes that product come out: at 230 V a 2000 W kettle needs 8.696 coulombs a second, and one built to give 2000 W on 120 V needs 16.67. That is what the charge dots are drawn to show, as busier traffic in the wires whenever the voltage falls.
The dots are a schematic, not a speedometer. Their speed follows a compressed, log-like scale so that everything from 0 to 20000 A fits on screen, and the caption under the drawing says so; real drift speeds in a copper wire are fractions of a millimetre per second, and the energy travels through the field around the conductors rather than riding on the charges.
On AC the supply must carry more volt-amperes than the load uses in watts whenever current and voltage peak at different moments; an induction motor is the everyday example. The lab keeps the two apart: the watts you set are the real power, Apparent power is the volt-amperes the wires carry, and the line beneath it is the reactive power, the share that sloshes between supply and load each cycle and delivers nothing on average. A 750 W load on 230 V draws 3.261 A at a power factor of 1.00 but 4.076 A at 0.80, with 937.5 VA and 562.5 var on the panel.
A three-phase supply has three live conductors, each carrying a sine wave shifted by 120° from its neighbours, and the lab draws them as three sources with dots swinging out of step. The slider's voltage is measured line to line; the voltage across any one phase of a star-connected load is smaller by a factor of sqrt(3), which is where the extra sqrt(3) in the working line comes from.
The chart shows what happens if the two voltages are confused. With the three-phase motor loaded, the gold 400 V bar reads 16.98 A and the 230 V bar beside it 29.53 A: the current you would get by putting the phase voltage of a 400 V system, rounded to 230 V, into the line-to-line formula.
Where the watts to amps rule breaks down
The division itself is exact. What the lab cannot know is whether the watts, the power factor and the supply you give it describe the real load, and each item below is a way they can fail to.
- The power slider holds the watts, not the element
- Moving the voltage never changes the watts, so each voltage describes a load built to draw that power there, and the resistance readout changes to prove it. A real appliance keeps its element: a 230 V kettle plugged into a 120 V socket keeps its 26.45 Ω, draws far less current than the lab shows at 120 V and delivers only a fraction of its rated power. The article works that case through with numbers.
- Symptom: an appliance that runs slowly or barely warms on a supply lower than its label.
- Rated watts are a label, not a reading
- The lab treats the power you set as exact. The figure on a rating plate is a design value: a thermostat cycles a heater on and off, and a motor's draw follows the work it is doing, so a meter on the real circuit seldom agrees with the lab to four figures.
- Motor ratings are shaft power
- What belongs on the power slider for a motor is the power it takes from the supply. The stamped rating is the work delivered at the shaft; the supply must also cover the motor's own losses, and the data sheet's efficiency says by how much. No efficiency is built into the lab, which is why its two motor presets give their watts as electrical input from the start.
- Switch-on surges
- The needle settles on the steady current within about a second, but that glide is animation, not physics. In the first instants after switch-on a motor at standstill, or a lamp filament that is still cold, takes a current well above its running value, and the panel has no way to show that surge.
- Filaments heat up
- For an incandescent lamp the resistance readout is the hot value at the rated power: 240.0 Ω for 60 W on 120 V. Measured cold with an ohmmeter, the same filament reads far lower, since tungsten conducts much better at room temperature than at white heat.
- Pulsed currents from electronics
- The power factor slider assumes a smooth sine-wave current that is merely shifted in time. Chargers, LED drivers and switch-mode supplies draw their current in short pulses instead, and their true power factor, harmonics included, sits below any figure that counts only the shift. Only the true one gives the right current here.
- Three lines, equally loaded
- Pressing Three-phase tells the lab that every line carries an identical share, which is the only reason a single per-line figure can be printed. A building with single-phase loads spread unevenly across its phases has three different line currents, and each phase has to be worked on its own with its line-to-neutral voltage.
- The lab's own limits
- Current, apparent power, reactive power and resistance print to four significant figures, with the decimals taken from the rounded value, whole numbers from 10000 upwards and a bare 0 at zero. The sliders move in steps of 1 W, 1 V and 0.01, so a power factor of 0.875 or a supply voltage of 230.9 V cannot be set exactly. The dots run on a compressed scale and the AC swing is slowed to a pace the eye can follow.
Where watts to amps is actually used
- Reading an appliance label
- Set the power slider to the watts on the label and press the quick button for your supply; the Current drawn readout is the figure the label leaves out. For a label that lists two voltages, check each with its own button, remembering that the rated watts may differ between them.
- Loading an extension lead
- Appliances sharing one lead simply add their watts, so a kettle and a toaster together are one load whose power is the sum. Put that sum on the slider and compare the current with the rating printed on the lead; the lab supplies the current, and the lead's own rating and local regulations decide the rest.
- Low-voltage battery and solar systems
- With the kettle preset loaded, the leftmost bar of the chart reads 166.7 A: the current those 2000 W would need from a 12 V battery, ten times the bar beside it at 120 V. Currents on that scale are what limit any low-voltage installation, and the chart shows them before a single wire is chosen.
- Sizing a generator or UPS
- A standby generator or UPS has a VA limit as well as a watt limit, and a motor can reach the first while well inside the second. Hold the power and move the power factor slider down to watch Apparent power climb while the watts stay put: 750 W at 0.80 is 937.5 VA.
- Three-phase workshop machines
- Load the three-phase motor preset and the dial reads 16.98 A, then press Single-phase without touching a slider: the needle jumps to 29.41 A, what one pair of wires would have to carry for the same 10000 W. Sharing a big load between three conductors in this way is much of the reason workshop machines are wired for three phases.
The simulator computes currents; it does not size cables, fuses or breakers. Those choices follow local wiring regulations and belong with a qualified electrician.
Where to go next
The derivation, and a graded set of problems solved by hand, are in the article Watts to Amps: Conversion and Formula; the relation behind the resistance readout has its own guide, Ohm's law. Once you know a load's watts, electricity cost from kWh, wattage and rate turns them into money. To type exact figures instead of dragging sliders, open the watts to amps calculator; to see a single resistor respond, try the Ohm's law simulator, or browse the whole library of physics simulations.
Frequently asked questions
What does the watts to amps simulator show?
It shows the current a load draws once you fix its power, the supply voltage, the kind of supply and the power factor. The Current drawn readout gives the answer in amps with the division written out beneath it, while an ammeter needle, charges moving in the supply wires and a bar chart of the same load at 12, 120, 230 and 400 V show the same result as a picture.
Why is the power factor slider greyed out on DC?
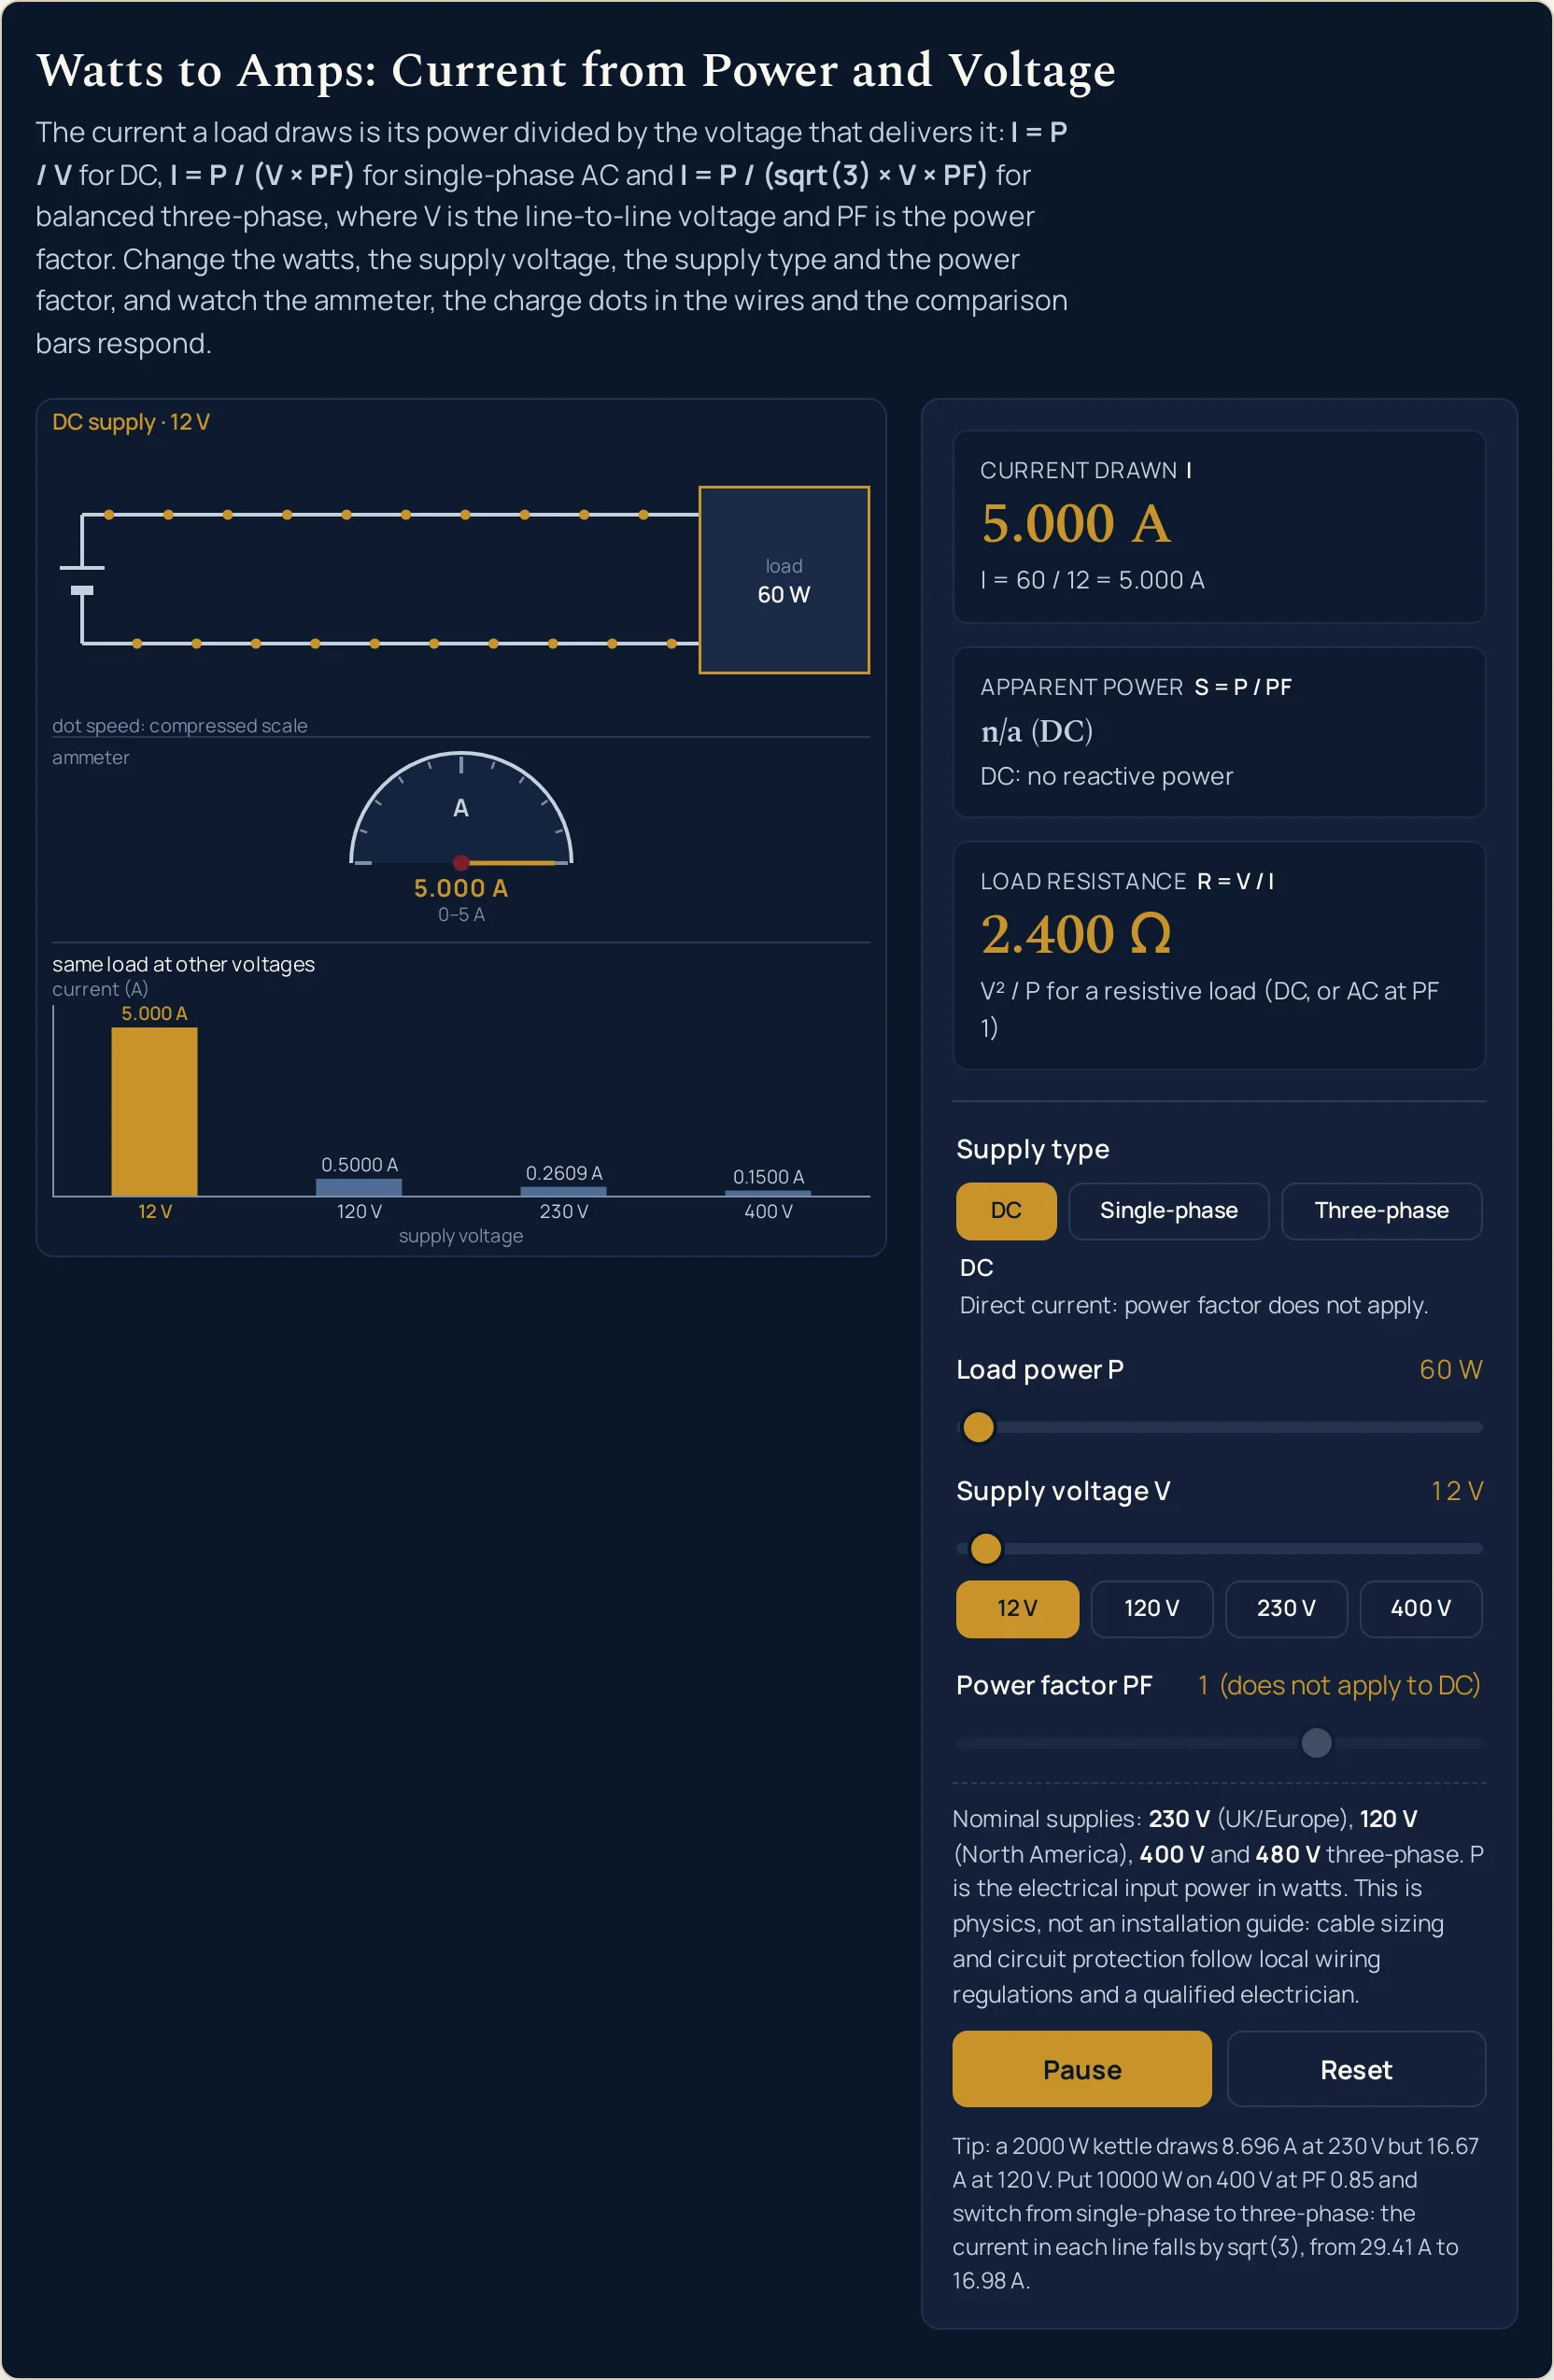
Because a steady direct current has no phase shift for a power factor to describe, so the lab switches the slider off and its readout says 1 (does not apply to DC). The slider keeps its position, though. Leave it at 0.50 with 60 W on 12 V and the current reads 5.000 A on DC, then 10.00 A the moment you press Single-phase.
Why do the bars stay put when I move the voltage slider?
Because the chart always draws the same load, at the same power, power factor and supply type, on four fixed voltages, so moving the voltage only moves the gold bar that marks where you are. With 2000 W on single-phase the bars read 166.7, 16.67, 8.696 and 5.000 A whether the slider sits on 230 V or 120 V. Change the power, the power factor or the supply and every bar rescales.
Why does three-phase show less current than single-phase for the same watts?
Because the three-phase figure is the current in each of three lines, and its formula carries an extra sqrt(3) in the denominator. Put 10000 W on 400 V at a power factor of 0.85: single-phase reads 29.41 A, three-phase 16.98 A per line, and the apparent power stays at 11765 VA in both cases. The load has not changed; it is simply fed through three conductors instead of one pair.
Do the charges in a real wire move as fast as the dots?
No. The dots run on a compressed scale, so 20000 A moves them only about three times faster than 1 A, and the AC swing is slowed to about once a second so the eye can follow it. Real drift speeds in a wire are fractions of a millimetre per second; the energy reaches the load through the electric field, not by the charges racing along.
Why does the ammeter keep changing its scale?
Because the dial picks the smallest full scale that holds the current, stepping through 1, 2, 5, 10, 20, 50 and so on up to 20000 A, so the needle always swings across a useful part of the dial. The kettle on 230 V reads on 0–10 A; drop to 120 V and the dial becomes 0–20 A. A current exactly on a step, like the headlamp at 5.000 A, sits at full scale.
Why does the load resistance readout say n/a?
Because one resistance only describes the load when voltage and current rise and fall together, which the lab takes to mean DC, or single-phase at a power factor of 1.00. Below that, or on three-phase, it prints n/a (PF below 1 or three-phase); at 0 W it prints no load, since nothing flows. Otherwise it gives V / I to four significant figures, 26.45 Ω for the kettle.
What is the largest current the lab can show?
20000 A, with the power at its 10000 W maximum, the voltage at its 1 V minimum, a power factor of 0.50 and single-phase selected. The ammeter re-ranges to 0–20000 A and the gold 1 V bar becomes the first and tallest in the chart. Treat it as the corner of the slider ranges, useful for watching the auto-ranging, rather than as a load you are likely to meet.
References & formula source
- Halliday, Resnick and Walker, Fundamentals of Physics: the chapter on current and resistance (power in electric circuits) and the chapter on alternating-current circuits (power factor).
- Young and Freedman, University Physics: the chapters Current, Resistance and Electromotive Force, and Alternating Current.
- BIPM, The International System of Units (SI), 9th edition: the definitions of the ampere, the volt and the watt.
- Further reading: Electric power — Wikipedia