A head drop of 1.00 m across a metre of sand, in a column 0.300 m across, and four cards answer at once. This Darcy's law simulator is a free interactive lab that draws Henry Darcy's 1856 constant-head permeameter from the side and prints what five slider positions imply: a Darcy flux of 0.001000 m/s, a seepage velocity of 0.003333 m/s, a discharge of 7.069e-5 m3/s and the verdict Darcian.
The first two of those are the reason to open it. They have the same units and they are not two estimates of one thing, and the gap between them is the single most expensive mistake in groundwater arithmetic. One more thing before you start: this law has nothing to do with the Darcy friction factor, which is pressure loss along a pipe wall and belongs to the friction factor calculator — same surname, unrelated physics.
Darcy's Law Lab
Henry Darcy's 1856 constant-head permeameter: water held at one level on the left drains at a lower level on the right, and that head drop dh pushes it through a sand column, giving Q = K A i with the gradient i = dh / L. The law is written with a minus sign because flow runs down the gradient; this lab works in magnitudes and takes the head drop as positive, so no readout carries that sign. Watch the two arrows: the Darcy flux q is in m/s but is not the speed of anything, because the water only has the pores to move through.
Load a real sand column
Each button writes all five sliders at once and lets the simulation recompute everything, so every number you then see is the lab's own. The line underneath quotes the panel back to you after it has settled, which means nothing in it is stored text.
Treat the five conductivities below as examples, picked so that pressing the buttons in turn walks you across the whole slider. None of them was surveyed anywhere. Put a material name to a number and you are already guessing: the honest figure behind a word like sand or gravel is a band many decades wide, and only a test on the sample in front of you narrows it.
Pick a column above, or drag the five sliders yourself.
What Is the Darcy's Law Simulator?
The Darcy's law simulator is a free interactive physics lab that runs in your browser, with nothing to install and no sign-up. It draws Henry Darcy's 1856 constant-head permeameter from the side: a tall reservoir on the left, a lower outlet on the right, and a horizontal sand column between them with a grain stipple. The head drop between the two water surfaces is marked with a dimension line, and the law comes out of it as Q = K A i with the gradient i = dh / L.
Five sliders drive it. Hydraulic conductivity K is logarithmic and spans 1e-9 to 1 m/s in quarter-decades, because ten orders of magnitude is the real spread of the quantity and a linear control would make most of it unreachable. Head drop dh runs 0.05 m to 5.00 m, Path length L 0.10 m to 20.00 m, Column diameter d 0.050 m to 0.600 m and Effective porosity n 0.050 to 0.500.
Four cards carry the answer, each with its own relation printed beside the label. Darcy flux is q = K i, Seepage velocity is v = q / n, Discharge is Q = K A i, and Flow regime is a word with the validity check under it. On the opening sand column those read 0.001000 m/s, 0.003333 m/s, 7.069e-5 m3/s and Darcian.
The first two cards are the whole point of the lab, and they are not two estimates of one thing. The flux is volume per second per unit area of the whole face, grains included, so nothing travels at it. The water has only the pores to move through, which is n of that face, so it moves 1/n times faster. At the opening porosity the stats grid prints that factor as 3.3333 and the sentence strip says it in words: At n = 0.300 the water travels 3.3333 times faster than the flux q.
Two arrows inside the drawn column carry the same fact as a picture. They share one scale: the long one is the seepage velocity, the short one is the Darcy flux, and the short one is drawn at exactly the porosity times the long one's length. Tracer dots run along both on a single shared phase, so a dot crosses the flux arrow in the time a dot crosses the velocity arrow and its on-screen speed is n times the other's. The arrows are a ratio and never a speed, which the caption in the drawing states outright.
A compact grid carries six more readings: the hydraulic gradient, the area, the pore speed factor, the intrinsic permeability k, in m2, the discharge per day, and the grain-size Reynolds number. On the opening column they read 1.000, 0.07069 m2, 3.3333, 1.023e-10 m2, 6.107 m3/day and 0.4981, for the stated d30 = 0.50 mm.
Capital K and lower-case k are different quantities and the lab never lets them share a letter. Capital K is the hydraulic conductivity in m/s and belongs to the medium and the fluid together; lower-case k is the intrinsic permeability in m2 and belongs to the medium alone, which is why it does not move when the water warms. For water the two differ by rho g / mu = 9.773e+6.
The regime word is a validity check, and it is conditional on purpose. A grain-size Reynolds number needs a grain size, and there is no honest way to recover one from a conductivity, so the lab states one - d30 = 0.50 mm, medium sand - and every verdict it prints ends on that qualifier. Darcian runs below Re 1, Transition from 1 to 10 inclusive, and Beyond Darcy above 10, reached at a flux of 0.002008 m/s and 0.02008 m/s respectively.
This is not the Darcy friction factor, which is pressure loss along a pipe wall and a different quantity, with a grouping behind it built on a pipe diameter rather than on a grain size. Nothing in this lab is about pipes: it is creeping flow through a porous medium, and the ceiling here is a grain-size figure of about 1 to 10 rather than anything to do with a pipe diameter.
Five preset buttons on the landing page write all five sliders at once. A sand column at a gradient of one, a clay liner eight decades slower, a gravel aquifer at a gentle one in twenty, a transition-band state and a past-the-limit state. Those conductivities are illustrative values chosen to span the measured range of each material class, not measurements of any named site: real conductivity varies by orders of magnitude inside one material name and has to be measured rather than looked up.
The last preset is the one to read carefully. It reaches Re = 199.2, for the stated d30 = 0.50 mm, where the linear law no longer holds, so its 0.02827 m3/s is what the law predicts and not a flow that would occur - the real discharge is lower, because the inertial losses the linear law leaves out grow with the flux. The panel says so in words, the drawing marks the band as a prediction, and the two arrows are drawn dashed.
What the lab leaves out, stated as omissions rather than as assumptions that happen to hold. One conductivity describes an idealised uniform block, where a real formation is layered and runs far more freely sideways than downwards. The porosity wanted is the connected fraction that carries flow, not the total porosity, which is larger and would make the pore velocity too small. The head drop is taken as a positive magnitude, so the minus sign of the differential form never reaches a readout.
Nothing on this page is a measurement. Every digit and every pixel is arithmetic on five slider positions, so the lab shows the shape of one relation rather than an observation of any column; the head drop is drawn to a fixed scale while the column length and thickness are drawn within pixel limits, and anything pushed to a limit is labelled not to scale in the drawing itself. Verify any figure against your own source before you use it for anything that matters.
| Control | Range | Step, default and what it moves |
|---|---|---|
| Hydraulic conductivity K | 1e-9 to 1 m/s | a LOGARITHMIC slider in quarter-decade steps of 0.25 in the exponent, opening on 1.000e-3 m/s, which is where the sand column sits. Ten orders of magnitude is the real spread of this quantity, so a linear control would put most of it out of reach. The value is rounded to the four significant figures the label prints BEFORE any reading is computed, so the printed setting is exactly the number behind every readout. This is the capital K of the law, in m/s; the lower-case k in the stats grid is the intrinsic permeability in m2, and the two differ by rho g / mu = 9.773e+6 for water |
| Head drop dh | 0.05 to 5.00 m | steps of 0.05 m, opening on 1.00 m, where the label reads "1.00 m". This is the drop between the two water surfaces, entered as a positive magnitude: the minus sign in the differential form only says flow runs down the gradient, so it never reaches a readout. It is the numerator of the gradient, so the discharge is exactly proportional to it - 0.05 m gives 3.534e-6 m3/s and 1.60 m gives 1.131e-4 m3/s at the sand setting. It is also the one dimension drawn to a FIXED scale, with 5.00 m filling the head space |
| Path length L | 0.10 to 20.00 m | steps of 0.10 m, opening on 1.00 m. This is the distance the head drop is spread over, so it is the denominator of the gradient and the discharge falls as it grows. Together the two lengths reach a gradient of 0.002500 at the smallest and 50.00 at the largest. The drawn column length follows it within pixel limits, and when it is pushed to a limit the drawing labels it "not to scale" rather than quietly lying about the proportion |
| Column diameter d | 0.05 to 0.60 m | steps of 0.01 m, opening on 0.300 m, where the area cell reads "0.07069 m2". The area is computed from it as a circle, so it runs from 0.001963 m2 to 0.2827 m2 and the discharge follows the SQUARE of the diameter. The Darcy flux does not move with it at all, because the flux is already per unit area. The drawn thickness of the column follows the diameter within pixel limits and is labelled "not to scale" at a limit |
| Effective porosity n | 0.05 to 0.50 | steps of 0.01, opening on 0.300, where the pore speed factor reads "3.3333". The discharge and the flux do not depend on it at all: it only sets how much faster the water in the pores is going than the flux suggests. At the sand setting the seepage velocity runs from 0.02000 m/s at n = 0.050 to 0.002000 m/s at n = 0.500 while the flux holds at 0.001000 m/s throughout. It wants the CONNECTED fraction that carries flow, not the total porosity |
| Pause flow and Reset | two buttons | the first toggles between "Pause flow" and "Play flow" and freezes the tracer dots where they are, which is useful for comparing the two arrow lengths without the motion; it changes no reading. The second is labelled "Reset" and restores all five sliders to the sand column at a gradient of one. There is no run control and no play speed: the lab reports a steady state, so there is no transient to run |
How to use the Darcy's law simulator
- Read the four cards before you touch anything. They are already answering for a sand column at a gradient of one: Darcy flux
0.001000 m/s, Seepage velocity0.003333 m/s, Discharge7.069e-5 m3/sand Flow regimeDarcian. Each of the first three carries its own relation beside the label. - Compare the first two cards, and then the two arrows that draw them. The upper arrow in the column is the pore velocity and the lower one is the flux, on one shared scale, with the lower drawn at exactly the porosity times the upper. The sentence strip under the drawing puts it in words:
At n = 0.300 the water travels 3.3333 times faster than the flux q. - Drag Hydraulic conductivity K and watch ten decades go by. The slider is logarithmic, in quarter-decade steps, and its label reads
1.000e-3 m/sat the sand setting and1.000e-9 m/sat the clay end. Everything on the panel scales with it except the gradient, the area and the pore speed factor. - Drag Head drop dh and watch the dimension line, not just the numbers. That line between the two water surfaces is drawn on a fixed scale with
5.00 mfilling the head space, so a small drop really is drawn small. At0.05 mit reaches a pixel floor and the label becomesdh = 0.05 m (not to scale). - Drag Path length L to spread the same drop further. The drawn column stretches and its label follows,
L = 20.00 mat the far end, while the gradient cell falls and the discharge falls with it. The two length sliders together reach a gradient of0.002500at one extreme and50.00at the other. - Drag Column diameter d for the one change that moves the discharge without moving the flux. The area cell follows the square of it, from
0.001963 m2to0.2827 m2, and the first card does not budge, because a flux is already per unit area. - Drag Effective porosity n and watch exactly two readings respond. The discharge card and the flux card hold still; the seepage velocity and the pore speed factor move, from
0.02000 m/sand20.0000atn = 0.050down to0.002000 m/sand2.0000atn = 0.500. - Read the fourth card with its sub-line, never the word on its own. It gives a verdict and the grain-size Reynolds number behind it —
Re = 0.4981, for the stated d30 = 0.50 mmon the sand column. That clause is the whole honesty of the reading: the grain size is stated by the lab, not derived from your conductivity. - Press Pause flow when the tracer dots get in the way. It freezes them where they are and relabels itself
Play flow, and not one reading changes. Comparing two arrow lengths is easier once they have stopped, and the dots are worth watching first: a flux dot moves at exactly the porosity times a velocity dot's on-screen speed. - Press Reset when you have finished. It restores all five sliders to the sand column at a gradient of one, which is the state every figure on this page is measured against.
Dragging is the right way to find out which readings move together and a poor way to land on a particular column, because the conductivity slider alone has 37 positions. The five preset buttons above exist for that reason, and the Darcy's law guide is where the subject itself is argued from scratch, with the 1856 experiment set out and the problems worked step by step.
One thing this panel cannot do is take an area directly. It is a permeameter, so its face is always the circle of the diameter slider and it tops out at 0.2827 m2 — nowhere near an aquifer cross-section. The Darcy's law calculator takes the area as a typed number with its own unit menu, and it also runs the relation backwards, which is what a permeameter test actually needs.
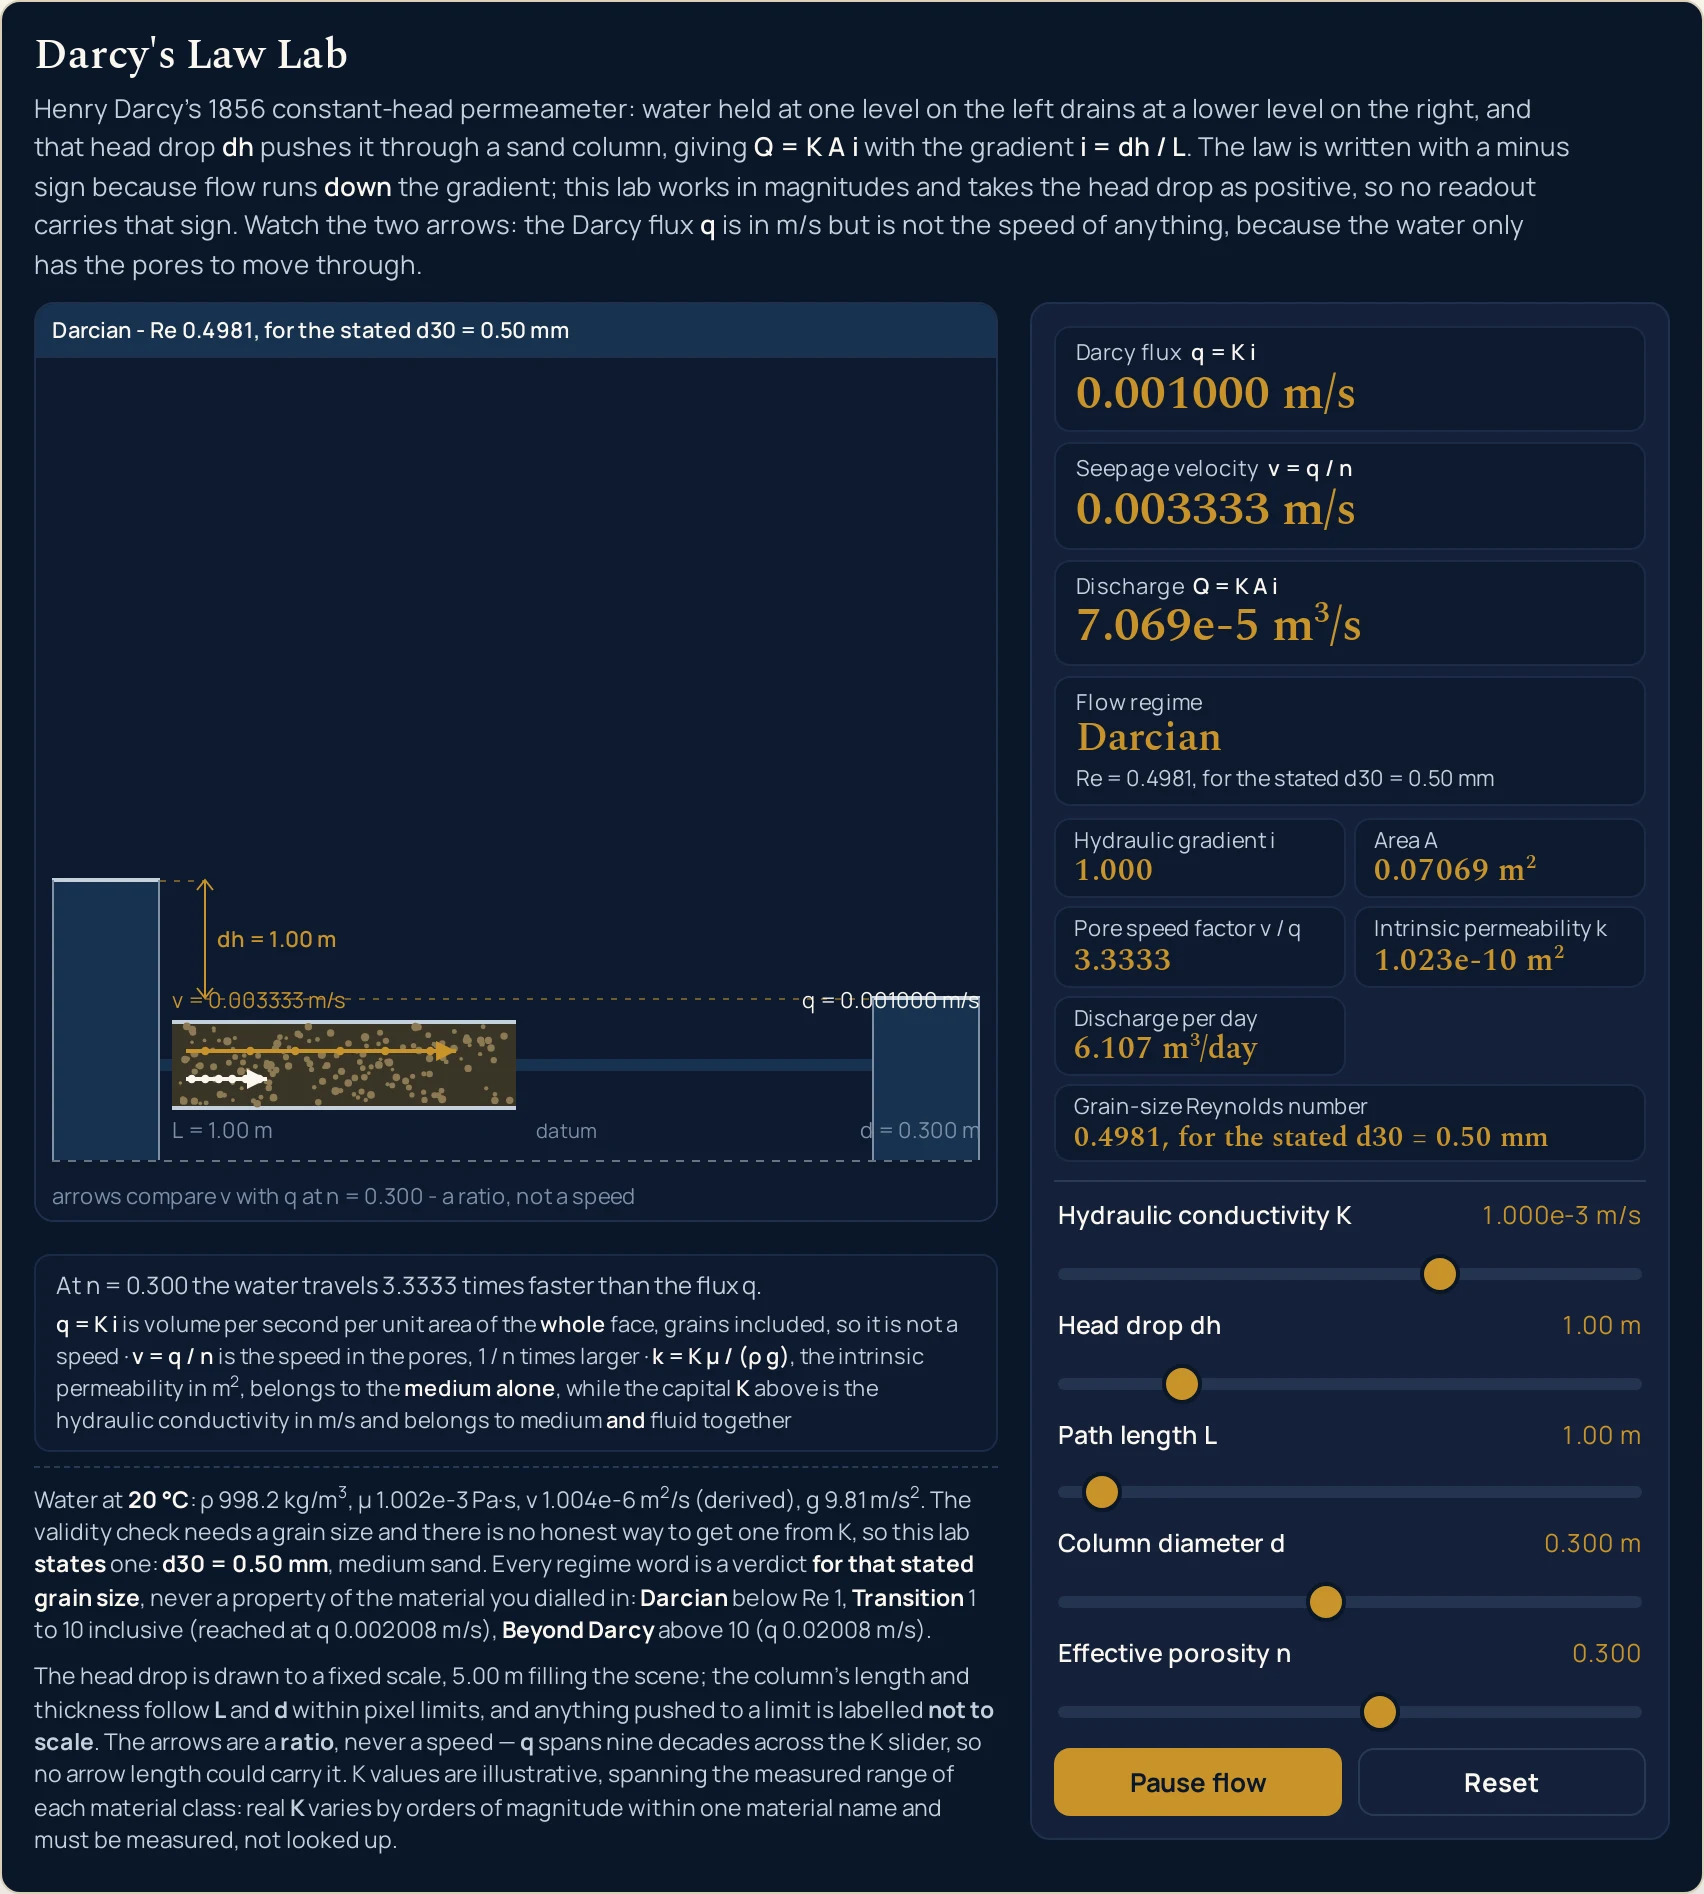
1.000 and the whole argument of the lab in two arrows. The flux card reads 0.001000 m/s and the pore velocity card 0.003333 m/s, which is the pore speed factor of 3.3333 drawn as two lengths on one scale. The band text here is what the drawing paints at this page's width; on a narrow column it is dropped rather than shortened.Worked example: change one thing at a time
Nothing in the three tables below was worked out here. Each row is a state the lab was put into through its own sliders and then read back from, cell by cell, so every string in them is the panel's own. The first table moves the head drop and holds the other four sliders still.
One: the gradient, with the column left alone
The sand column throughout — conductivity 1.000e-3 m/s, diameter 0.300 m, porosity 0.300 — with the path length at 1.00 m so the gradient is numerically the head drop. Read the fourth column down before anything else.
| Head drop | Hydraulic gradient | Darcy flux | Discharge | Discharge per day | Grain-size verdict |
|---|---|---|---|---|---|
| 0.05 m | 0.05000 | 5.000e-5 m/s | 3.534e-6 m3/s | 0.3054 m3/day | Darcian at 0.02491, for the stated d30 = 0.50 mm |
| 0.10 m | 0.1000 | 1.000e-4 m/s | 7.069e-6 m3/s | 0.6107 m3/day | Darcian at 0.04981, for the stated d30 = 0.50 mm |
| 0.20 m | 0.2000 | 2.000e-4 m/s | 1.414e-5 m3/s | 1.221 m3/day | Darcian at 0.09962, for the stated d30 = 0.50 mm |
| 0.40 m | 0.4000 | 4.000e-4 m/s | 2.827e-5 m3/s | 2.443 m3/day | Darcian at 0.1992, for the stated d30 = 0.50 mm |
| 0.80 m | 0.8000 | 8.000e-4 m/s | 5.655e-5 m3/s | 4.886 m3/day | Darcian at 0.3985, for the stated d30 = 0.50 mm |
| 1.60 m | 1.600 | 0.001600 m/s | 1.131e-4 m3/s | 9.772 m3/day | Darcian at 0.7970, for the stated d30 = 0.50 mm |
Every rung doubles the one above it, and that is the whole claim of the law. Double the gradient and the discharge doubles; there is no threshold, no curvature and no onset anywhere in the six rows. The flux column tracks it in lockstep, because neither the area nor the conductivity ever moved.
Read the printed figures as printed figures, though, not as arithmetic you can redo in your head. Each cell is rounded to four significant figures on its own, so the first rung's 3.534e-6 doubled by hand gives 7.068e-6 while the second rung prints 7.069e-6. Both are correct roundings of the same exact doubling, and the gap is the rounding, not the physics.
The last column is why the table stays honest. All six rows are comfortably below the ceiling, so the lab keeps saying Darcian, and each verdict carries the grain size the lab stated rather than one it inferred from the conductivity. Push the gradient far enough and that column is the first thing to change. This table is also where the discharge per day comes from if you want the answer in the units a water supply gets argued about in — the flow rate guide is where volume per unit time is set out as a quantity in its own right.
Two: the porosity, with the discharge pinned
The same sand column again, with only the fifth slider moving. The two middle columns are the same string three times over, and they are the point of the table.
| Effective porosity | Darcy flux | Discharge | Seepage velocity | Pore speed factor | Sentence strip under the drawing |
|---|---|---|---|---|---|
| 0.050 | 0.001000 m/s | 7.069e-5 m3/s | 0.02000 m/s | 20.0000 | At n = 0.050 the water travels 20.0000 times faster than the flux q. |
| 0.300 | 0.001000 m/s | 7.069e-5 m3/s | 0.003333 m/s | 3.3333 | At n = 0.300 the water travels 3.3333 times faster than the flux q. |
| 0.500 | 0.001000 m/s | 7.069e-5 m3/s | 0.002000 m/s | 2.0000 | At n = 0.500 the water travels 2.0000 times faster than the flux q. |
A factor of ten in porosity makes a factor of ten in the speed of the water and no difference at all to the flow. The discharge is 7.069e-5 m3/s in all three rows and the flux is 0.001000 m/s in all three. Only the fourth and fifth columns respond, and the lower arrow in the drawing shortens with them.
That is worth sitting with, because it is counter-intuitive in the useful direction: tighter pores mean faster water for the same flow. The same volume per second has less open area to get through, so it has to move more quickly through what there is.
Three: the five presets
The five preset buttons at the values they write, with the slider labels the panel prints beside them. The conductivity column spans a factor of 1e7 from the clay liner to the gravel aquifer, which is the whole reason that slider is logarithmic.
| Preset | Conductivity | Head drop | Path length | Porosity | Gradient | Darcy flux | Seepage velocity | Discharge | Regime |
|---|---|---|---|---|---|---|---|---|---|
| Sand column | 1.000e-3 m/s | 1.00 m | 1.00 m | 0.300 | 1.000 | 0.001000 m/s | 0.003333 m/s | 7.069e-5 m3/s | Darcian |
| Clay liner | 1.000e-9 m/s | 1.00 m | 1.00 m | 0.450 | 1.000 | 1.000e-9 m/s | 2.222e-9 m/s | 7.069e-11 m3/s | Darcian |
| Gravel aquifer | 1.000e-2 m/s | 1.00 m | 20.00 m | 0.250 | 0.05000 | 5.000e-4 m/s | 0.002000 m/s | 3.534e-5 m3/s | Darcian |
| Transition band | 1.000e-1 m/s | 0.50 m | 10.00 m | 0.300 | 0.05000 | 0.005000 m/s | 0.01667 m/s | 3.534e-4 m3/s | Transition |
| Past the Darcy limit | 1.000e-1 m/s | 2.00 m | 0.50 m | 0.300 | 4.000 | 0.4000 m/s | 1.333 m/s | 0.02827 m3/s | Beyond Darcy |
The diameter is 0.300 m in every one of these rows, so the area is 0.07069 m2 throughout and the presets differ only in the conductivity and the two lengths. That is deliberate: this is one apparatus with five materials in it, not five different pieces of equipment. The per-day figures that follow — 6.107, 6.107e-6, 3.054, 30.54 and 2443 m3/day — are therefore all flows through that one 0.300 m face.
Rows four and five are the ones that change the last column, and they change it for different reasons. The transition row reaches Re = 2.491, for the stated d30 = 0.50 mm; the past-limit row reaches Re = 199.2, for the stated d30 = 0.50 mm. At the second of those the law has stopped applying, so its 0.02827 m3/s is a prediction and the panel prints the warning ahead of the number.
Formula and symbol reference
The band at the head of this page carries the law and the pore velocity together rather than the discharge alone, because the discharge on its own cannot show the thing this lab exists to show. Every reading on the panel is one of those two, a factor inside one of them, or a check on whether either still applies.
The symbol column below uses the panel's own names. Read the two rows for K and k together before anything else: they are different quantities in different units, and for water they differ by a factor of 9.773e+6. The “in this lab” column gives each slider's own end stops with the labels the panel printed at those positions.
| Symbol | Meaning | Unit | In this lab |
|---|---|---|---|
| Q | Volumetric flow rate through the column — the discharge, and the quantity the law is written for | m3/s | the third card, Q = K A i. At the all-minimum corner of the five sliders it reads 9.817e-13 m3/s and at the all-maximum corner 0.07069 m3/s. Across the five presets it runs from 7.069e-11 to 0.02827 m3/s. |
| K | Hydraulic conductivity: how freely this medium passes this fluid. A property of the two together, which is why warm water gives a larger value through the same sand | m/s | the first slider, logarithmic, 1.000e-9 m/s to 1.000e+0 m/s in quarter-decade steps, opening on 1.000e-3 m/s. The value is rounded to those four figures before any reading is computed, so the printed setting is exactly the number behind every card. |
| A | Cross-sectional area of the face the water crosses — grains and pores together, never the open pore area alone | m2 | a grid cell, not a control: this is a permeameter, so the area is the circle of the diameter slider. It runs from 0.001963 m2 to 0.2827 m2 and sits at 0.07069 m2 on all five presets. |
| d | Column diameter. The area follows its square, so this is the one control that moves the discharge without moving the flux | m | the fourth slider, 0.050 m to 0.600 m in steps of 0.01, opening on 0.300 m. The drawn thickness of the column follows it within pixel limits and is labelled (not to scale) at a limit. |
| dh | Head drop across the sample, taken as a positive magnitude. The minus sign of the differential form only says that flow runs down the gradient, so it never reaches a reading here | m | the second slider, 0.05 m to 5.00 m in steps of 0.05, opening on 1.00 m. It is the one dimension drawn on a fixed scale, with 5.00 m filling the head space, so its dimension line is genuinely proportional. |
| L | Flow path length — the distance the head drop is spread over, and the denominator of the gradient | m | the third slider, 0.10 m to 20.00 m in steps of 0.10, opening on 1.00 m. The drawn column length follows it inside pixel limits, with the same (not to scale) label at a limit. |
| i | Hydraulic gradient, the head drop divided by the path length. Dimensionless, and the only thing the discharge actually depends on in the two lengths | none — a ratio of two lengths | the first grid cell. Its two ends are reachable and were measured: 0.002500 at the smallest drop over the longest path, 50.00 at the largest drop over the shortest. |
| q | Darcy flux, or specific discharge: the discharge divided by the whole face. It carries the units of a speed and is not one | m/s | the first card, q = K i. At the all-minimum corner it reads 5.000e-10 m/s and at the all-maximum corner 0.2500 m/s. The regime ceilings are quoted as fluxes: 0.002008 m/s and 0.02008 m/s. |
| n | Effective porosity: the connected pore fraction that actually carries flow, which is smaller than the total porosity | none — a volume fraction | the fifth slider, 0.050 to 0.500 in steps of 0.01, opening on 0.300. Nothing in the discharge depends on it; it sets the pore velocity and the factor alone. |
| v | Seepage velocity, the average speed in the pores. This is the one reading on the panel that something really travels at | m/s | the second card, v = q / n. At the all-minimum corner it reads 1.000e-8 m/s and at the all-maximum corner 0.5000 m/s. On the sand column it is 0.003333 m/s against a flux of 0.001000 m/s. |
| k | Intrinsic permeability, in square metres: a property of the medium alone, so it does not move when the fluid changes. The same English word also names an unrelated magnetic quantity, which is why it is always written out in full here | m2 | a grid cell. It runs from 1.023e-16 m2 to 1.023e-7 m2 over the states in these tables, and it is the conductivity divided by 9.773e+6 for water. Petroleum work quotes this quantity in a unit of its own, the darcy, which this lab does not print. |
| Re | The grain-size Reynolds number, built on a grain diameter rather than on any pipe or channel dimension | none — a ratio | the wide grid cell, and the sub-line of the regime card. Over the states in these tables it runs from 2.491e-7 up to 199.2, and every one of those strings ends , for the stated d30 = 0.50 mm. |
| nu | Kinematic viscosity of the water, stated for the fluid rather than entered. It appears on this page in this row and nowhere else | m2/s | a fixed constant in the block under the controls, 1.004e-6 m2/s at 20 °C, alongside the density, the dynamic viscosity and g. It is the same string the Reynolds number calculator on this site already prints, so the two pages cannot disagree about the fluid. |
Four of those rows are not controls. The area, the gradient, the intrinsic permeability and the grain-size Reynolds number are all computed from the five sliders, and the kinematic viscosity is a stated property of the fluid that nothing on the panel can change. Where the fluid half of the conductivity comes from is the viscosity simulator's subject: warm the water and the same sand passes it faster, while the intrinsic permeability of the sand sits exactly where it was.
The physics: why the flux is not the speed of the water
The first card divides a discharge by the whole area of the face. That face is mostly solid — at the opening porosity, seven tenths of it is grain — so the number that comes out is volume per second per square metre of something the water cannot enter. It has the units of a speed. Nothing travels at it.
The water has only the connected pores, which is n of that face. The same discharge through n times the area has to move 1/n times faster, which is the second card: v = q / n. On the sand column that is 0.001000 m/s against 0.003333 m/s, and the grid prints the factor itself as 3.3333.
The drawing is that factor, and it is honest about being nothing else. The two arrows share one scale, the lower is drawn at exactly the porosity times the upper, and the caption in the picture says arrows compare v with q at n = 0.300 - a ratio, not a speed. It has to: across the conductivity slider the flux spans nine decades, and no arrow length could carry that absolutely.
The tracer dots make the same point as motion rather than as two static lengths. Both lanes run on one shared phase, so a dot crosses the short arrow in the same time as a dot crosses the long one — which means its on-screen speed is exactly n times the other's. Press Pause flow and both freeze together.
The direction of the error is why any of this matters. Use the flux where the pore velocity belongs and every travel time you compute comes out 1/n times too long, so the water is predicted to arrive later than it does. That is the wrong way round for anything safety-related, and it is the reason this lab puts both numbers on the panel at once instead of making you choose.
The same relation has a second form that strips the fluid out of it. Lower-case k, the intrinsic permeability in m2, is the conductivity divided by 9.773e+6 for water, and it belongs to the medium alone: the grid cell reads 1.023e-10 m2 for the sand column whatever is flowing through it. Petroleum work quotes that quantity in a unit named after the same Darcy, which this lab deliberately does not print.
| Part of the drawing | What it paints | What it does not claim |
|---|---|---|
| the regime band | The coloured strip across the top. At this page's width it reads Darcian - Re 0.4981, for the stated d30 = 0.50 mm on the sand column and Beyond Darcy, PREDICTION only - Re 199.2, for the stated d30 = 0.50 mm past the limit, and its tint changes with the verdict |
it does not claim the verdict is a property of your material. Every version of the string carries the stated grain size, and on a canvas under about 300 px wide the text is dropped rather than shortened, because no shorter candidate could keep both that clause and the prediction mark. The tint stays, and the panel beside the drawing always carries the word and its sub-line in full |
| the head-drop dimension line | The vertical line with an arrowhead at each end, spanning the two water surfaces, labelled dh = 1.00 m. This is the one dimension drawn on a fixed scale, in which 5.00 m fills the available head space |
it does not quietly rescale itself to fill the picture. Because the scale is fixed, a small drop really is drawn small: at dh = 0.05 m the line is at its pixel floor and the label becomes dh = 0.05 m (not to scale), which is the lab saying so rather than drawing a proportion that is not there |
| the two arrows | The pair inside the column, on one shared scale. The upper is the seepage velocity and the lower the Darcy flux, drawn at exactly the porosity times the upper one's length, each labelled with its own value — v = 0.003333 m/s and q = 0.001000 m/s on the sand column. Six pairs of tracer dots run along them on one shared phase |
they are not a speedometer, and the caption in the drawing says so: arrows compare v with q at n = 0.300 - a ratio, not a speed. The flux spans nine decades across the conductivity slider, so no arrow length could carry it absolutely. Past the Darcy limit both arrows are drawn dashed, because the law no longer governs the flow they describe |
| the column itself | A horizontal band of sand between the two reservoirs, with a fixed grain stipple, its length following the path length and its thickness following the diameter, each labelled at the lower corners — L = 1.00 m and d = 0.300 m — above a dashed datum line |
the stipple is not a porosity. Its density is fixed on purpose, so it reads as a material rather than as a quantity a visitor might try to count; the porosity lives in the slider, in the grid and in the length of the lower arrow. A length pushed to a pixel limit is labelled (not to scale) instead |
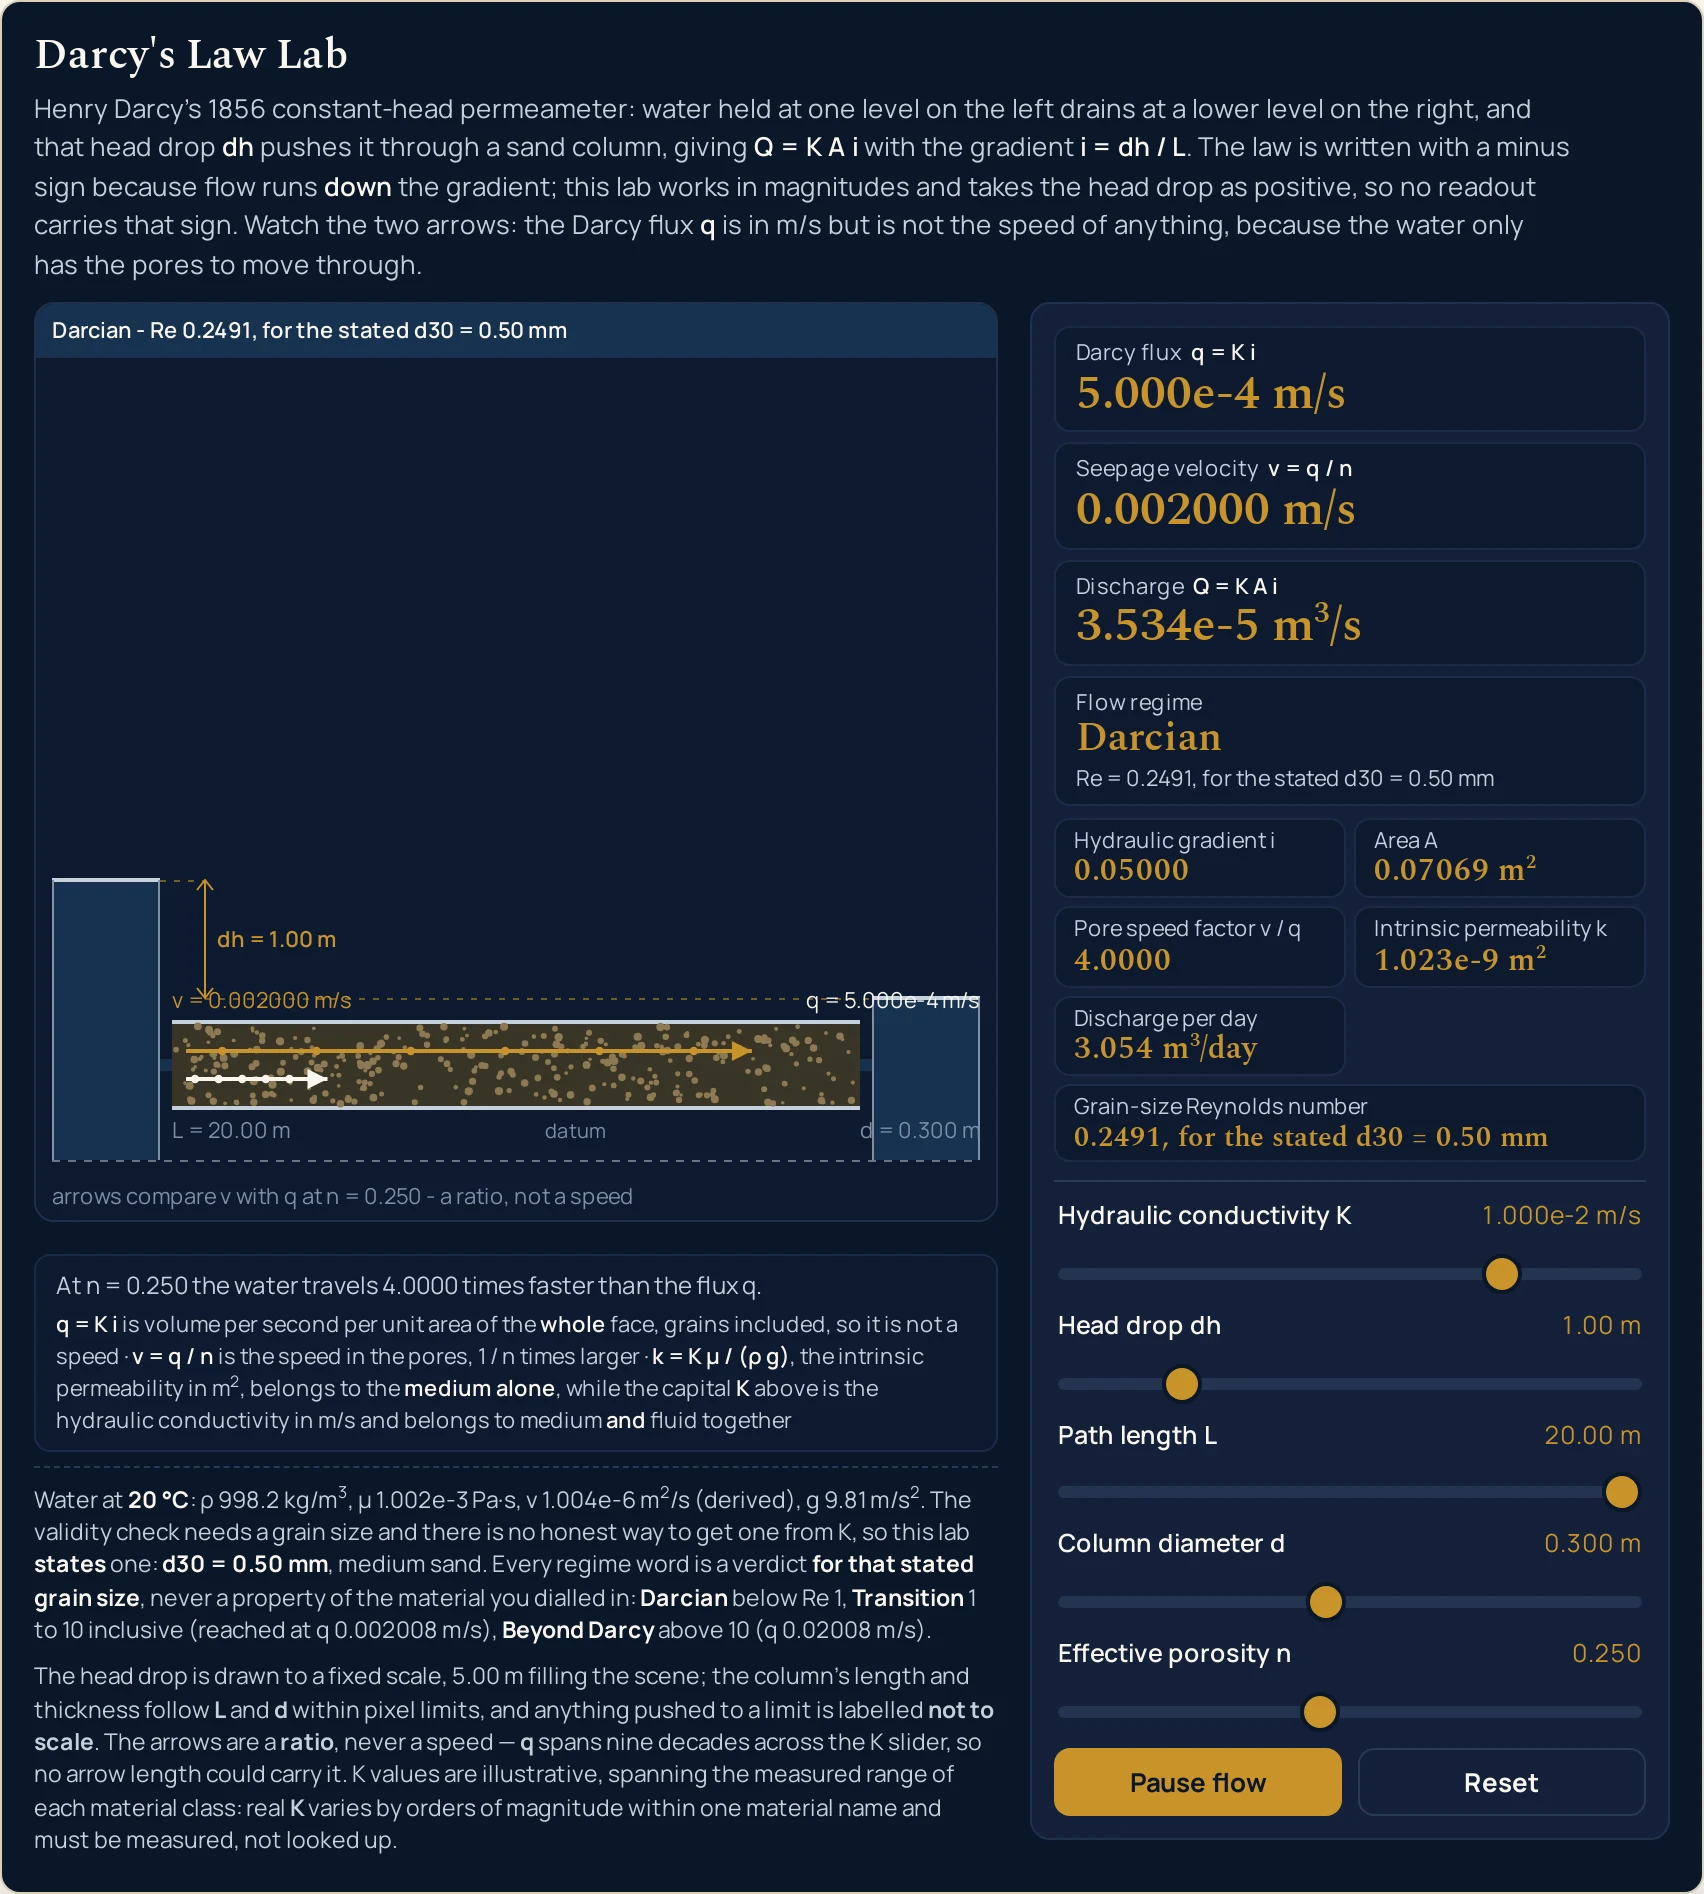
0.05000 and the flux to 5.000e-4 m/s. At this porosity the pore speed factor is 4.0000 rather than 3.3333, and the two arrows separate further. Through the same 0.07069 m2 face that is 3.054 m3/day.Where Darcy's law breaks down
Every state the five sliders reach is answered, and the arithmetic is not where this panel can let you down. What it cannot do is be a real formation, and what it refuses to do is treat its own idealisations as facts. The first two items below matter more than the rest put together.
- Too fast: above a grain-size Reynolds number of about 1 to 10
- This is the hard ceiling, and the fourth card exists to watch it. Below
Re = 1the flow is clearly slow enough for the linear law; experimental work reports it may still hold up to aboutRe = 10; above that, inertial losses the law omits start to matter and it over-predicts the flow. For the stated grain size those ceilings are fluxes of0.002008 m/sand0.02008 m/s. Note that this grouping is built on a grain diameter, which makes it a different number from the flow-dimension one — the Reynolds number guide covers that other case, and the two do not transfer. - The flux is not a speed, and the error is not conservative
- The first card has the units of a speed and the traditional name “Darcy velocity”, and nothing travels at it. Mistake it for the second card and every journey time you work out comes back inflated by that same
1/n, so a front is forecast to turn up long after it really does. Both speeds and the factor between them are on screen at once, which is the point: the swap cannot be made quietly here. - Effective porosity, not total porosity
- The fifth slider wants the connected fraction, the part that actually carries flow. Sealed-off and blind voids swell a sample's stated figure without carrying anything, so the total is always the bigger of the two numbers, and feeding it in here understates how fast the water moves — the unsafe direction again. In fine-grained material the gap between the two can be wide.
- One number cannot describe a whole formation
- Sideways and downward values in the field differ routinely by a large factor, and both shift from metre to metre as the layering changes. The single
Kon this slider stands for a block that is the same in every direction and everywhere, which is a useful fiction and still a fiction. The drawn column reflects that honestly: one material end to end, with a stipple whose density never changes. - The conductivity depends on the fluid; the intrinsic permeability does not
- Capital
Kdescribes the medium and the fluid together, so warm water runs faster through the same sand than cold water does: the dynamic viscosity falls andKrises. Lower-casekstays exactly where it was, which is the whole reason the second form exists and the only justification this grid cell needs. The viscosity simulator is where that fluid property is the subject rather than a constant. - Clays at the shallow end — verify before use
- Some work holds that clay-rich ground stops responding proportionally once you push the driving slope small enough, below a cut-off where seepage is called negligible. The two sources behind this cluster do not say so plainly, so the claim is flagged here and leaned on nowhere. This lab applies the straight-line relation at every setting its sliders can reach, right down to the smallest.
- A supplied grain size makes every verdict conditional
- Nothing in a conductivity tells you how big the grains are, so the lab supplies the figure itself and prints it:
d30 = 0.50 mm. Send the identical flux through gravel and it would land far higher up the scale; through silt, far lower. The fourth card answers one question only — what this flux would mean in medium sand — which is why every string carrying it ends, for the stated d30 = 0.50 mm. - It is a porous medium, not a pipe and not a channel
- This law needs a medium with a conductivity, not a wall with a roughness, and it needs the loss to be proportional to the flow rate. For open-channel flow the question belongs to the Manning equation calculator instead — and note that its roughness coefficient is also written
n, which is not the porosity this lab asks for. - The drawing is honest about its own scales, which means it is not all to scale
- Only the head drop is drawn proportionally, on a fixed scale with
5.00 mfilling the head space. The column length and thickness follow their sliders within pixel limits, and anything pushed to a limit is labelled(not to scale)rather than quietly drawn wrong. At the smallest settings all three labels carry that mark at once. - The lab runs one way only, and measures nothing
- You set five slider positions and it reports what they imply. There is no box to type a measured discharge into and no unit menu, the preset conductivities are illustrative values spanning the measured range of each material class, and no number here came from an instrument. Verify any figure against your own source before you use it.
Where Darcy's law is actually used
- Separating what flows from how fast it travels
- This is what the panel exists for. Load any preset and the first two cards are the two answers to two different questions: how much water crosses the face each second, and how quickly a particle of it is actually moving. A contaminant front follows the second; a yield calculation follows the first. The grid prints the factor between them so neither can be mistaken for the other.
- Getting a feel for ten decades of conductivity
- Press Clay liner and then Gravel aquifer. The discharge goes from
7.069e-11to3.534e-5 m3/sthrough the identical0.07069 m2face, which is the single most important fact about this quantity: material, not geometry, dominates it. That is also why a figure quoted against a material name and not a measurement should be treated with suspicion. - Checking whether the linear law still applies at all
- Load Transition band and then Past the Darcy limit and watch the fourth card go from
TransitiontoBeyond Darcy. The second state is the one worth understanding: the discharge is still printed, the warning comes first, and the two arrows are drawn dashed because the law does not govern the flow they describe. - Seeing what a steep gradient through coarse material really costs
- Drag the head drop up and the path length down together and the gradient cell climbs to
50.00, far past anything a natural formation sustains. The verdict goes toBeyond Darcylong before the slider ends. It is a quick way to see that the usable range of this law is a range of flux, not of gradient or of conductivity on their own. - Converting a conductivity into an intrinsic permeability
- Soil-mechanics and petroleum work quote the medium alone, in square metres, where groundwater work quotes the conductivity in metres per second. The grid does that conversion on every state: the sand column's
1.000e-3 m/sis1.023e-10 m2, which is the conductivity divided by9.773e+6. That is also the number to carry across when the fluid is not water at20 °C. - Teaching the
1/nfactor with nothing hidden - Set everything to the sand column and move the porosity alone. Two readings respond and two refuse to, the lower arrow visibly shortens, and the sentence strip rewrites itself in words at every position. One screen, one slider, and the distinction that the rest of the subject depends on. The Darcy's law calculator is the version to reach for once the question has typed numbers and a real cross-section in it.
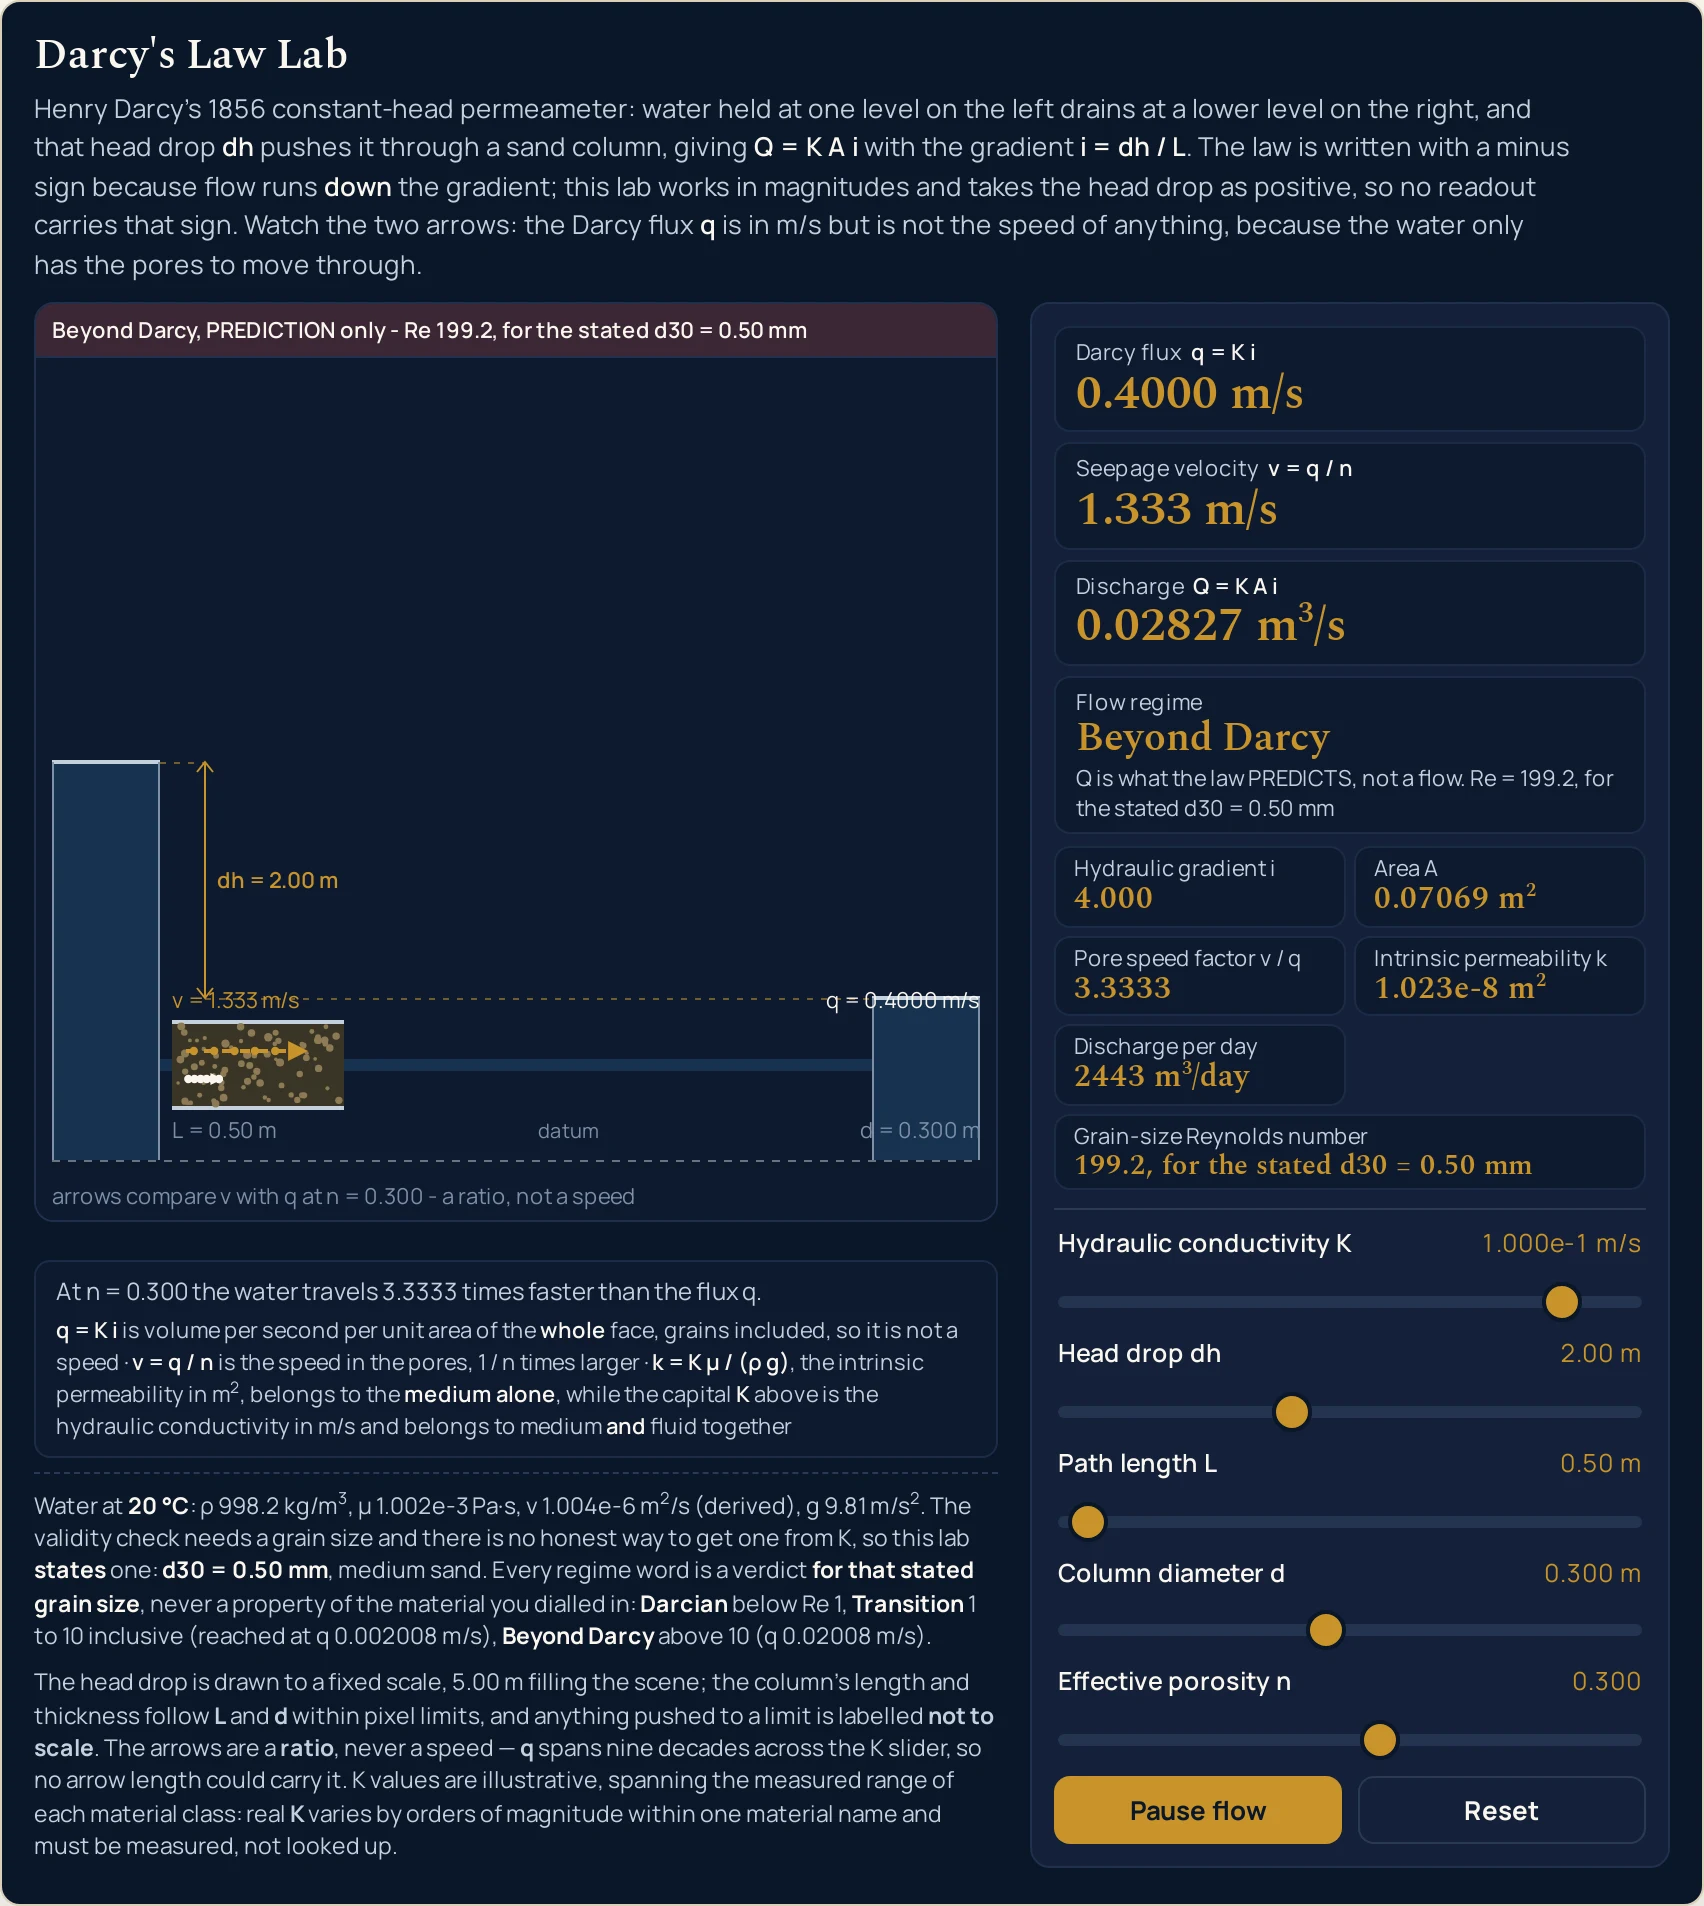
4.000 through coarse material drives the flux to 0.4000 m/s and the verdict to Beyond Darcy, at Re = 199.2, for the stated d30 = 0.50 mm. The panel puts the warning ahead of the figure, so the printed 0.02827 m3/s reads as what the law predicts rather than a flow that would occur, and the drawing dashes both arrows.Where to go next
A panel can put you in a state and let you move one thing at a time, and that is the end of what a panel is for. The Darcy's law guide is where the subject is written out: the 1856 experiment, the two speeds, the ceiling and the worked problems, with each step set out in full.
Two posts own the pieces this lab takes as given. The Reynolds number guide is where the flow-dimension grouping belongs, including the quantity called the Darcy friction factor, and the flow rate guide is volume per unit time as a subject rather than as a reading. The viscosity guide covers the fluid property that separates the two conductivity rows in the table above.
On the tool side, the Darcy's law calculator takes typed figures and a real cross-section and solves in five directions, the flow rate calculator handles volume per second in the general case, the Manning equation calculator covers open channels, and the friction factor calculator covers the other Darcy.
Three neighbouring pictures sit beside this one: the viscosity simulator, the Reynolds number simulator and the Pascal's law simulator. Beyond them there is the simulation library, an index of calculators, and the blog for everything written out at length.
Frequently asked questions
Why are the Darcy flux and the seepage velocity different numbers?
Because they divide the same discharge by different areas. The flux is volume per second per unit area of the whole face, grains and pores together, so nothing actually travels at it. The water has only the connected pores, which is n of that face, so it moves 1/n times faster. On the opening column the two cards read 0.001000 m/s and 0.003333 m/s.
What is the difference between the capital K slider and the lower-case k in the grid?
They are different quantities in different units. Capital K is the hydraulic conductivity in m/s and describes the medium and the fluid together; lower-case k is the intrinsic permeability in m2 and describes the medium alone, so it does not move when the water warms up. For water the two differ by a factor of 9.773e+6, which is rho g over mu.
Why does the lab state a grain size I never entered?
Because the validity check needs one and there is no honest way to recover a grain size from a conductivity. The lab states d30 = 0.50 mm, medium sand, and prints it inside every regime string. So the verdict is always a verdict for the stated reference grain size, never a property of the material you dialled in. In a gravel the same flux would sit far higher.
Why does the last preset say its discharge is a prediction rather than a flow?
Because the linear law no longer holds there. That state reaches Re = 199.2, for the stated d30 = 0.50 mm, nearly twenty times the upper end of the usable band, and above it the inertial losses the law leaves out begin to matter. The printed 0.02827 m3/s is what the law predicts; the real discharge would be lower. The panel says so, and the two arrows are drawn dashed.
What do the two arrows inside the column actually show?
A ratio, and nothing else. They share one scale: the long arrow is the seepage velocity, the short one is the Darcy flux, and the short one is drawn at exactly the porosity times the long one. The flux spans nine decades across the conductivity slider, so no arrow length could carry it absolutely. The caption in the drawing states that outright.
Why does the drawing sometimes say not to scale?
Because a drawn length hit a pixel limit and the lab would rather say so than lie about the proportion. The head drop is always drawn on a fixed scale, with 5.00 m filling the head space, so its dimension line really is proportional. The column length and thickness follow the path length and the diameter only within sane limits, and a clamped one is labelled.
Does the porosity slider change the discharge?
No, and that surprises people. Drag it from 0.050 to 0.500 at the sand setting and the discharge card holds 7.069e-5 m3/s and the flux card holds 0.001000 m/s at every position. Only the seepage velocity and the pore speed factor respond, running from 0.02000 m/s and 20.0000 down to 0.002000 m/s and 2.0000.
What does the Pause flow button do to the readings?
Nothing at all. It freezes the tracer dots travelling along the two arrows and relabels itself Play flow; every card, every grid cell and the whole drawing stay exactly where they were. It is there because the two dot speeds are the clearest statement of the 1/n factor, and comparing two arrow lengths is easier when they have stopped moving.
Why is the conductivity slider logarithmic instead of linear?
Because hydraulic conductivity really does span about ten orders of magnitude, from a clay liner to clean gravel. The slider moves in quarter-decade steps from 1e-9 to 1 m/s, so every decade gets the same amount of travel. A linear control over the same span would leave the whole fine-grained end unreachable in the first pixel.
How many of the printed digits should I trust?
The readings carry four significant figures, switching to exponential form outside the band from a thousandth up to a hundred thousand; the pore speed factor carries four decimals. Those are display choices rather than claims about precision. The lab measures nothing: every digit is arithmetic on five slider positions, and the preset conductivities are illustrative. Verify any figure against your own source before you use it.
References & formula source
- Every figure on this page comes from one linear relation and five slider positions. The discharge through a uniform sample is the hydraulic conductivity multiplied by the area of the face and by the hydraulic gradient, where the gradient is the head drop divided by the path length. The Darcy flux is that discharge divided by the whole area, and the seepage velocity is the flux divided by the effective porosity. The intrinsic permeability is the conductivity multiplied by the dynamic viscosity and divided by the density times gravity. The panel applies those and multiplies out; the written guide derives them and works the problems.
- The constants are stated on the panel rather than derived from anything a visitor sets: water at 20 degrees Celsius, with a density of 998.2 kg/m3, a dynamic viscosity of 1.002e-3 Pa s, a kinematic viscosity of 1.004e-6 m2/s and gravity at 9.81 m/s2. The ratio of density times gravity to dynamic viscosity comes to 9.773e+6, which is the factor between the capital K on the slider and the lower-case k in the grid. That same kinematic viscosity string is what the Reynolds number calculator on this site already prints, so the two pages cannot disagree about the fluid.
- The reference grain size is a stated input and not a measurement, and the honesty rule that follows is the most important sentence in this list. A grain-size Reynolds number needs a grain diameter, and there is no honest way to recover one from a conductivity without importing a correlation this page has not sourced. So the lab states d30 = 0.50 mm, medium sand, and every regime verdict it prints ends on that clause. Read every Darcian, Transition and Beyond Darcy on this page as a verdict for that stated grain size, and for nothing else.
- The regime boundaries are a convention, fixed once and applied everywhere on this page. Below a grain-size Reynolds number of 1 the flow is clearly slow enough for the linear law; experimental work reports that it may still hold up to about 10; above 10 the inertial losses the linear law omits begin to matter and it over-predicts the flow. Both boundary values are placed in the middle band deliberately, so that neither edge can be claimed as valid. For the stated grain size those ceilings are a flux of 0.002008 m/s and 0.02008 m/s.
- The five preset conductivities are illustrative values chosen to span the measured range of each material class. They are not measurements of a named site, a dam, a landfill or a laboratory test. Real hydraulic conductivity varies by orders of magnitude within one material name and has to be measured rather than looked up, which is why this page carries no table of conductivity by material: neither source read for this cluster yields one that survives being read off a chart, and inventing the ranges would be worse than omitting them.
- The last preset is a prediction and not a flow, and the page says so in every place it appears. At that state the grain-size Reynolds number reaches 199.2, for the stated d30 = 0.50 mm, which is nearly twenty times the upper end of the usable band. The printed discharge of 0.02827 m3/s is what the linear law predicts there; the real discharge would be lower, because the inertial losses grow with the flux. The panel prints the warning first so the string still ends on the stated grain size, and the drawing dashes both arrows.
- The simulation was built, gated and frozen before this page was written, and every string quoted here was read back out of the running file rather than computed here. A reference oracle at 88 checks with none failing; a Node tier at 448 checks with none failing; a headless Chrome tier at 534 checks with none failing over four viewports and three iframe parents down to a 164 pixel canvas; a mutation pass over 101 planted faults with 100 killed, one proven redundant by an executed double and no survivors; a compact-height pass measured at 946 pixels against a 1000 pixel ceiling; and a cross-browser pass of 19 checks in which all 129 readouts came out identical in Chrome and in Firefox at each of four widths.
- This page added one measurement of its own and one check. The sim was reloaded at nine widths and its own height read back, giving 937 pixels at 1280, 946 at 860, 1884 at 380 and 3289 at 160, which is where the two iframe fall-back heights in the markup come from. Then sixteen settings were driven on the real sliders and all ten readouts read back from each: 160 cells compared against the build report, none differing. The four intermediate rungs of the ladder table, the slider labels and the drawing labels come from that harvest, because the build report does not carry them.
- What was not verified, stated as a gap rather than left to be assumed. Safari and WebKit: the build on the machine this was tested on cannot start, so Safari was never exercised and nothing here is evidence about it. Assistive technology: every slider carries a label and a spoken value and the drawing carries a full description, but no screen reader was driven and no real touch target was pressed. And one reported effect is listed on this page as unverified rather than as fact, namely a departure from linearity at very low gradients in clay-rich material.
- Nothing on this page is a measurement. Every digit and every pixel is arithmetic on five slider positions, so the lab shows the shape of one relation rather than an observation of any column, and the model is one uniform sample of one material carrying one fluid in a steady state. The head drop is taken as a positive magnitude and the sign of the differential form never reaches a reading. Verify any figure against your own source before you use it for anything that matters.
- Further reading: Darcy's law — Wikipedia