Gay-Lussac's law holds that absolute pressure and absolute temperature keep step in a container whose volume cannot change: their ratio P/T is the same before and after, which is the relation P1/T1 = P2/T2 with both temperatures in kelvin. This lab makes that relation something you can move. Set the pressure and the temperature at which the vessel was sealed, then drag the current temperature and watch the gauge needle, the molecules and the point on the pressure-against-temperature line respond, while the drawn volume holds still and the panel prints pressure, gauge pressure, ratio and constant.
Gay-Lussac's Law: Pressure and Temperature
A sealed, rigid vessel holds a fixed amount of gas. Its walls never move, so the volume is fixed — and at fixed volume the absolute pressure of an ideal gas is proportional to its absolute temperature: P1/T1 = P2/T2, with every temperature in kelvin. Set the pressure and temperature at which the vessel was sealed, then change the temperature and watch the gauge needle, the molecules and the point on the pressure-against-temperature line move. The line is straight, and it runs back to zero pressure at −273.15 °C — which is how the kelvin scale was inferred in the first place. The volume never changes; that is the whole lesson.
Change since sealing+0.0 kPa
Percentage change+0.0 %
Mean molecular speed1.000×
Absolute zero-273.15 °C
where this line reaches zero pressure (0 K)
WhySame temperature, same molecular speed, same pressure: nothing to see until you move the temperature.
What the reading meansNothing has changed yet — move the temperature slider and watch the gauge, not the walls.
Fixed by the physics: absolute zero -273.15 °C (0 K) · standard atmosphere 101.325 kPa · 1 bar = 100 kPa · 1 psi = 6.894757 kPa. The gauge reading uses the STANDARD atmosphere, which is not the same as the local atmospheric pressure where you are.
Tip: load the car tyre, then drop the current temperature to -5 °C. The gauge falls from 259.7 kPa to 203.0 kPa without a molecule leaking out — which is why tyre pressures are specified cold.
Pressure now P2 = P1 T2 / T1
101.3 kPa
= 1.013 bar · 14.69 psi
Gauge pressure
0.0 kPa
= 0.0 psi gauge
Pressure ratio
1.000
= T2 / T1 = 293.15 K / 293.15 K
The constant P / T
0.3456 kPa/K
P divided by T: the same before and after
Sealed pressure101.3 kPa
= 0.0 kPa gauge · 0.0 psi
Sealing temperature20 °C
in kelvin: 293.15 K
Current temperature20 °C
in kelvin: 293.15 K
Load a sealed container
custom setup
Load a real sealed container
The first five presets press the lab's own case buttons, which set all three sliders at once and name the case on the panel. The last two write the sliders directly, so the case line stays at custom setup. The line underneath is copied from the panel once it has updated, so it can only repeat what the lab is showing.
Pick a container above, or drag the sliders yourself.
What Is the Gay-Lussac's Law Simulator?
The Gay-Lussac's law simulator is a free interactive physics lab that runs in your browser — nothing to install and no sign-up. Seal a rigid vessel anywhere between 20 and 600 kPa at a temperature from -100 to 300 °C, then take the gas to anything from -260 to 500 °C. The gauge needle, the molecules and the point on the pressure-against-temperature line all move, while the drawn vessel keeps exactly the same size. The panel prints the absolute pressure, the gauge pressure, the temperature ratio and the constant P divided by T.
| Control | Range | Step |
|---|---|---|
| Sealed pressure | 20 – 600 kPa | 0.1 |
| Sealing temperature | -100 – 300 °C | 1 |
| Current temperature | -260 – 500 °C | 1 |
| Sealed container | 5 case buttons | buttons |
| Molecule animation | Pause / Play | button |
How to use the Gay-Lussac's law simulator
- Load a sealed container. The five buttons under Load a sealed container — Sealed flask, Car tyre, Aerosol can, Gas thermometer and Sealed cylinder taken outside — each set all three sliders and name the case on the line below them, for example Car tyre after a fast drive. Touch any slider and that line goes back to custom setup. Reset returns to 101.3 kPa sealed at 20 °C and read at 20 °C.
- Seal the vessel. Drag Sealed pressure from 20 to 600 kPa in steps of 0.1 kPa; the line under the slider gives the same pressure as a gauge and in psi. Then set Sealing temperature anywhere from -100 to 300 °C, with the kelvin value under it. Together these two fix the whole line drawn on the chart.
- Change the temperature. Drag Current temperature from -260 to 500 °C in whole degrees. Pressure now gives the absolute pressure to four significant figures, with bar and psi beneath it, and the gold ring labelled now slides along the line on the chart while the mist dot at sealed stays put. A whole degree is the finest step the slider offers, so a temperature between two of them, or one you would rather type in kelvin or °F, belongs in the Gay-Lussac's law calculator instead.
- Read the gauge. Gauge pressure takes the standard atmosphere off the absolute pressure, which is what a tyre gauge or a workshop manometer would show. It can go negative: that is a partial vacuum, and the What the reading means line under the chart says so.
- Watch what refuses to move. The constant P / T holds still however far you drag the current temperature, and the tick marked -273.15 (0 K) never shifts either. Pressure ratio shows where the change comes from, with the two kelvin temperatures written out underneath.
- Look inside the gas. Mean molecular speed gives the speed relative to the sealed state and the Why line beneath it turns that into a sentence about collisions. Pause stops the molecules without changing a single number, and Change since sealing and Percentage change keep the running total in kPa and per cent.
Worked example: change one thing at a time
Start from the state the lab boots in, a flask sealed at 101.3 kPa and 20 °C and read at 20 °C, and move one control per row. Every cell below is a string the running lab printed at those slider positions; where a cell and the lab disagree, the lab is right. Rows 2 and 3 move the current temperature alone, and row 4 changes the sealed state instead.
| Step | Sliders: sealed, sealing, current | Pressure now | Gauge pressure | Pressure ratio | The constant | Change |
|---|---|---|---|---|---|---|
| Start: the state the lab boots in | 101.3 kPa · 20 °C · 20 °C | 101.3 kPa | 0.0 kPa | 1.000 | 0.3456 kPa/K | +0.0 % |
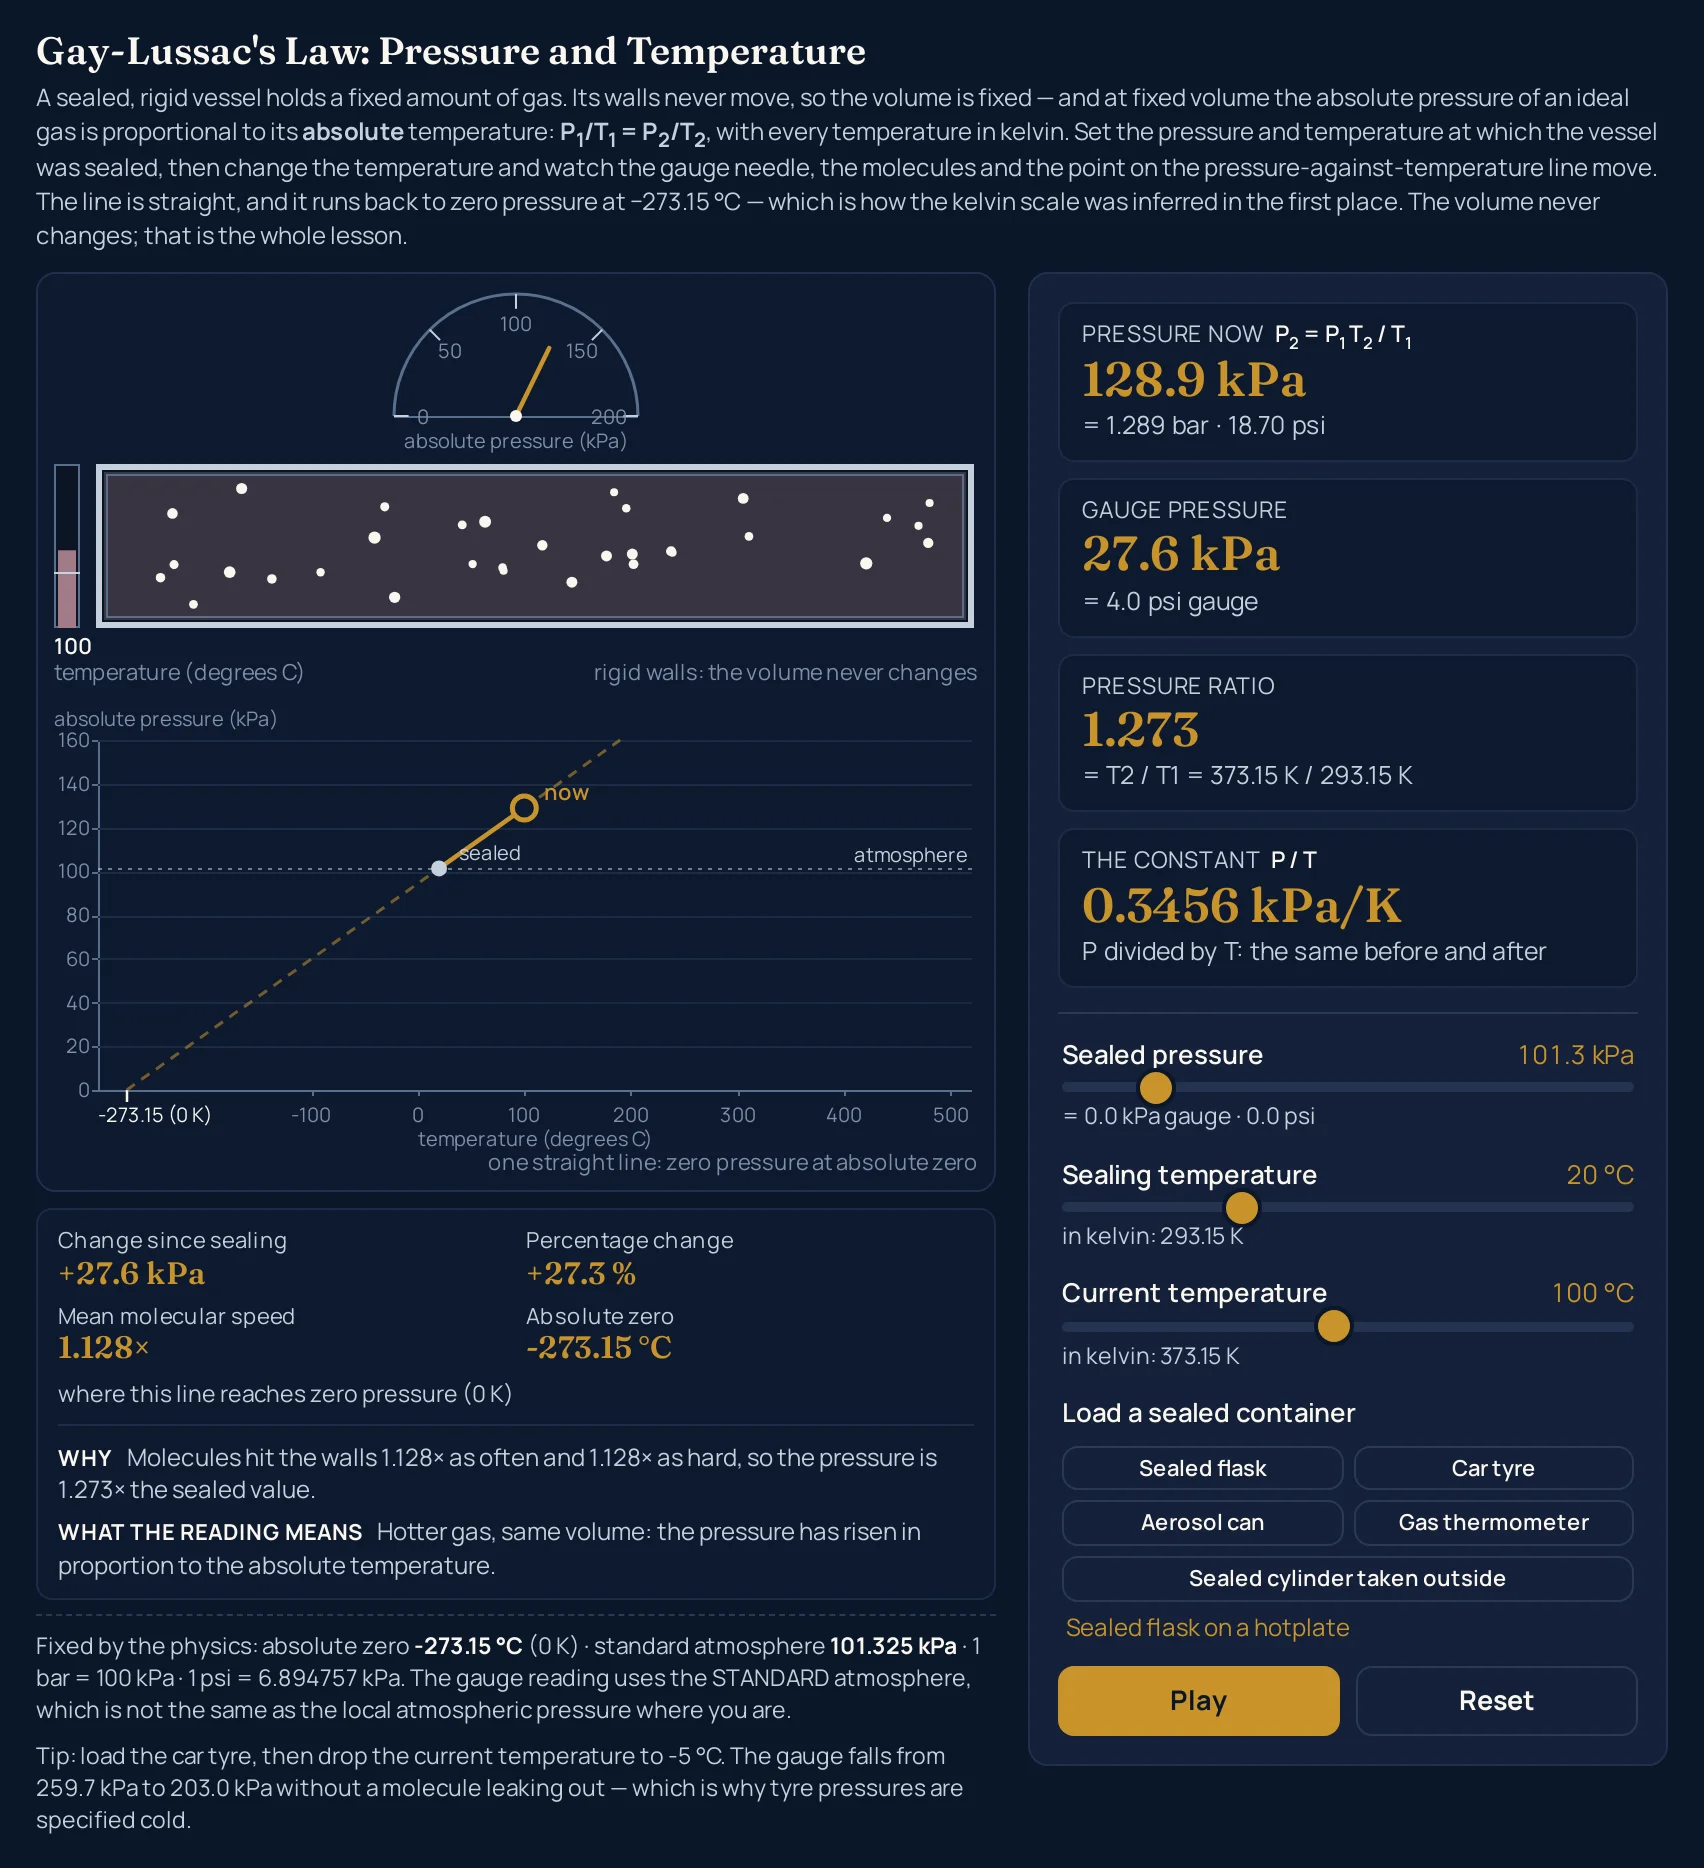
| Current temperature to 100 °C | 101.3 kPa · 20 °C · 100 °C | 128.9 kPa | 27.6 kPa | 1.273 | 0.3456 kPa/K | +27.3 % |
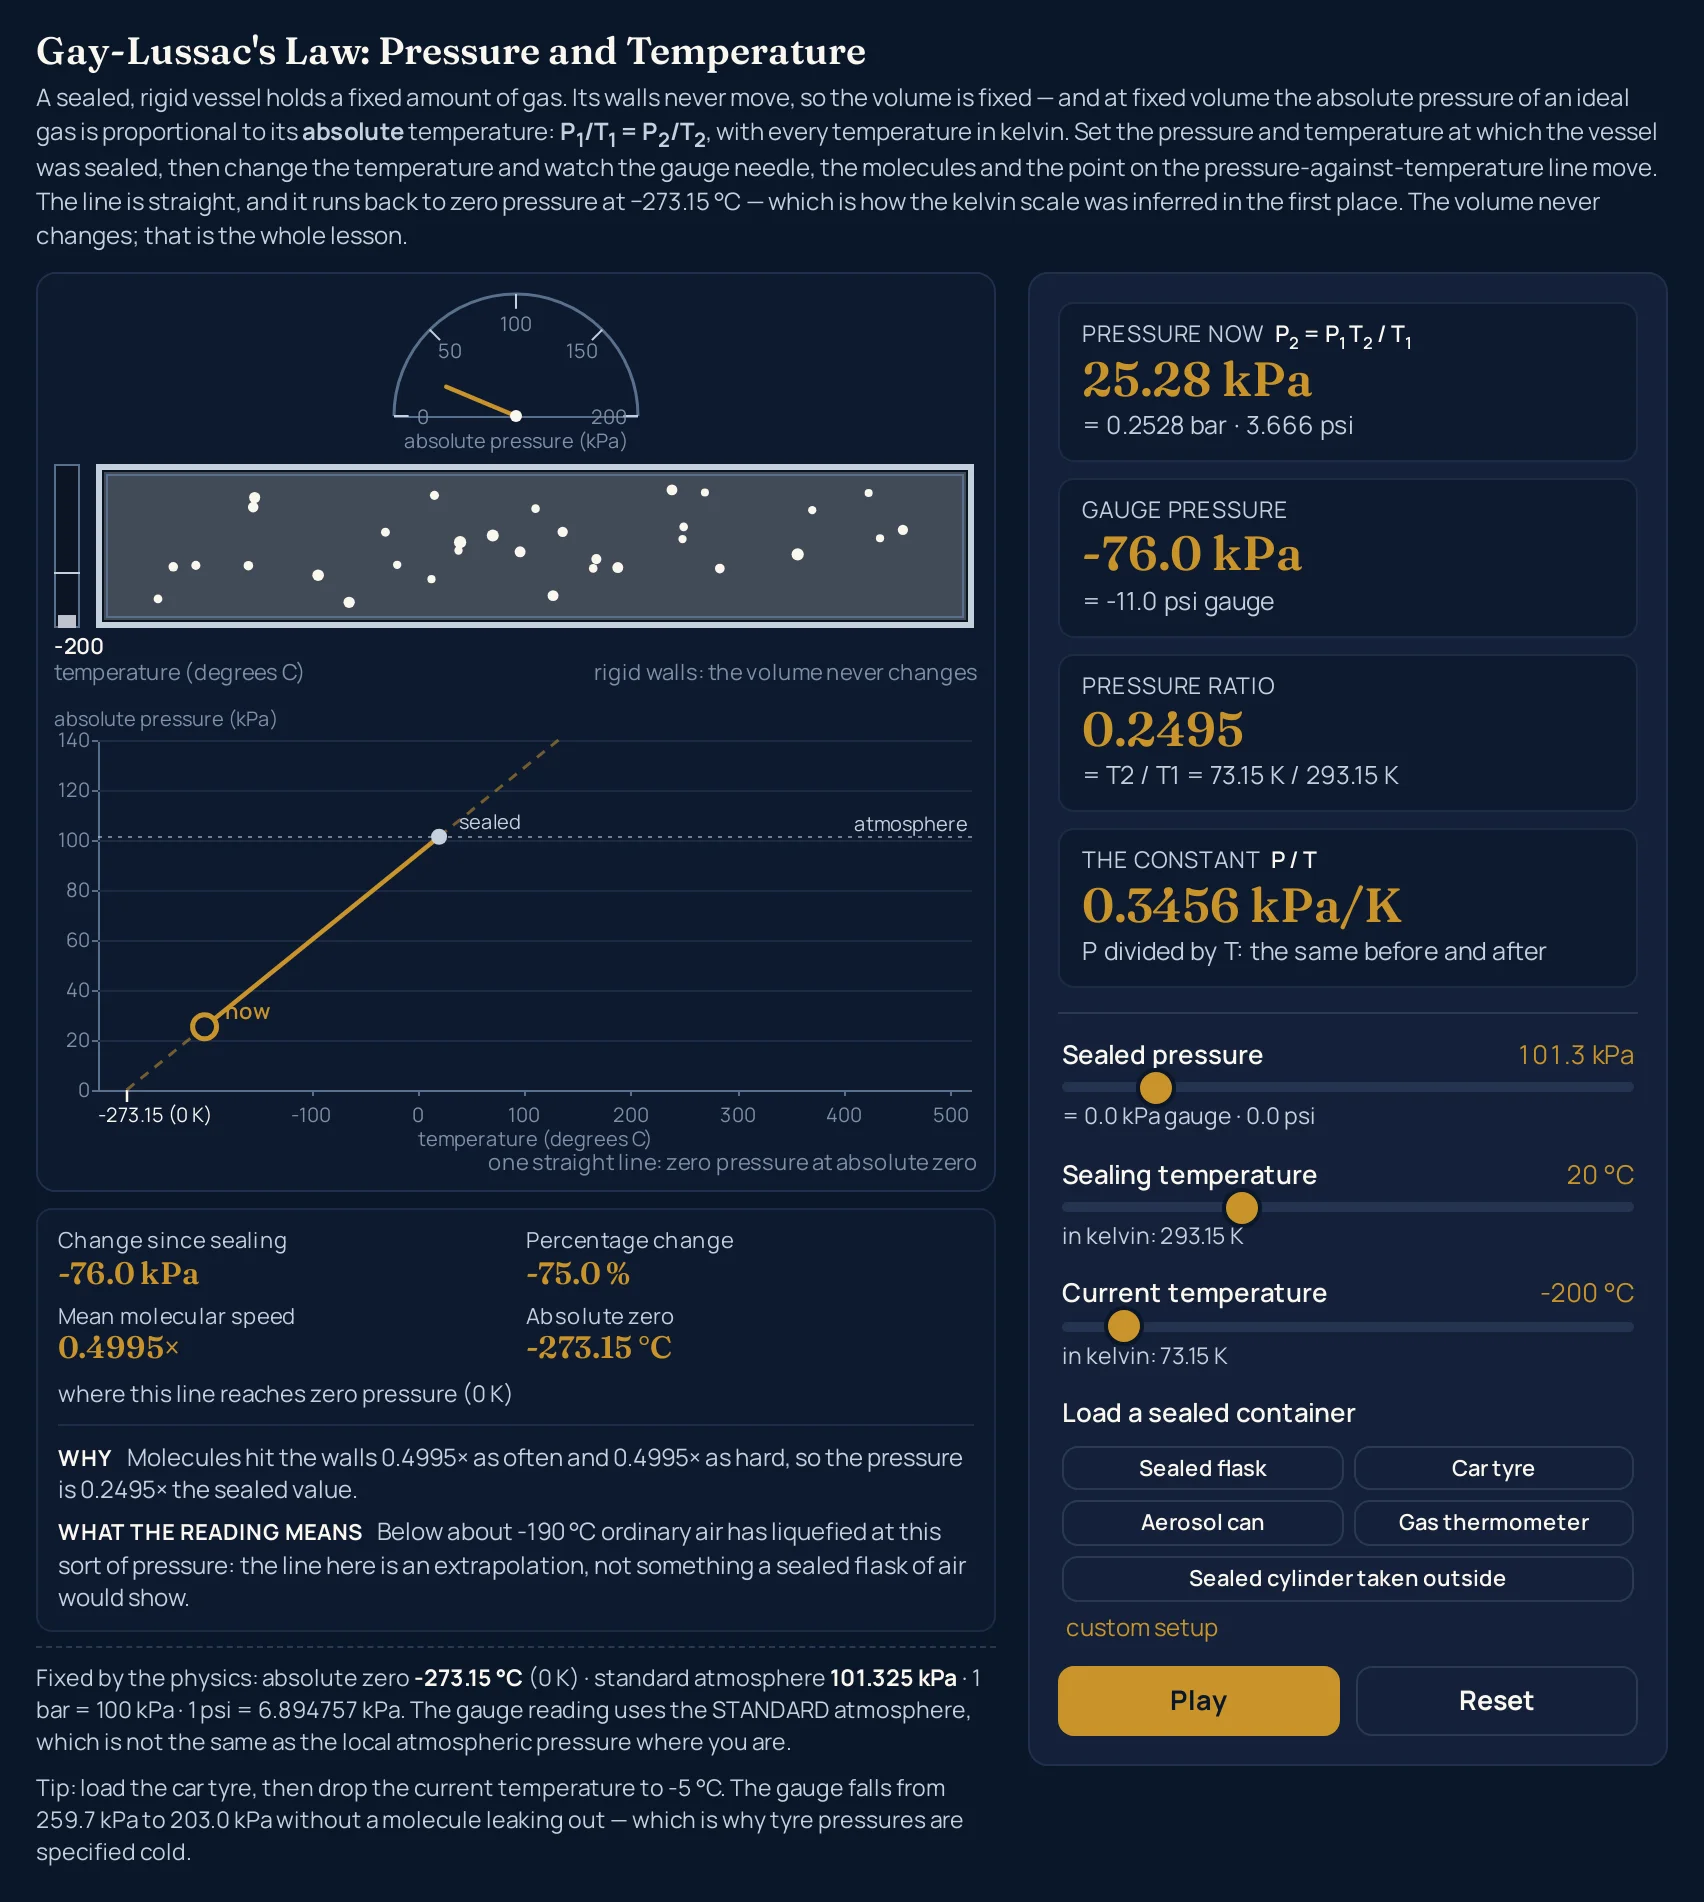
| Current temperature to -200 °C | 101.3 kPa · 20 °C · -200 °C | 25.28 kPa | -76.0 kPa | 0.2495 | 0.3456 kPa/K | -75.0 % |
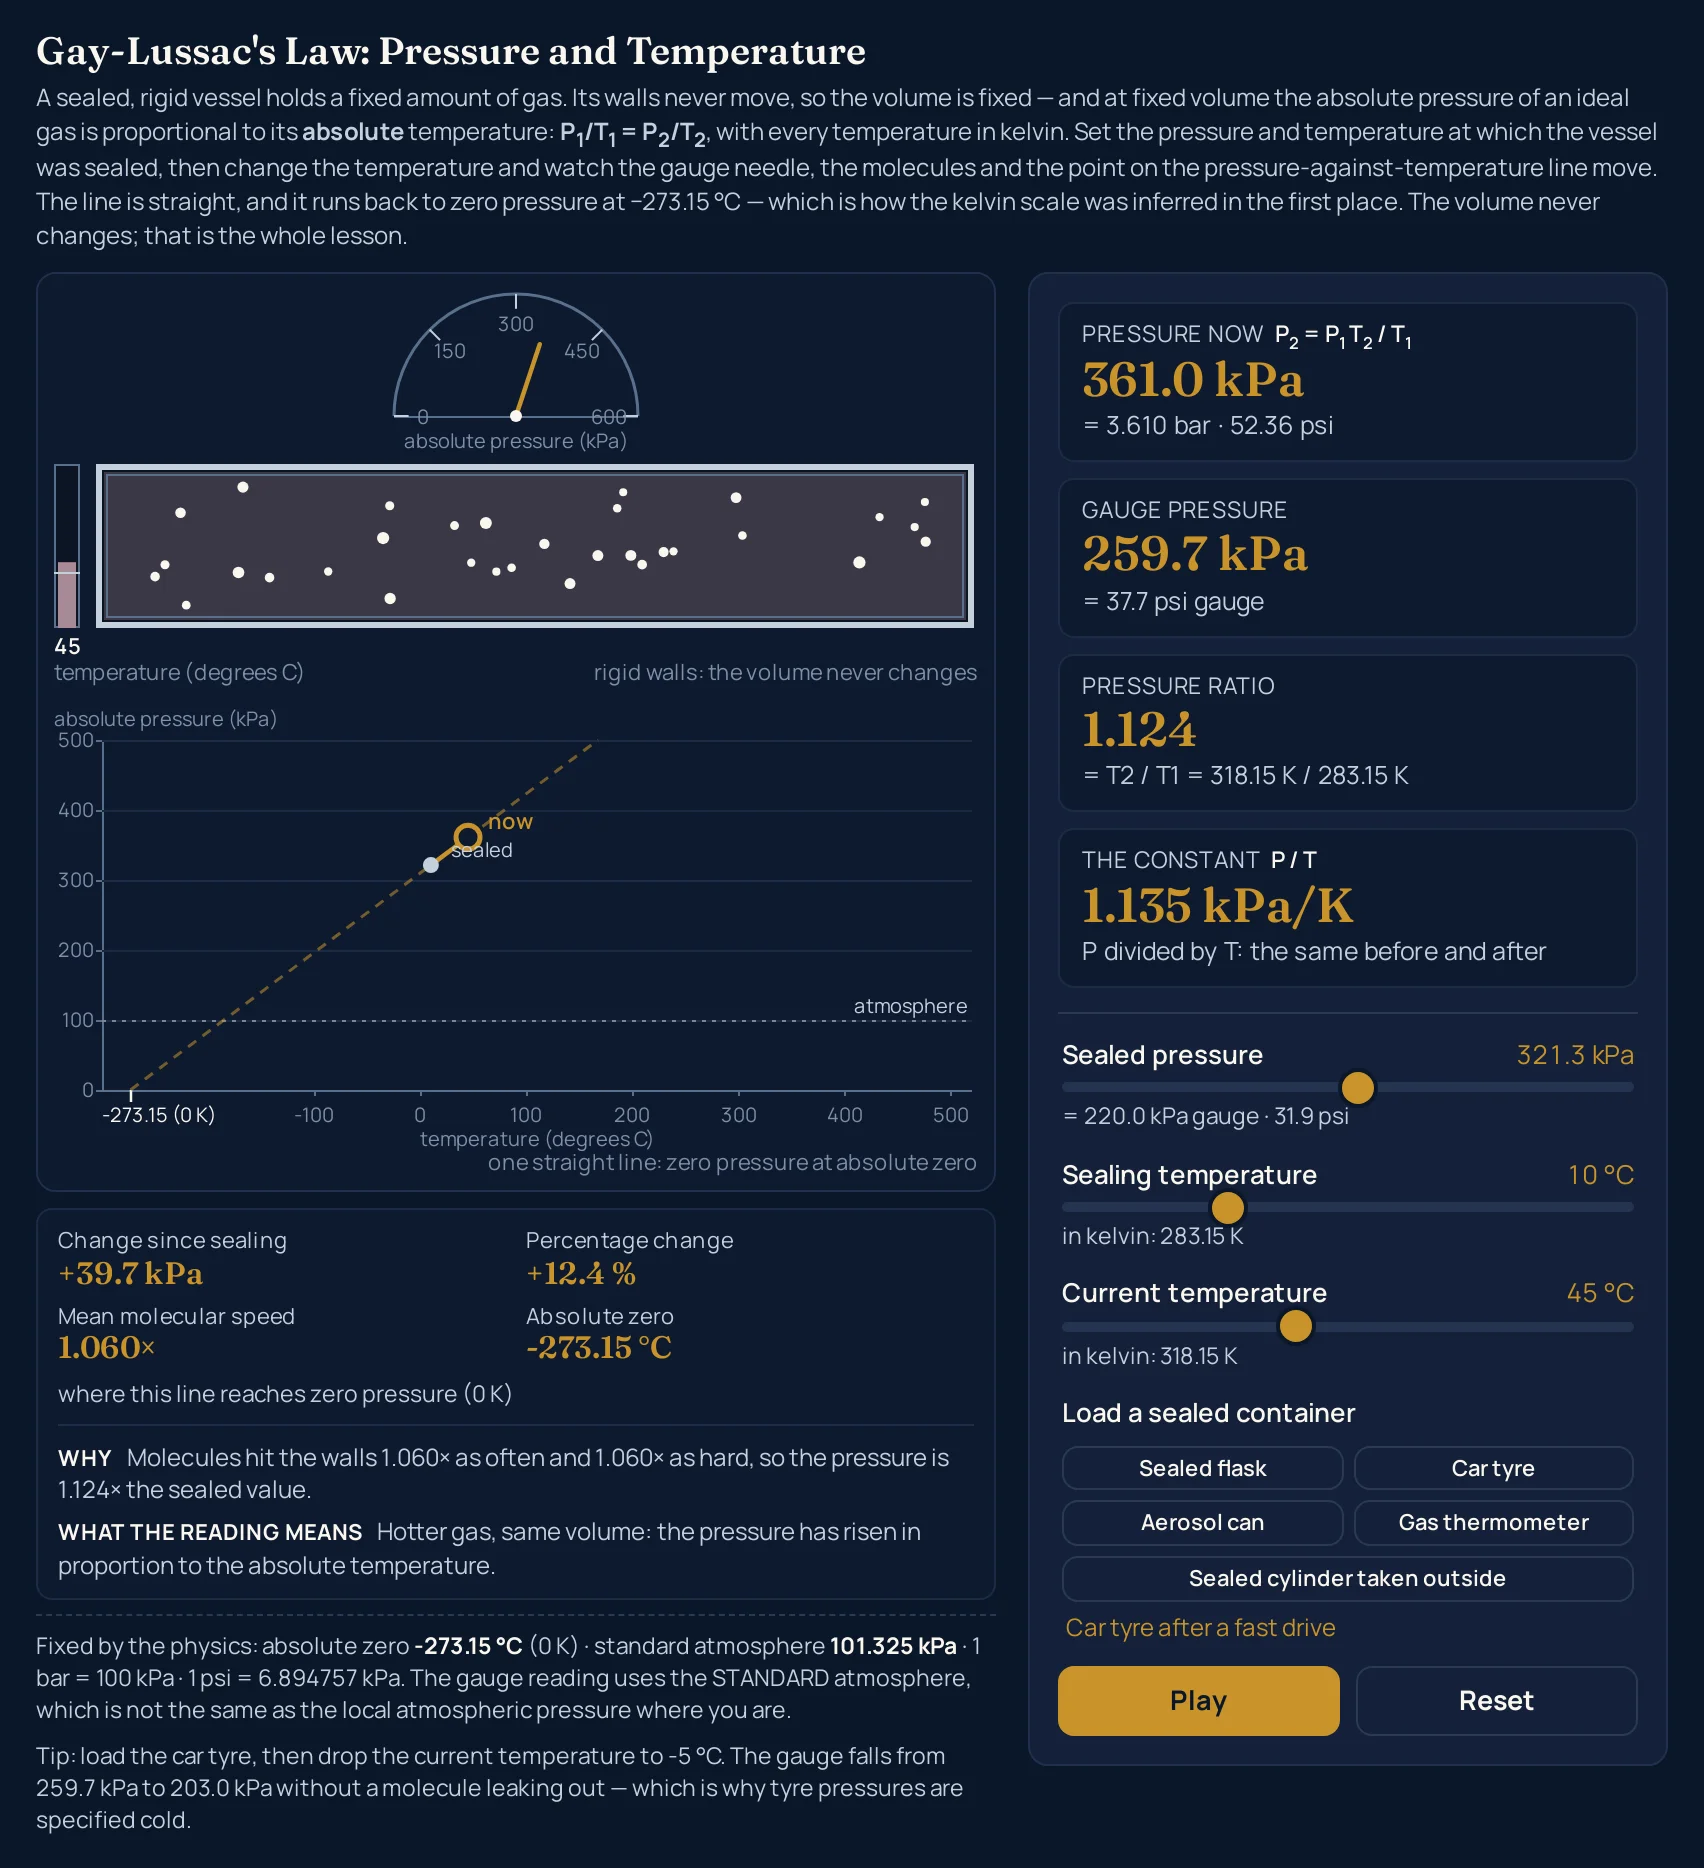
| A different sealed state: the tyre | 321.3 kPa · 10 °C · 45 °C | 361.0 kPa | 259.7 kPa | 1.124 | 1.135 kPa/K | +12.4 % |
Rows 1 to 3 touch nothing but the current temperature. The pressure runs 101.3 kPa, 128.9 kPa and 25.28 kPa, the gauge follows it from 0.0 kPa to 27.6 kPa and on down to -76.0 kPa, and the ratio column tracks the two kelvin temperatures. The constant stays at 0.3456 kPa/K on all three rows, because dividing the new pressure by the new temperature undoes exactly what the slider did.
Row 4 seals a different vessel: 321.3 kPa at 10 °C, read at 45 °C. The constant jumps to 1.135 kPa/K, so the line on the chart has tilted, and 35 degrees of warming adds 39.7 kPa, taking the gauge from 220.0 kPa to 259.7 kPa. What has not moved is the far end of that line, which still reaches zero pressure at -273.15 °C.
The vessel never changes size. Take the current temperature from one end of its travel to the other and the drawn outline holds absolutely still while the needle swings across the dial, exactly as the scene caption promises: rigid walls: the volume never changes. Let the walls move instead and the same heating pushes a piston rather than a needle, which is the case the Charles's law simulator draws at constant pressure.
Formula and symbol reference
The lab works in kelvin throughout, and the constant it prints is what the ideal gas law leaves once two of its four variables are pinned: with the volume and the amount of gas held still, PV = nRT leaves P/T no room to move. The lab adds 273.15 to each Celsius slider, divides the two absolute temperatures and multiplies the sealed pressure by the result, P2 = P1·T2/T1; the gauge value is that pressure minus the standard atmosphere, and the speed ratio is sqrt(T2/T1). Ranges marked “in this lab” are the sliders' own ends and the strings the lab prints there.
| Symbol | Meaning | SI unit | In this lab |
|---|---|---|---|
| P1 | Sealed pressure: the absolute pressure at which the vessel was closed, measured from a vacuum | pascal, Pa (shown in kPa) | 20.0 to 600.0 kPa in this lab, in steps of 0.1; 101.3 kPa after Reset. The line under the slider also gives it as a gauge reading, “= 220.0 kPa gauge · 31.9 psi” at 321.3 kPa. |
| T1 | Sealing temperature, used as an absolute temperature | kelvin, K (set in degrees Celsius) | -100 to 300 °C in whole degrees, which the panel shows as 173.15 K to 573.15 K; 293.15 K after Reset. |
| T2 | Current temperature of the gas, used as an absolute temperature | kelvin, K (set in degrees Celsius) | -260 to 500 °C in whole degrees, or 13.15 K to 773.15 K. The lower end is 13.15 K, not 0 K, so the ratio can never divide by nothing. |
| P2 | Pressure now: the absolute pressure the law gives for the current temperature | pascal, Pa (shown in kPa, with bar and psi under it) | From 0.4589 kPa (20.0 kPa sealed at 300 °C, then cooled to -260 °C) up to 2679 kPa (600.0 kPa sealed at -100 °C, then heated to 500 °C). |
| P2 − Patm | Gauge pressure: what an instrument open to the air would show | pascal, Pa (shown in kPa and psi) | From -100.9 kPa to 2577.8 kPa. Anything below zero is a partial vacuum; a value within 0.05 kPa of zero prints as 0.0 kPa. |
| T2/T1 | Pressure ratio: the number the sealed pressure gets multiplied by | none (a ratio) | 0.02294 to 4.465 in this lab. The line under it spells out the division, “= T2 / T1 = 373.15 K / 293.15 K”. |
| P/T | The constant: the slope of the line on the chart, fixed by the sealed state alone | Pa/K (shown in kPa/K) | 0.03489 kPa/K to 3.465 kPa/K. It reads 0.3456 kPa/K after Reset and does not move when the current temperature does. |
| ΔP | Change since sealing, in kilopascals and as a percentage of the sealed pressure | pascal, Pa (shown in kPa and per cent) | From -586.2 kPa to +2079.1 kPa, and from -97.7 % to +346.5 %. Both carry a sign and one decimal place. |
| sqrt(T2/T1) | Mean molecular speed, relative to the speed in the sealed state | none (a ratio) | 0.1515× to 2.113×. It reads 1.128× for the flask taken from 20 °C to 100 °C, whose pressure ratio is 1.273. |
| 0 K | Absolute zero: the temperature at which this line reaches zero pressure | kelvin, K (shown in degrees Celsius) | Fixed at -273.15 °C at every setting, with the note “where this line reaches zero pressure (0 K)”. It is exact by the definition of the kelvin. |
| Patm | The standard atmosphere the gauge readings are measured against | pascal, Pa (shown in kPa) | Fixed at 101.325 kPa, with 1 bar = 100 kPa and 1 psi = 6.894757 kPa, as the constants line under the chart prints. |
The physics: why heating a sealed can raises its pressure
Pressure is molecules arriving at a wall and bouncing off it, and what sets their speed is the temperature, which measures the average kinetic energy of those molecules and not the energy that flowed in to raise it — the distinction between heat and temperature. Warm the gas and each molecule covers the box more quickly, so it arrives more often, and it carries more momentum when it does. The lab splits those two effects apart for you: Mean molecular speed gives the first, and the Why line multiplies it by the second.
Press Sealed flask and that line reads Molecules hit the walls 1.128× as often and 1.128× as hard, so the pressure is 1.273× the sealed value. The two factors are the same number because both grow with the molecular speed, and multiplying them cancels the square root: the speed figure is the square root of the pressure ratio, 1.128× standing for the square root of 1.273×. That is why pressure follows the absolute temperature itself, and not its square root.
The constant P / T is the slope of the line on the chart, and the sealed state alone fixes it: 0.3456 kPa/K for the flask, 1.135 kPa/K for the tyre. Its sub-line, P divided by T: the same before and after, is the law written as an invariant rather than as a formula. Every line the lab can draw starts from the same place on the temperature axis, the tick marked -273.15 (0 K), which is why Absolute zero is a fixed readout and not a calculation.
Extending a measured pressure line back to the temperature where it would vanish is how the absolute scale was first inferred, and the chart draws that stretch dashed because nothing was measured there. Gauge pressure handles the other translation you have to make in practice. Almost every instrument reads the amount by which the inside beats the outside air, so the lab subtracts the standard atmosphere on the way out — and its constants line warns that the standard atmosphere is not the actual air pressure where you are standing.
Where Gay-Lussac's law breaks down
The lab solves the ideal-gas result exactly, so the law holds perfectly on screen. Real sealed containers depart from it in the ways below, and each item says what the lab does about it.
- A real container is not perfectly rigid
- The drawn vessel has identical bounds at every setting, which is the idealisation. Glass and steel come close to it. A tyre does not: its sidewalls flex, so a warm tyre is very slightly bigger than a cold one, and the gas gains a little room the lab never gives it. Room costs pressure — the trade the Boyle's law simulator isolates by holding the temperature instead — so the real rise is a shade under what the Car tyre preset prints, which is the rigid-walled version of that tyre.
- The gas has to stay a gas
- Take the current temperature to -190 °C or below and the note line changes to a warning: below about -190 °C ordinary air has liquefied at this sort of pressure, so the line there is an extrapolation rather than something a sealed flask of air would show. Once the contents condense there is no gas law left to apply. The boiling points behind that warning, roughly -196 °C for nitrogen and -183 °C for oxygen, are standard figures worth verifying before use.
- High pressure pulls a real gas off the line
- Seal at 600.0 kPa at 20 °C, heat to 300 °C, and Pressure now reads 1173 kPa while the note changes: near ten atmospheres and above, a real gas starts to depart measurably from this straight line. Molecules take up room and attract one another, and neither effect is in the model. The lab keeps drawing the ideal line all the way to its largest reachable pressure, 2679 kPa.
- Nothing may leak, and nothing may dissolve
- The lab simply assumes the amount of gas is the same before and after: there is no leak control, and the molecule count is fixed at 32. A cylinder that weeps at its valve, or one holding a liquid that the gas can dissolve into, will not follow the panel, and that is an accounting failure rather than a failure of the physics. Work a filling temperature out backwards and get an absurd answer, and it is usually the amount of gas that changed.
- The gauge readings use a standard atmosphere
- Every gauge value on the panel is the absolute pressure minus 101.325 kPa, the standard atmosphere, and the constants line says so. The air pressure where you are standing shifts with the weather, and far more than that with altitude, so a real gauge beside you is working against a different atmosphere from the one the lab subtracts. Absolute pressures are unaffected; only the gauge column carries that caveat, and the local figure is worth looking up before you lean on a gauge reading.
- The vessel itself is not modelled
- Only the gas responds to temperature here. Real steel and glass have a thermal expansion of their own, which grows the volume slightly and takes a sliver off the pressure rise, and a real vessel has a temperature limit of its own. The lab has no material, no wall thickness and no failure point, so it will happily show you pressures that no particular container would survive.
- The lab's own limits
- The pressure, the ratio, the constant and the speed ratio each carry four significant figures, and never switch to powers of ten: 0.4589 kPa, 101.3 kPa and 2679 kPa are all four figures. Gauge pressure, the change and the percentage carry one decimal place, and the kelvin lines two. Rounding can flatter a result: seal at 100.0 kPa at 27 °C and heat to 327 °C and the ratio prints 2.000, although 600.15 K divided by 300.15 K is 1.9995. The gauge dial picks its full scale from a ladder of 200, 400, 600, 1000, 2000 and 3000 kPa, so the needle rescales as you go.
Where Gay-Lussac's law is actually used
- Reading a temperature off a pressure
- Press Gas thermometer: a rigid bulb at 100.0 kPa at 0 °C reads 136.6 kPa at 100 °C, a ratio of 1.366. Run that backwards and any pressure between those two is a temperature, which is what a constant-volume gas thermometer does; that a bulb of gas may stand in for a temperature at all is the zeroth of the laws of thermodynamics. Instruments of this kind are how the absolute scale was mapped out, and the dashed run to -273.15 (0 K) on the chart is the extrapolation that gave it its zero.
- Why tyre pressures are specified cold
- Load Car tyre. Its sealed state was fixed on a 10 °C morning, at 220.0 kPa on the gauge; a fast drive to 45 °C brings the gauge to 259.7 kPa with nothing added. Check the pressure hot and the number flatters you, so bleeding it down to the door-frame figure leaves the tyre soft once it has cooled — which is why a garage asks for cold pressures. The lab's tip line walks the same argument the other way, into a cold snap.
- Storing aerosols and gas cylinders
- Press Aerosol can: 300.0 kPa at 20 °C becomes 340.9 kPa at 60 °C, up 13.6 %, with nobody touching it. Labels on such cans often carry a maximum storage temperature of 50 °C, which is the maker's instruction and not a figure from this page. The lab will show you the pressure a warming can reaches; what its seams can stand is decided by whoever built it.
- Derating pressure equipment for temperature
- The allowable pressure quoted for a vessel, a valve or a pipe fitting is normally tied to a temperature, and a hot system is rated lower than a cold one. That rating comes from the material: steel and its gaskets lose strength as they heat, and nothing on this page sets it. What the lab supplies is the other half of the squeeze — the gas sealed inside pushes harder as it warms, in proportion to the absolute temperature — so heat moves the demand up and the allowance down at once.
- Dry sealed volumes: housings and packages
- Where the sealed space holds gas and nothing else — an instrument housing, a dry package — the load on its seams tracks the absolute temperature of that gas, exactly as the panel says. Put liquid water in with it and this law stops governing the total: the water's own vapour pressure joins in and climbs far faster than the temperature does, which is why a food can or an autoclave load is a different sum. Press Sealed cylinder taken outside for the opposite case: 250.0 kPa at 25 °C falls to 203.9 kPa at -30 °C, which is why a cylinder stored in the cold reads low without having lost anything.
Where to go next
The full account — the formula and its symbols, why the temperature has to be in kelvin, seven worked problems and the muddle over whose name the law carries — is in the article Gay-Lussac's Law (P1/T1 = P2/T2). To put your own figures through it, including solving backwards for a temperature, use the Gay-Lussac's law calculator. Hold the pressure fixed instead of the volume and you are in Charles's law; hold the temperature and you are in Boyle's law; put all three together in the ideal gas law simulator, and the rest of the tools are in the library of physics simulations.
Frequently asked questions
Why does the vessel stay the same size when I heat the gas?
Because a rigid container is the one condition this law is about, and the lab draws it literally: the outline has identical bounds at every setting of every slider. Only the needle, the thermometer bar, the gas tint and the molecules respond. The caption under the scene says so in words, rigid walls: the volume never changes, and the pressure carries the whole of the change instead.
Why does the constant P / T readout not move when I drag the current temperature?
Because that readout is the sealed pressure divided by the sealing temperature, and the current-temperature slider is not part of that division. Take the default flask from 20 °C to 100 °C and then down to -200 °C: the pressure runs 101.3 kPa, 128.9 kPa, 25.28 kPa, and the constant reads 0.3456 kPa/K at all three. Move the Sealed pressure or Sealing temperature slider and it changes at once.
What does a negative gauge pressure mean on the panel?
It means the gas is now pushing on the walls more weakly than the air outside. Gauge pressure is the absolute pressure minus the standard atmosphere of 101.325 kPa, so cooling the default flask to -78 °C gives 67.44 kPa absolute and -33.9 kPa on the gauge. The note line then reads: the gas is now below atmospheric pressure, a gauge would read a partial vacuum.
Why is the mean molecular speed a smaller number than the pressure ratio?
Because speed grows as the square root of the absolute temperature while pressure grows with the temperature itself. Heating the sealed flask from 20 °C to 100 °C gives 1.128× on the speed readout and 1.273× on the pressure ratio, and the speed readout is that ratio's square root, which above 1.000 is always the smaller of the two. The molecules arrive more often and hit harder, and the two factors are the same number.
Why is part of the line on the chart drawn dashed?
Because only the stretch between the sealed state and the current state is spanned by the two states the lab is showing. Everything colder than the lower one and hotter than the higher one is extrapolation, so it is dashed, including the run down to the tick marked -273.15 (0 K). Move the current-temperature slider and the solid section grows or shrinks with it.
Why does the current temperature slider stop at -260 °C?
Because -260 °C is 13.15 K, so the kelvin temperature stays safely above zero and the ratio never divides by nothing. The physics has already stopped well above that point: ordinary air has liquefied by about -190 °C, and the lab says so on its note line. The predictions below that temperature show where the straight line goes, not what a flask of air would do.
Does pausing the animation change any of the readings?
No. Nothing in the panel depends on time, so Pause only rests the molecules and leaves the scene drawn; every readout keeps the value it had. The sliders still work while the lab is paused, which is the easiest way to read a number off a moving scene. Press the button again and it reads Pause once more as the molecules resume.
Why does the panel read 0.0 kPa gauge when the sealed pressure is 101.3 kPa?
Because 101.3 kPa is a hair below the standard atmosphere the lab subtracts, 101.325 kPa, and the gauge line rounds anything within 0.05 kPa of zero to 0.0 kPa rather than printing a negative zero. A flask sealed at ordinary air pressure should read nothing on a gauge, which is what you get. Raise the sealed pressure slider and the gauge value climbs immediately.
References & formula source
- Halliday, Resnick and Walker, Fundamentals of Physics: the kinetic theory of gases, where the pressure on a wall is built up from the momentum its molecules deliver.
- Young and Freedman, University Physics: equations of state, including the ideal-gas equation and the constant-volume gas thermometer.
- Atkins and de Paula, Physical Chemistry: the properties of gases, covering the pressure-temperature relation and the departures of real gases from it.
- Bureau International des Poids et Mesures, The International System of Units (SI Brochure): the definition of the kelvin, which is what makes 0 K exactly -273.15 °C.
- Further reading: Gay-Lussac's law — Wikipedia