Avogadro's law holds that a gas kept at one pressure and one temperature fills a volume proportional to the number of molecules in it, so V1/n1 = V2/n2, with the room one mole needs given by Vm = R T / P. It stands two cylinders side by side, before and after, each capped by a piston free to rise against the same pressure, with both gas columns drawn to one scale so the height ratio you see is the mole ratio. Four sliders set the two amounts, the pressure and the temperature; three buttons choose the gas. Every figure below was read off the running simulation.
Avogadro's Law: Volume Follows the Molecule Count
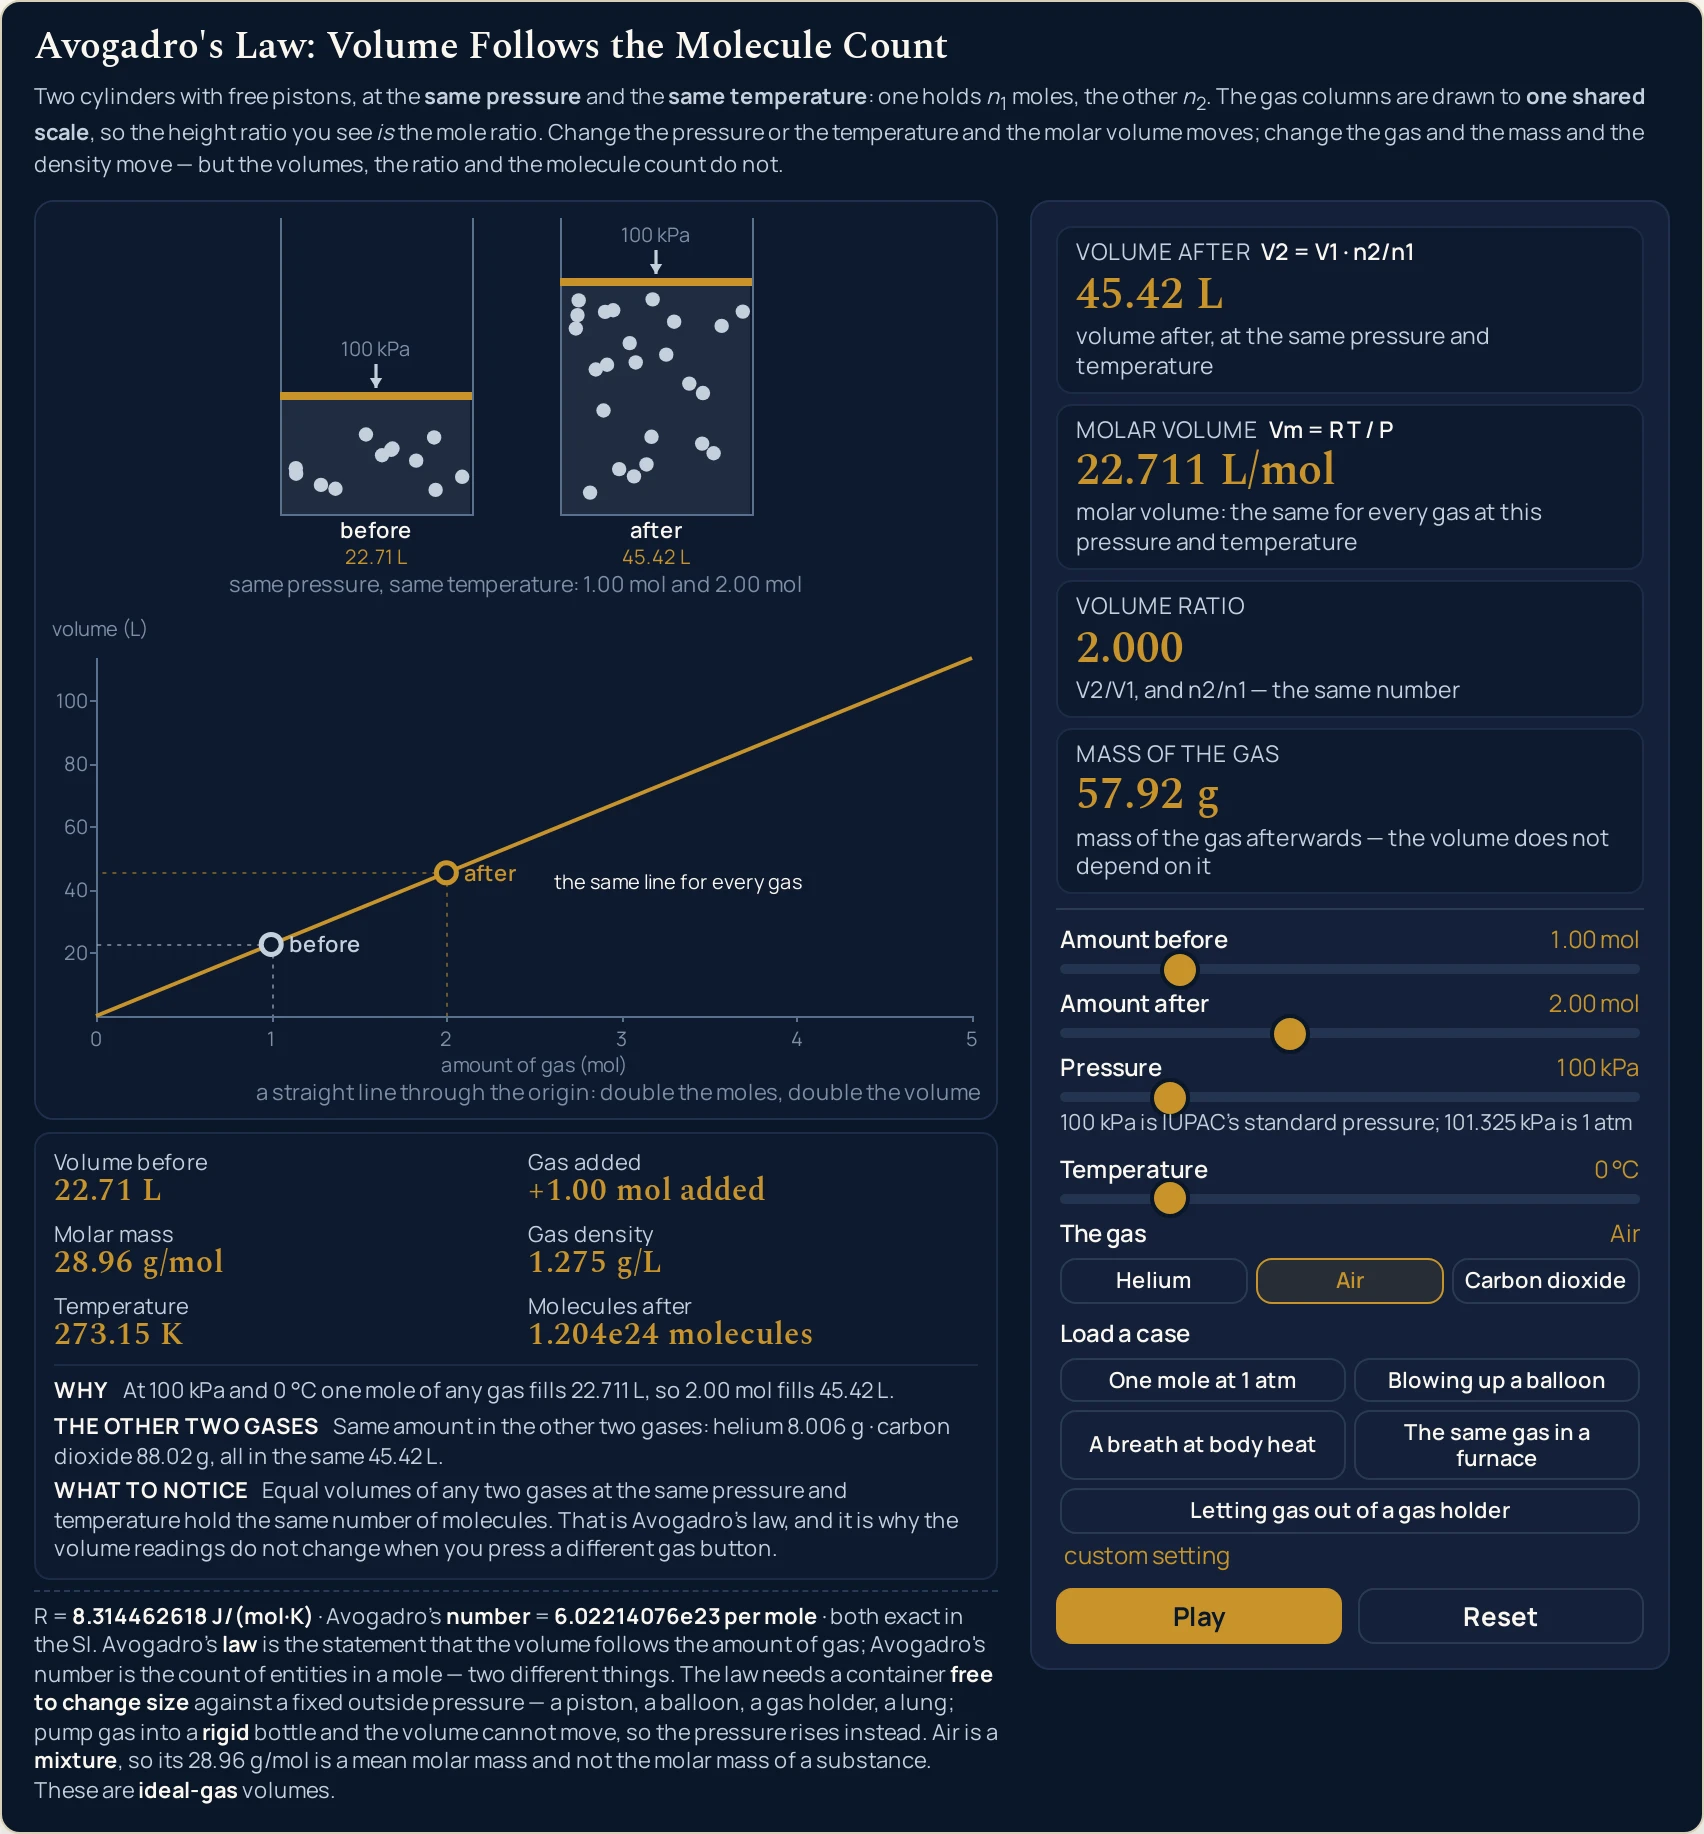
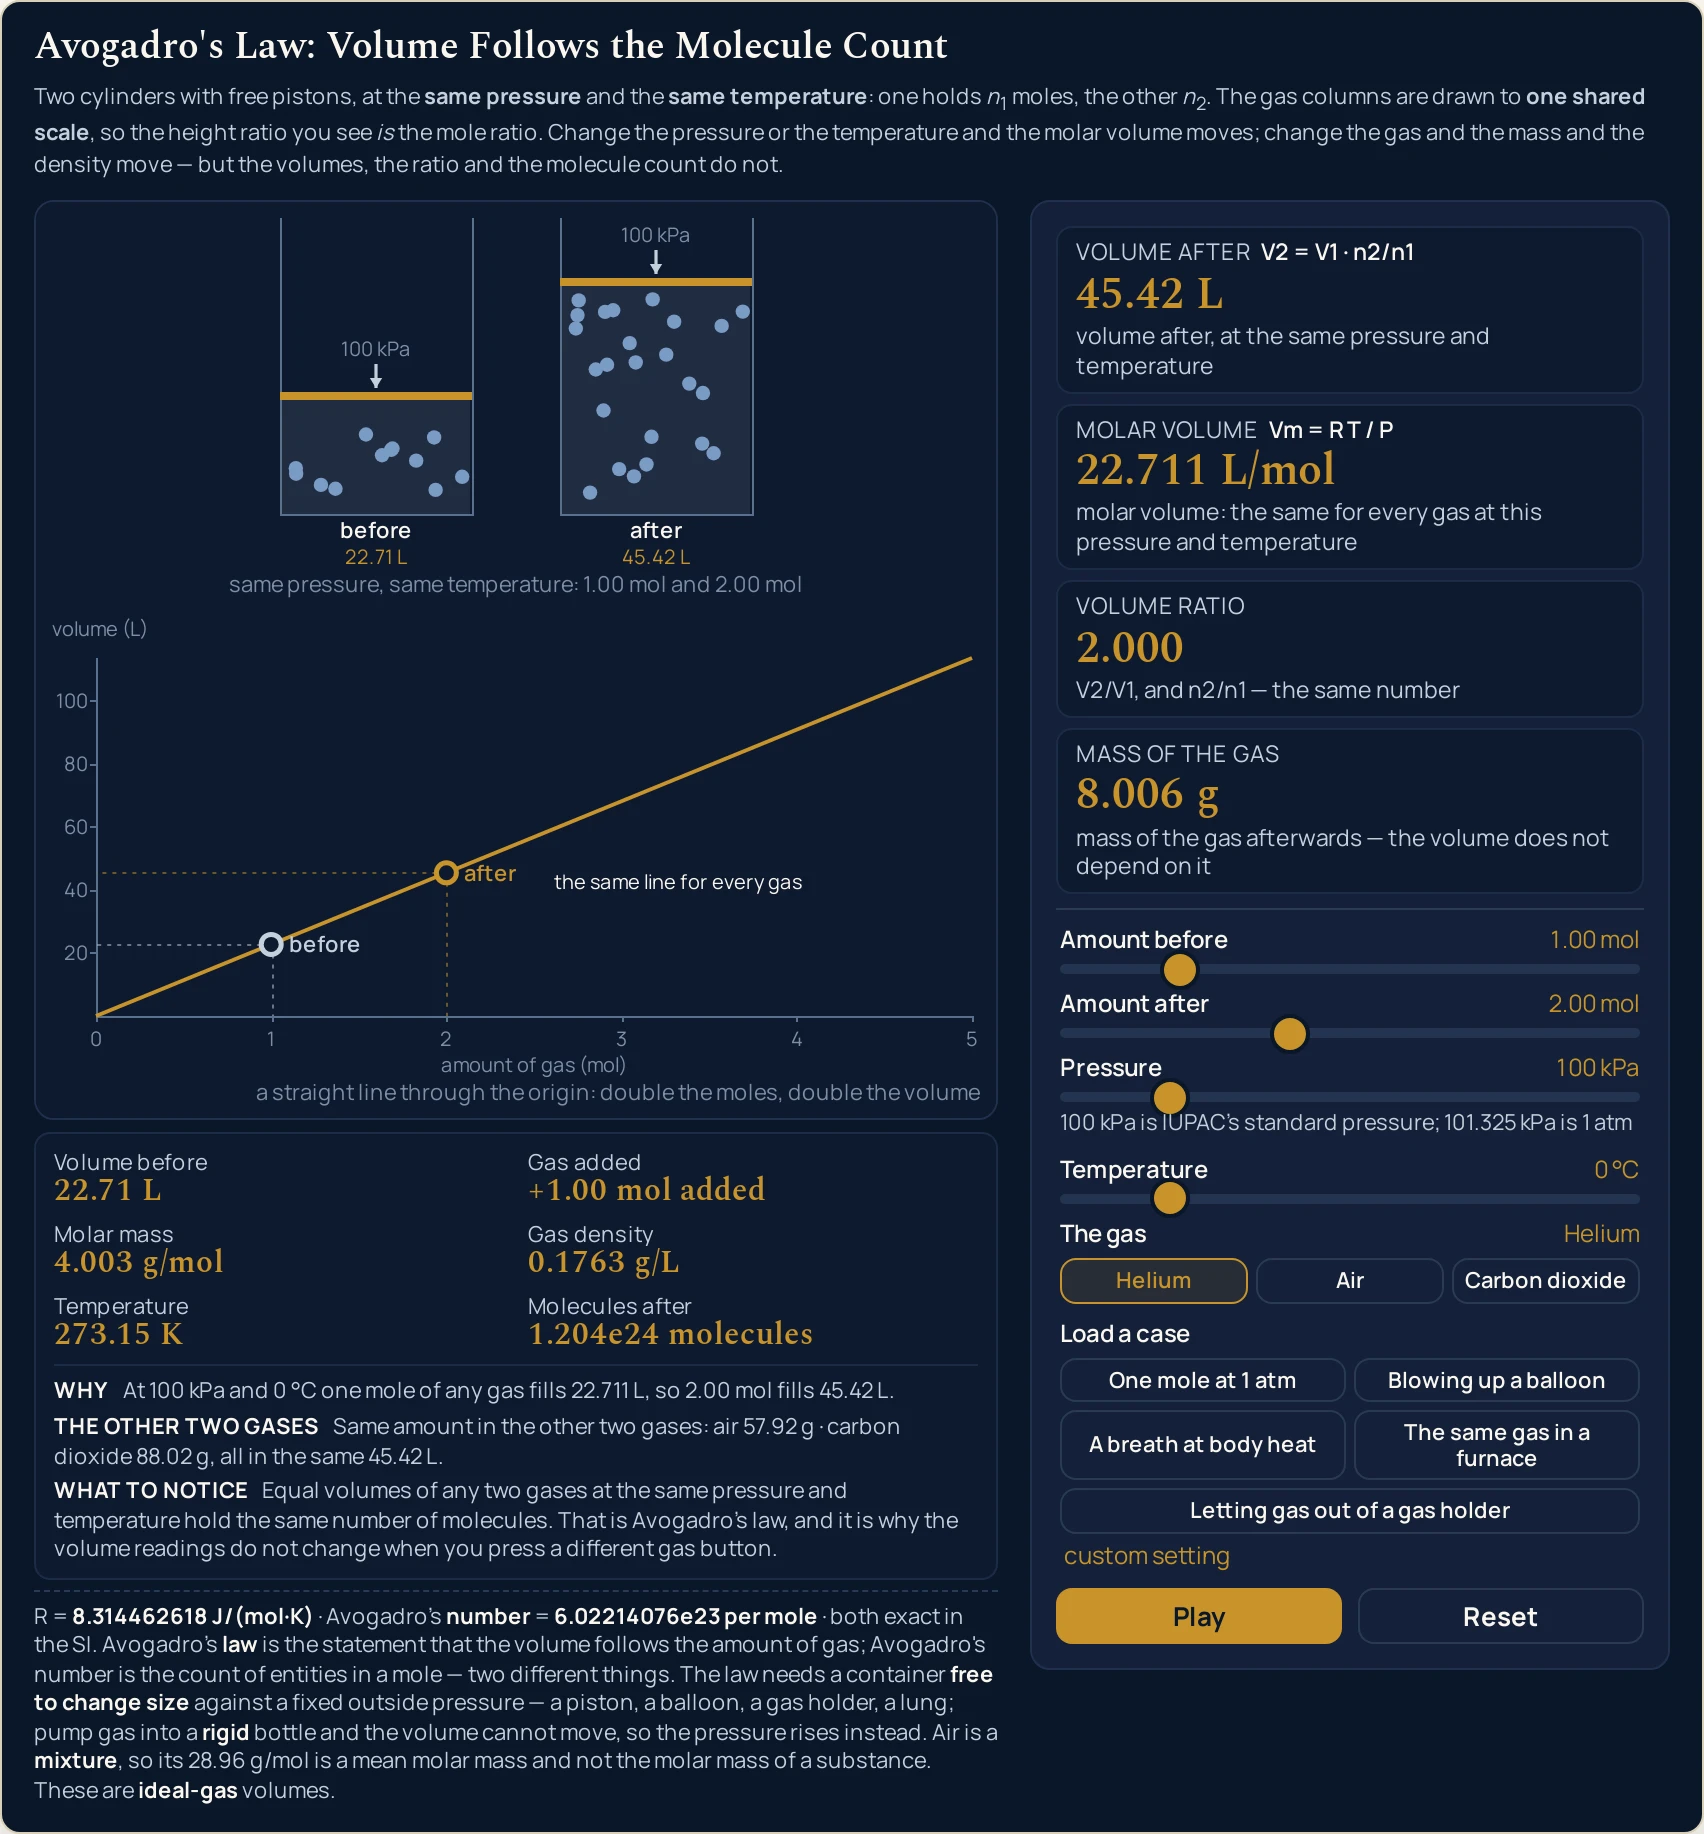
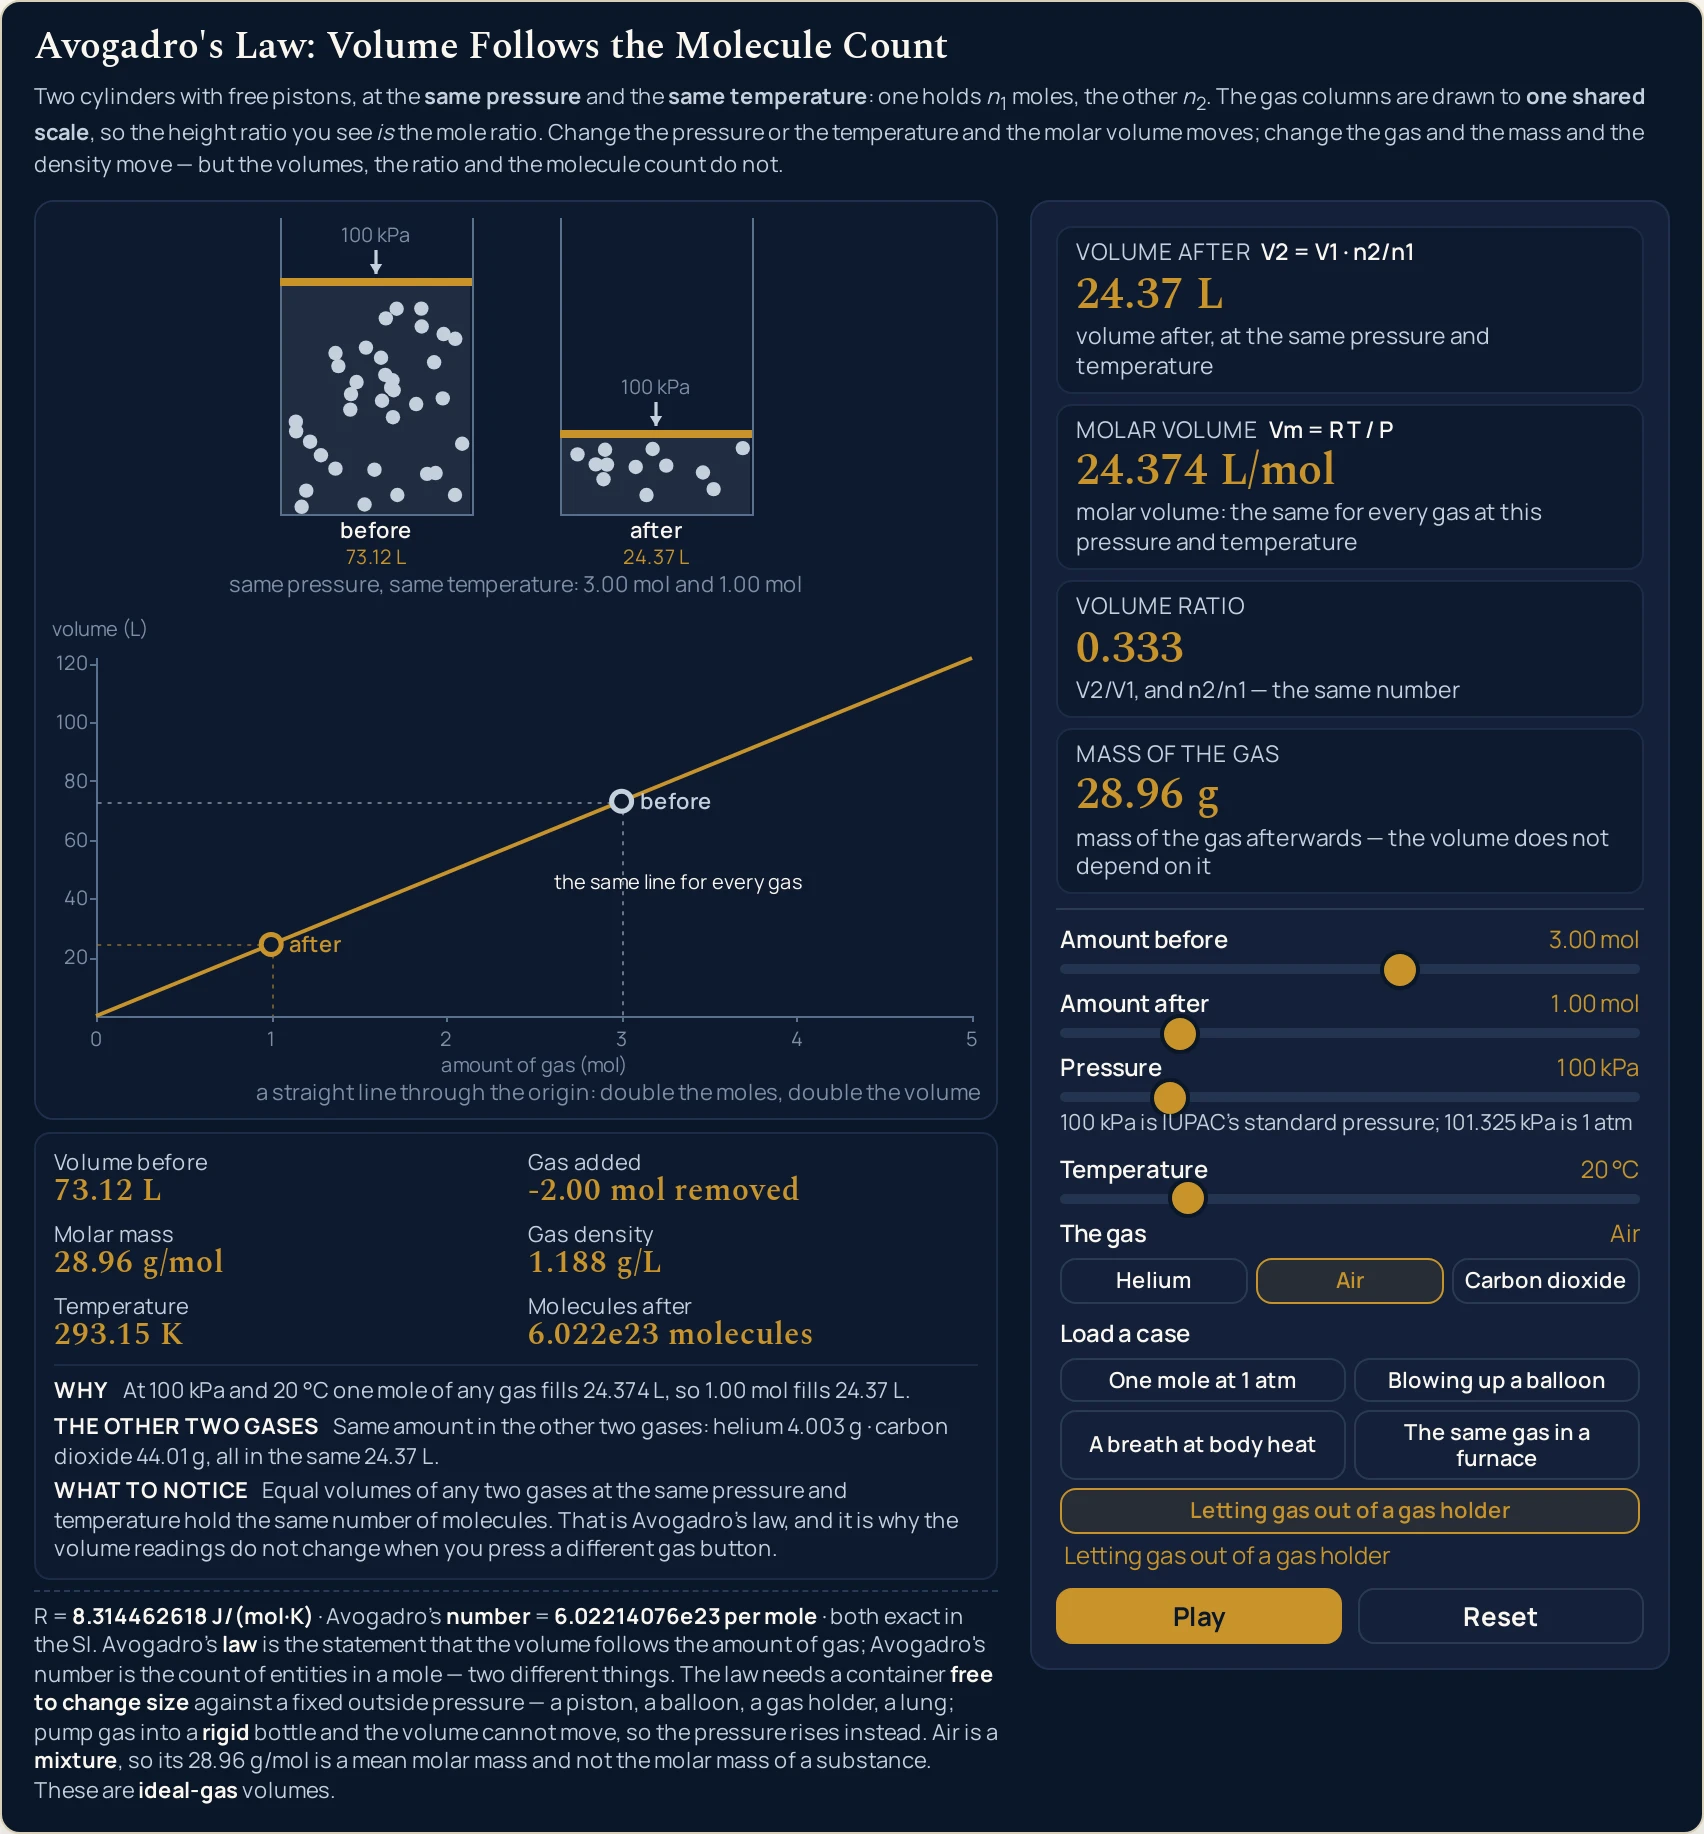
Two cylinders with free pistons, at the same pressure and the same temperature: one holds n1 moles, the other n2. The gas columns are drawn to one shared scale, so the height ratio you see is the mole ratio. Change the pressure or the temperature and the molar volume moves; change the gas and the mass and the density move — but the volumes, the ratio and the molecule count do not.
Volume before22.71 L
Gas added+1.00 mol added
Molar mass28.96 g/mol
Gas density1.275 g/L
Temperature273.15 K
Molecules after1.204e24 molecules
WhyAt 100 kPa and 0 °C one mole of any gas fills 22.711 L, so 2.00 mol fills 45.42 L.
The other two gasesSame amount in the other two gases: helium 8.006 g · carbon dioxide 88.02 g, all in the same 45.42 L.
What to noticeEqual volumes of any two gases at the same pressure and temperature hold the same number of molecules. That is Avogadro's law, and it is why the volume readings do not change when you press a different gas button.
R = 8.314462618 J/(mol·K) · Avogadro's number = 6.02214076e23 per mole · both exact in the SI. Avogadro's law is the statement that the volume follows the amount of gas; Avogadro's number is the count of entities in a mole — two different things. The law needs a container free to change size against a fixed outside pressure — a piston, a balloon, a gas holder, a lung; pump gas into a rigid bottle and the volume cannot move, so the pressure rises instead. Air is a mixture, so its 28.96 g/mol is a mean molar mass and not the molar mass of a substance. These are ideal-gas volumes.
Volume after V2 = V1 · n2/n1
45.42 L
volume after, at the same pressure and temperature
Molar volume Vm = R T / P
22.711 L/mol
molar volume: the same for every gas at this pressure and temperature
Volume ratio
2.000
V2/V1, and n2/n1 — the same number
Mass of the gas
57.92 g
mass of the gas afterwards — the volume does not depend on it
Amount before1.00 mol
Amount after2.00 mol
Pressure100 kPa
100 kPa is IUPAC's standard pressure; 101.325 kPa is 1 atm
Temperature0 °C
The gasAir
Load a case
custom setting
Load a real gas sample
The first five buttons press the lab's own case buttons, which write all four sliders at once and name the case on the line beneath them. The last three write the sliders directly, so that line stays at custom setting. None of the eight touches the gas, because the point of the lab is that the gas is the one choice the volumes ignore; every figure quoted below reads the same whichever of Helium, Air and Carbon dioxide is showing.
Pick a case above, or drag the sliders yourself.
What Is the Avogadro's Law Simulator?
The Avogadro's law simulator is a free interactive physics lab that runs in your browser — nothing to install and no sign-up. Set the amount of gas before and after anywhere between 0.10 and 5.00 mol in 0.01 mol steps, put the pressure the two pistons work against between 20 and 500 kPa, and take the temperature from -100 to 500 °C. The panel answers with the volume afterwards, the molar volume Vm = R T / P, the volume ratio and the mass of the gas — and choosing helium, air or carbon dioxide moves the mass and the density while every volume reading stands still.
| Control | Range | Step |
|---|---|---|
| Amount before | 0.10 to 5.00 mol | 0.01 mol |
| Amount after | 0.10 to 5.00 mol | 0.01 mol |
| Pressure | 20 to 500 kPa | 0.025 kPa |
| Temperature | -100 to 500 °C | 1 °C |
| The gas | helium, air or carbon dioxide | three buttons |
How to use the Avogadro's law simulator
- Load a case, or start from Reset. The five buttons under Load a case — One mole at 1 atm, Blowing up a balloon, A breath at body heat, The same gas in a furnace and Letting gas out of a gas holder — write all four sliders together and print a name such as “Letting gas out of a gas holder” on the case line. Move any slider and that line reverts to “custom setting”. Reset returns to 1.00 mol, 2.00 mol, 100 kPa, 0 °C and air.
- Set the two amounts. Amount before and Amount after each run from 0.10 to 5.00 mol in steps of 0.01, reading back as “1.00 mol” and “2.00 mol”. They are the only controls that move Volume ratio, Gas added and Molecules after, and they redraw both gas columns and both marked points on the plot.
- Choose the pressure the pistons work against. Pressure covers 20 to 500 kPa in steps of 0.025, which is fine enough to land exactly on 101.325 kPa as well as 100 kPa. Raising it squeezes Molar volume and both volume readings without touching the ratio. Holding the amount still and squeezing instead is a different law, the one the Boyle's law simulator draws as a pressure-against-volume curve.
- Choose the temperature. Temperature runs from -100 to 500 °C in whole degrees, and the Temperature stat converts it for you, reading “273.15 K” at 0 °C. Warming the gas raises the molar volume without moving the ratio; that effect on its own, at a fixed amount of gas, is what the Charles's law simulator plots against temperature in kelvin.
- Press a different gas. Helium, Air and Carbon dioxide change Molar mass, Gas density, Mass of the gas, the sentence naming the other two gases and the colour of the dots. They change no volume, no ratio, no column height and no dot count — which is the whole experiment on this page.
- Read the three sentence lines under the canvas. Why restates the current setting in words, The other two gases weighs the same amount of the two gases you did not pick, and What to notice changes as you cross the landmarks — equal amounts, a cold carbon-dioxide setting, a few hundred kPa, or -50 °C and below. Pause stops the jiggling without moving a single number.
Worked example: change one thing at a time
Every row below starts from the state the lab boots in — 1.00 mol becoming 2.00 mol of air, at 100 kPa and 0 °C — and changes exactly one thing about it. Each cell is a string the running lab printed at those control positions; where a cell and the lab disagree, the lab is right.
| Change from the start | Amounts | Pressure and temperature | Molar volume | Volume before | Volume after | Volume ratio | Mass of the gas |
|---|---|---|---|---|---|---|---|
| Start: the state Reset leaves | 1.00 mol to 2.00 mol | 100 kPa · 0 °C | 22.711 L/mol | 22.71 L | 45.42 L | 2.000 | 57.92 g |
| Press Helium | 1.00 mol to 2.00 mol | 100 kPa · 0 °C | 22.711 L/mol | 22.71 L | 45.42 L | 2.000 | 8.006 g |
| Press Carbon dioxide | 1.00 mol to 2.00 mol | 100 kPa · 0 °C | 22.711 L/mol | 22.71 L | 45.42 L | 2.000 | 88.02 g |
| Back to Air, pressure up to 500 kPa | 1.00 mol to 2.00 mol | 500 kPa · 0 °C | 4.542 L/mol | 4.542 L | 9.084 L | 2.000 | 57.92 g |
| Heat that to 500 degrees Celsius | 1.00 mol to 2.00 mol | 500 kPa · 500 °C | 12.857 L/mol | 12.86 L | 25.71 L | 2.000 | 57.92 g |
Rows 2 and 3 are the reason this lab exists. Swapping air for helium and then for carbon dioxide leaves six of the seven columns byte for byte where they were, and moves only the mass: “8.006 g”, “57.92 g”, “88.02 g”. Alongside the table, Molar mass steps 4.003, 28.96 and 44.01 g/mol and Gas density steps 0.1763, 1.275 and 1.938 g/L, while Molecules after sits at “1.204e24 molecules” through all three. The dots change colour and not number.
Row 4 separates the molar volume from the law. Five times the pressure cuts Molar volume from “22.711 L/mol” to “4.542 L/mol” and both volumes fall with it, yet Volume ratio does not stir from “2.000”. The straight line on the plot tilts down towards the axis; it does not bend, and it still starts at the origin. That is the difference between the equation of state, which the pressure and temperature control, and Avogadro's law, which they cannot reach.
Row 5 adds heat and gets the same answer. At 500 kPa and 500 °C the molar volume climbs back to “12.857 L/mol” and the volume after reads “25.71 L”, with the ratio still “2.000” to the last digit. If you would rather run that ratio on measurements of your own, the Avogadro's law calculator rearranges the same relation for whichever of the four quantities you are missing and asks for no pressure and no temperature at all. It is the identical arithmetic with the molar volume divided out, not a second opinion.
Formula and symbol reference
The lab works out the molar volume from the pressure and the temperature, multiplies it by each amount for the two volumes, and takes the ratio of the amounts for the number the two cylinders are drawn to. The mass, the density and the molecule count hang off the side of that and never feed back into it. Ranges marked “in this lab” are the controls' own ends and the strings the lab prints there.
| Symbol | Meaning | SI unit | In this lab |
|---|---|---|---|
| n1 | Amount of gas before, in moles — a count of molecules, not a mass | mole, mol | 0.10 to 5.00 mol in steps of 0.01, printed to two decimals; “1.00 mol” after Reset. It moves both volumes, the ratio, the gas added, the left column and the pale ring, and touches nothing about the gas itself. |
| n2 | Amount of gas afterwards, at the same pressure and temperature | mole, mol | The same 0.10 to 5.00 mol grid; “2.00 mol” after Reset. Gas added reads “+1.00 mol added” there, “-2.00 mol removed” in the gas-holder case, and “no gas added or removed” whenever the two sliders match. |
| V1 | Volume before: what the first amount occupies at this pressure and temperature | cubic metre, m3 (shown in L) | Four significant figures in litres, from “0.2879 L” at the cold, compressed corner to “1607 L” at the hot, thin one. “22.71 L” after Reset. |
| V2 | Volume after — the headline card, captioned volume after, at the same pressure and temperature | cubic metre, m3 (shown in L) | The same four-figure format and the same span as the volume before, because the two differ only by which slider feeds them. “45.42 L” after Reset. |
| V2/V1 | Volume ratio, which is also the ratio of the two amounts | none (a pure number) | Three decimals, from “0.020” at 5.00 mol down to 0.10 mol to “50.000” the other way about. It reads “1.000” whenever the two amounts agree, and no pressure or temperature setting moves it at all. |
| Vm | Molar volume: the room one mole takes up here, the same for every gas | cubic metre per mole, m3/mol (shown in L/mol) | Three decimals in litres per mole, from “2.879 L/mol” (500 kPa, -100 °C) to “321.416 L/mol” (20 kPa, 500 °C). “22.711 L/mol” after Reset and “22.414 L/mol” at 1 atm. |
| P | The pressure both pistons work against, and which the lab holds constant | pascal, Pa (set in kPa) | 20 to 500 kPa in steps of 0.025, so 101.325 kPa sits exactly on the grid alongside 100 kPa; “100 kPa” after Reset. The same figure is drawn on the arrow above each piston. |
| T | The temperature both cylinders are held at, set in degrees Celsius and reported in kelvin | kelvin, K (set in °C) | -100 to 500 °C in steps of 1, which is “173.15 K” to “773.15 K” on the Temperature stat; “273.15 K” after Reset. |
| M | Molar mass of the chosen gas — the only thing a gas button really changes | kilogram per mole, kg/mol (shown in g/mol) | Three fixed values: “4.003 g/mol” for helium, “28.96 g/mol” for air and “44.01 g/mol” for carbon dioxide. Air is a mixture, so its figure is a conventional mean rather than the molar mass of one substance. |
| rho | Gas density, which the lab gets from the molar mass divided by the molar volume | kilogram per cubic metre (shown in g/L) | Four significant figures, from “0.01245 g/L” (helium at 20 kPa and 500 °C) to “15.28 g/L” (carbon dioxide at 500 kPa and -100 °C). “1.275 g/L” after Reset. |
| N | Molecules after: the second amount turned into a count | none (a count) | A mantissa to three decimals and an exponent, from “6.022e22 molecules” at 0.10 mol to “3.011e24 molecules” at 5.00 mol. “1.204e24 molecules” after Reset, and no gas button moves it. |
| R | Molar gas constant, printed on the constants line under the canvas | joule per mole kelvin, J/(mol·K) | Fixed at 8.314462618 J/(mol·K). It is exact in the SI, because it is the Avogadro constant multiplied by the Boltzmann constant, both of which are themselves fixed numbers. |
| NA | Avogadro's number, on the same constants line | per mole | Fixed at 6.02214076e23 per mole, a defined value ever since the SI redefinition of the mole. The lab uses it for one reading only, Molecules after; no volume, ratio or mass on the page goes anywhere near it. |
Two of the figures above are worth a second look when you meet them on screen. The 22.711 L/mol the lab opens on belongs to 100 kPa, and the 22.414 L/mol the One mole at 1 atm button produces belongs to 101.325 kPa; neither is the molar volume, and the standards they come from are taken apart in the full guide to Avogadro's law. Air's 28.96 g/mol is a mean over a mixture, so the mass and density readings for air describe a sample of ordinary air rather than a substance.
The physics: why the volume follows the molecule count
Molecules keep a gas at pressure by hitting the walls, and every molecule hits just as hard as any other of the same speed whatever it is built from. Add more of them behind a piston that can rise and the piston rises until the blows are as thinly spread as they were before. That is why both cylinders here are drawn with a free piston and a pressure arrow on top: take the freedom away and there is no law left to watch.
The two columns share one vertical scale, and the larger of them always fills the same fraction of the box. So the height you see on the right divided by the height on the left is Volume ratio, which is also the ratio of the two amounts — the lab does not have a second scale to hide a discrepancy in. Drag either amount slider and the dots rebuild with it, twelve per mole rounded to a whole number, with a floor of two so the smallest settings still show something.
The plot sharing the canvas with the cylinders puts volume against amount of gas from zero to 5.00 mol, and what it draws is a straight line climbing from the origin at a slope equal to the molar volume, labelled in the plot as the same line for every gas. The pale ring sits on the before point and the gold ring on the after point, with dotted guides down to both axes. Move the pressure or the temperature and the line pivots about the origin, because Vm = R T / P is the only thing changing.
That expression is the ideal-gas equation with the amount divided out, which is why this lab needs the two quantities the ratio does not. The guide to the ideal gas law sets out where it comes from, and the ideal gas law calculator solves it for any one of pressure, volume, amount and temperature when you need a number rather than a picture. Here the lab prints the molar volume to three decimals and the two volumes to four significant figures.
Molecules after is the second amount multiplied by Avogadro's number, so “1.204e24 molecules” at 2.00 mol is exact arithmetic on a defined constant rather than anything measured. Gas density comes from the other side of the same molar volume, as the molar mass divided by it: helium reads “0.1763 g/L” against air's “1.275 g/L” on the opening setting, which is the whole of why a helium balloon rises. Working a density out from conditions of your own is what the gas density calculator is for.
Where Avogadro's law breaks down
The lab solves its own model exactly, so nothing on screen ever fails. Every limit below is a limit of that model, of the apparatus it stands for, or of the drawing, and each item says what the lab does about it.
- A vessel whose walls will not move
- Every container in this lab can grow: both pistons ride free, the arrow above each carries the same pressure, and all five case buttons describe a piston, a balloon skin, a chest or the roof of a holder. That is deliberate, because the mistake made most often with this law is to apply it to a sealed steel bottle, where the walls settle the volume and the gauge climbs instead. Nothing on these sliders can describe that; what covers it is the full equation of state with the volume fixed.
- A few hundred kilopascals and upwards
- Take Pressure to 300 kPa or beyond and What to notice changes to say that the straight line is close but no longer exact, because real molecules take up room and pull on one another. The lab keeps drawing a perfectly straight line through the origin, since that is what an ideal gas does. No percentage is given for the departure, here or anywhere on this page, because nothing in this build computed one.
- Cold, and the approach to condensation
- At -50 °C and below the same line reports that cold and dense is where real gases stray furthest, and that near their boiling points they leave the straight line altogether by condensing. Only one of these warnings shows at a time, and they rank: equal amounts first, then carbon dioxide freezing, then pressure, then cold — so -60 °C at 400 kPa prints the pressure line, not this one. The readings carry on regardless: at -100 °C the molar volume prints “14.396 L/mol” and both volumes follow it down. Treat everything at that end as the volume an ideal gas would occupy, not a prediction about a real one.
- Carbon dioxide at the cold end of the slider
- Choose Carbon dioxide and set -78 °C or colder and the lab names the problem outright: carbon dioxide turns solid near -78 °C at ordinary pressures, so a real sample would have frozen out before the piston moved. The boundary is exact rather than approximate — -77 °C does not trigger it — and helium at the same -100 °C gets the general cold warning instead, because it has no such transition anywhere near there.
- Gas that leaks away, dissolves or is used up
- The amount you set with Amount after is the amount still present as gas. Helium creeping out through a balloon skin, a gas going into solution in the liquid beneath it, or one eaten by a reaction all shift that figure with nobody touching a valve, and the lab cannot represent any of them. Gas added reports the difference between the two sliders and says nothing about how the gas got in or out.
- The dots are a drawing rule, not a molecule count
- Twelve dots per mole, rounded, is a rule chosen so the two columns look honest beside each other: 12 dots before and 24 after on the opening setting. The real count is the one in Molecules after, and the gap between the two is a factor of about 5e22. Because the rule is the same for every gas, the dots also make the headline invariant visible — they change colour when you change gas and they never change number.
- What the drawing leaves out when there is no room
- Every string on the canvas is measured before it is drawn, then shortened or dropped rather than overprinted. What survives depends on the width of its band, not the width of your screen. As a band narrows the caption under the plot sheds its clause first, “a straight line through the origin: double the moles, double the volume” becoming “double the moles, double the volume”, and the one under the cylinders follows, “same pressure, same temperature: 1.00 mol and 2.00 mol” becoming “1.00 mol and 2.00 mol”. Narrower still, in an article column, the chart caption goes altogether, and the in-plot label shortens to “the same for every gas”.
- The lab's own arithmetic and display
- Three decimals on the molar volume, four significant figures on the volumes, the masses and the density, three decimals on the ratio, two on the amounts. A number that looks exact on the panel has usually been rounded to get there, so a factor worked out by dividing two printed readings is not the factor the physics gives. Take the ratio from Volume ratio, which the lab computes from the amounts themselves.
Where Avogadro's law is actually used
- Collecting gas in a syringe or a burette
- Reading a graduated barrel means reading a volume, and in a laboratory held at one pressure and temperature that reading stands in for an amount of substance. The lab makes the substitution visible: the two cylinders are exactly the same apparatus twice over, and the only thing separating their readings is how much gas is inside. Collect twice as much and the plunger travels twice as far, which is the straight line on the plot with its two rings.
- Breathing, and how much air a chest moves
- Press A breath at body heat: 0.10 mol at 1 atm and 37 °C occupies 2.545 L, and doubling it to 0.20 mol takes 5.090 L. Those are the conditions a lungful is measured at, and the reason a respiratory volume has to be quoted with a pressure and a temperature beside it — the same 0.20 mol at 0 °C and 100 kPa would fill rather less.
- Metering gas, and correcting it to a standard
- What a meter counts is the volume that went past it under whatever conditions the pipe was in, while the bill has to be written in a standard volume. The two figures the lab prints for one mole, “22.711 L/mol” at 100 kPa and “22.414 L/mol” at 101.325 kPa, are exactly the sort of gap that step has to close. Press One mole at 1 atm and then One mole at IUPAC STP to see it happen with nothing else moving.
- Why a helium balloon rises
- A balloon and the air it shoved aside share a pressure, a temperature and a volume, so by this law they hold equal numbers of molecules; what differs is what those molecules weigh. On the opening setting the lab reads “0.1763 g/L” for helium against “1.275 g/L” for air, and the lift is that difference multiplied by the volume. It is gross lift, with the skin, the string and anything being carried still to come off it.
- Flue gas, ducts and chimneys
- Press The same gas in a furnace and one mole needs “64.283 L/mol” at 500 °C instead of the “22.711 L/mol” it takes at 0 °C, which is why hot gas needs such generous ducting. That factor of about 2.83 between the two printed molar volumes is Charles's law, though, not this one: Avogadro's law is the part that stayed at “2.000” while the temperature moved.
- Reading a balanced equation off two volumes
- Where gases are measured at one pressure and temperature, a ratio of volumes is already a ratio of moles, so the coefficients of a reaction can be settled without weighing anything. Air is a mixture, and the law treats it no differently from a pure gas, which is what makes the Air button as legitimate a choice here as either of the other two. The ideal gas law simulator is the place to go when the pressure and the temperature will not sit still between the two measurements.
Where to go next
The full account — the definition, why the textbook says 22.4 L while this tool says 22.711, the difference between the law and the number, and seven worked problems — is in Avogadro's Law (V1/n1 = V2/n2). For your own numbers rather than the sliders', the Avogadro's law calculator solves the ratio in four directions and shows its working, and the ideal gas law is the equation all of these fold back into.
Next door, Boyle's law holds the amount of gas still and squeezes it, while Charles's law holds it still and heats it; their labs, the Boyle's law simulator and the Charles's law simulator, each move one quantity at a time as this one does. The gas density calculator takes the density side further, and the rest are in the library of physics simulations.
Frequently asked questions
Why does nothing about the volume change when I press a different gas button?
Because the volume counts molecules and takes no notice of what they weigh. On the opening setting, Helium, Air and Carbon dioxide all leave Molar volume at 22.711 L/mol, Volume before at 22.71 L, Volume after at 45.42 L and Volume ratio at 2.000, with 1.204e24 molecules either way. What does move is Mass of the gas, from 8.006 g to 57.92 g to 88.02 g, along with Molar mass, Gas density and the colour of the dots.
Why does the pressure slider move the molar volume but never the volume ratio?
Because the pressure sets how much room one mole needs, and the ratio divides that away again. Take the pressure to 500 kPa on the opening setting and Molar volume falls from 22.711 to 4.542 L/mol, Volume after from 45.42 L to 9.084 L, while Volume ratio holds at 2.000. Heat that to 500 degrees Celsius and the molar volume climbs to 12.857 L/mol, with the ratio still 2.000.
Can the lab be set to exactly one atmosphere?
Yes. The pressure slider steps in 0.025 kPa, which puts both 100 kPa and 101.325 kPa exactly on its grid, so Pressure reads 101.325 kPa with nothing rounded. The One mole at 1 atm case button goes straight there and Molar volume then prints 22.414 L/mol against the 22.711 L/mol it shows at 100 kPa. Both belong to 0 degrees Celsius; the pressure is the only thing that differs.
What is the difference between Avogadro's law and Avogadro's number here?
The constants line under the canvas prints both, because they are different things. The law is what the two cylinders show: at one pressure and temperature the volume follows the amount of gas. The number, 6.02214076e23 per mole, is fixed by definition rather than measured, and the lab puts it to work in one place only, turning the amount you set into the Molecules after reading. No volume on the page depends on it.
Why does the case line say custom setting after I move a slider?
Because a named case is one exact setting of all four sliders, so touching any of them means you have left it. The line under the case buttons reads a name such as Letting gas out of a gas holder only while the sliders are exactly where that button put them. Move the amount, the pressure or the temperature and it reverts to custom setting, as it also does at first load and after Reset.
Why does the What to notice line warn me about carbon dioxide in the cold?
Because the lab keeps printing ideal-gas volumes at settings where a real sample would not be a gas at all. Choose Carbon dioxide and take the temperature to -78 degrees Celsius or below and that line says carbon dioxide turns solid near -78 degrees Celsius at ordinary pressures. Warm it to -77 and that warning gives way to the general cold one, because the branch is pinned at exactly -78 rather than somewhere near it.
Why is the volume ratio printed as 0.333 rather than 0.3333?
Because Volume ratio is fixed at three decimal places, whatever the numbers behind it are. The gas-holder case, three moles down to one, therefore prints 0.333, and the extreme setting of 5.00 mol down to 0.10 mol prints 0.020. The underlying equality is exact at every setting; three decimals is a display choice, so do not divide two rounded readings and expect the exact factor back.
Does pausing the animation change any of the readings?
No. Nothing the lab reports depends on time, so Pause simply rests the loop and freezes the dots where they are. Every readout, both column heights and both dot counts are identical across a pause, and the sliders, the gas buttons and the case buttons all keep working while it is paused. Press Play and the jiggle resumes without a second loop starting.
References & formula source
- Atkins and de Paula, Physical Chemistry: The Properties of Gases, for the ideal-gas equation of state, the molar volume and the conditions under which a real gas departs from it.
- Halliday, Resnick and Walker, Fundamentals of Physics: The Kinetic Theory of Gases, where the pressure of a gas is derived from molecular collisions and the amount of substance enters as a count.
- Young and Freedman, University Physics: Equations of State, for the constant-pressure form of the gas law and the standard conditions the molar volume is quoted at.
- BIPM, The International System of Units (SI brochure): the definition of the mole and the fixed numerical value of the Avogadro constant, both quoted here as exact.
- Every figure on this page is an output of the lab's ideal-gas model at the control positions named beside it, and none of them is a measurement of a real sample; verify against your own apparatus before use.
- Further reading: Avogadro's law — Wikipedia