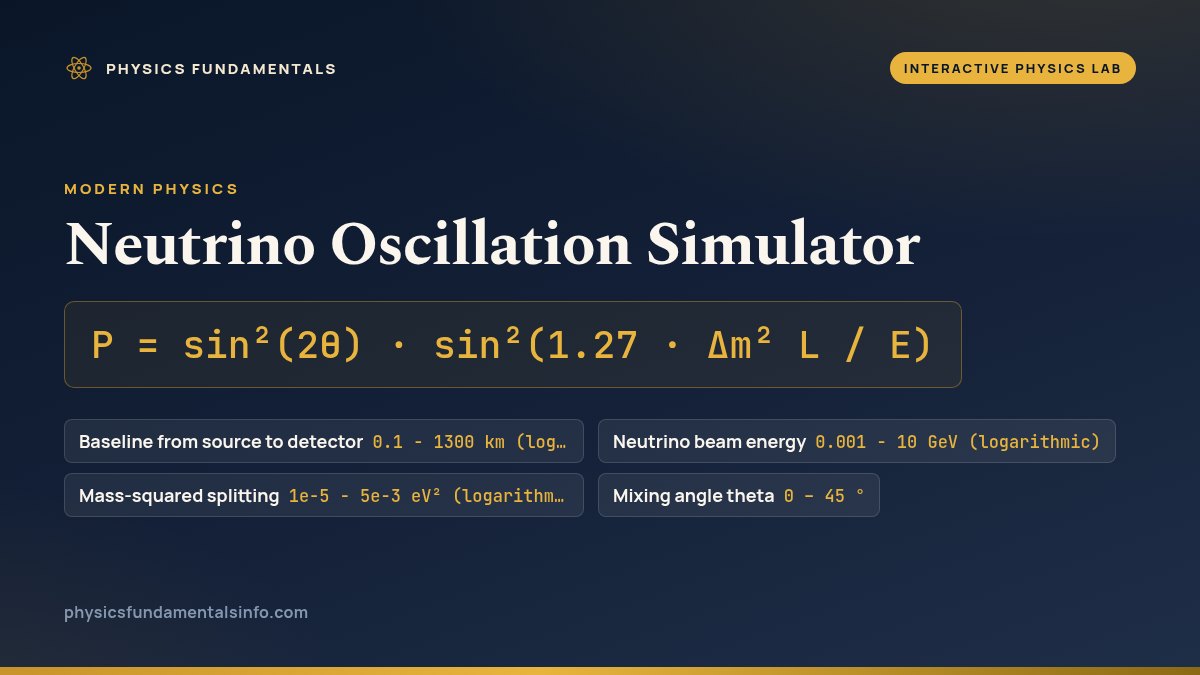
Neutrino oscillation is a beam changing flavour in flight, and how much of it has changed by the time it reaches a detector is fixed by one expression: P = sin²(2θ) · sin²(1.27 · Δm² L / E). Move the baseline, energy, mass splitting and mixing angle sliders below and watch the beam re-mix along its own path while the two probability curves redraw underneath it.
Neutrino Oscillation
A muon-neutrino beam leaves the source pure and arrives as a mixture. Drag the baseline, energy, mass splitting and mixing angle to see flavour drain away and come back: P = sin2(2θ) · sin2(1.27 · Δm2 L / E), with Δm2 in eV2, L in km and E in GeV.
What Is the Neutrino Oscillation Simulator?
The neutrino oscillation simulator is a free interactive physics lab that runs in your browser — nothing to install and no sign-up. Drag baseline, energy, mass splitting and mixing angle and watch flavour change as P = sin2(2t)sin2(1.27 dm2 L/E). It reports survival (stays a muon neutrino), appearance (changed flavour) and first oscillation maximum as you drag the sliders.
| Control | Range | Step |
|---|---|---|
| Baseline from source to detector | 0.1 - 1300 km (logarithmic) | — |
| Neutrino beam energy | 0.001 - 10 GeV (logarithmic) | — |
| Mass-squared splitting | 1e-5 - 5e-3 eV² (logarithmic) | — |
| Mixing angle theta | 0 – 45 ° | 0.01 |
How to use the neutrino oscillation simulator
Start with the two sliders that describe the experiment rather than the physics. Baseline L is how far the detector sits from the source, and beam energy E is what the accelerator or the reactor produces. Both are on logarithmic scales, because real experiments are spread over five decades: a reactor detector sits 1.65 km from a core watching 4 MeV antineutrinos, while DUNE will fire a 2.5 GeV beam 1300 km across the United States. Drag either one and the white detector marker slides along the graph; drag them together in the same direction and it barely moves at all, which is the whole point of plotting against L/E instead of against distance.
The other two sliders describe the neutrinos themselves. Mass splitting is the difference between the squares of two neutrino masses, and it controls the wavelength: raise it and the peaks crowd together, lower it and they stretch out. Mixing angle controls the height and nothing else. Set it to 45 degrees and the amplitude reads 1.0000, meaning a perfectly placed detector can see the beam convert completely; pull it back to 20 degrees and the ceiling drops to 0.4132 while every peak stays exactly where it was. Watching those two behaviours stay independent is the fastest way to internalise which parameter does what.
Three preset buttons load real experiments so you are not guessing at plausible numbers. T2K is 295 km at 0.6 GeV, Reactor is the short-baseline configuration used to measure the small mixing angle, and DUNE is the long-baseline case now under construction. The panel readouts give the survival probability, the appearance probability and the distance to the first oscillation maximum at the current energy — and it is worth pressing T2K and noticing that the first maximum reads 296.8 km when the real baseline is 295 km. That is not a coincidence, and it is not a rounding error either. The site was chosen by solving this expression, using the same argument the guide to what a neutrino is works through in full.
Read the picture in two parts. The band across the top is the beam itself, drawn from the source on the left to the detector on the right, with gold for the fraction still in its original flavour and pale grey for the fraction that has converted. The graph underneath shows what would happen if you kept walking: the same two probabilities against L/E, with a dashed line at the first maximum and a solid white line where your detector actually is. When the oscillations become too rapid to draw honestly, the lab says so on screen and switches to the average rather than painting a pattern that is really an artefact of the pixel grid.
Worked example: change one thing at a time
Press Reset to load the first row, then move a single slider per step. Every figure below is the string the simulator itself printed for those slider positions — the values were read back out of the running lab, not worked out on paper — so if the table and the tool ever disagree, the tool is right.
| Step | Amplitude | Survival | Appearance | First maximum | Ratio L over E |
|---|---|---|---|---|---|
| Reset: T2K, 295 km at 0.6 GeV, 45 degrees | 1.0000 | 0.0001 | 0.9999 | 296.8 km | 491.7 km/GeV |
| Halve the beam energy to 0.3 GeV | 1.0000 | 0.9996 | 0.0004 | 148.4 km | 983.3 km/GeV |
| Back to 0.6 GeV; push the detector out to 810 km | 1.0000 | 0.1709 | 0.8291 | 296.8 km | 1350 km/GeV |
| Back to 295 km; drop the mixing angle to 20 degrees | 0.4132 | 0.5869 | 0.4131 | 296.8 km | 491.7 km/GeV |
| Back to 45 degrees; halve the splitting to 1.25e-3 | 1.0000 | 0.5049 | 0.4951 | 593.7 km | 491.7 km/GeV |
| Reactor preset: 1.65 km at 4 MeV, amplitude 0.085 | 0.0850 | 0.9207 | 0.0793 | 1.979 km | 412.5 km/GeV |
Rows one and two are the misconception this simulator exists to correct. The detector has not moved: it is still 295 km away in both. All that changed is the beam energy, and the reading collapses from 0.9999 to 0.0004 — from a beam that has converted almost completely to one that has barely started. Anyone who thinks of a baseline as fixing an answer will find that hard to accept until they watch the first-maximum readout slide from 296.8 km to 148.4 km at the same time. Halving the energy halved the oscillation length, so at 295 km the beam has gone through a full oscillation and come all the way back to being what it was.
Row three moves the detector instead, out to 810 km at the original energy, and lands at 0.8291 — past the first peak and on the way down. Rows four and five separate the two remaining parameters cleanly. Dropping the mixing angle to 20 degrees changes the amplitude to 0.4132 and the appearance probability to 0.4131, but leaves the first maximum at 296.8 km, exactly where it was. Halving the mass splitting does the opposite: the amplitude stays at 1.0000 while the first maximum doubles to 593.7 km, which drops the reading at a fixed 295 km detector to roughly half. The last row is the reactor configuration, where an amplitude of only 0.085 caps the appearance probability at 0.0793 no matter how carefully the detector is placed.
Formula and symbol reference
| Quantity | What it means | Units | Typical range |
|---|---|---|---|
| P(stays muon) | Survival probability — the share of the beam still the flavour it started as | dimensionless | 0 to 1 |
| P(changed) | Appearance probability — the share that has converted to another flavour | dimensionless | 0 to 1 |
| L | Baseline: source-to-detector distance | km | 1.65 km (reactor) to 1300 km (DUNE) |
| E | Neutrino energy | GeV | 4 MeV (reactor) to 10 GeV (atmospheric) |
| L / E | The ratio that actually sets the phase | km/GeV | 0.01 to about 1.5 million |
| Δm² | Mass-squared splitting between two mass states | eV² | 7.5e-5 (solar) to 2.5e-3 (atmospheric) |
| θ | Mixing angle between flavour and mass states | degrees | about 8.5 (theta-13) to 45 (theta-23) |
| sin²(2θ) | Oscillation amplitude — the ceiling the curve can reach | dimensionless | 0.085 (theta-13) to 1.0 (maximal) |
| 1.27 | Unit conversion for eV², km and GeV used together | GeV / (eV² km) | fixed constant |
The physics: why a beam can forget what it was
A neutrino is produced with a definite flavour because it is produced alongside a definite charged partner. A pion decaying in an accelerator beamline gives up a muon, so what leaves with it is a muon neutrino by definition. What travels, however, is not a flavour. The states with definite mass are three different superpositions of the three flavours, and a muon neutrino is a particular blend of them — a chord rather than a note.
Those mass states then propagate with slightly different phases, because their energies differ very slightly for the same momentum. Over a long enough flight the relative phase between them drifts, the blend is no longer the one that was launched, and projecting it back onto flavour gives a different answer. Nothing has decayed and nothing has been absorbed: the total probability across all flavours is still exactly one, which is why the two curves in the simulator are mirror images and always sum to 1.0000. The beam has not lost anything, it has re-mixed.
The phase difference works out proportional to the difference of the squared masses divided by the energy, which is why the formula contains a mass-squared splitting rather than a mass. That is also the reason oscillation experiments cannot report a neutrino mass at all — only how far apart two of them are. And it is the reason the discovery mattered so much: a splitting can only be non-zero if at least two of the masses differ, so at most one neutrino can be massless, and the original Standard Model said all three were. The same relativistic treatment that produces the phase also demands that the neutrinos be moving at essentially the speed of light, so the Lorentz factor for a beam like T2K's runs into the billions.
Where this clean expression stops being enough
The formula in the lab is the two-flavour approximation. Reality has three flavours, three mixing angles, two independent mass splittings and a CP-violating phase, and the full expression does not factorise into a single sine squared. The two-flavour version is an excellent approximation whenever one splitting dominates the relevant L/E — which is exactly why experiments are designed to sit in that regime — but it cannot show you the effects that only appear when the sub-dominant terms matter, and it treats neutrinos and antineutrinos identically when the whole point of DUNE and Hyper-Kamiokande is to find out whether they differ.
Three more things the clean picture hides. Neutrinos crossing matter pick up an extra potential from forward scattering off electrons, which shifts the effective mixing and can enhance the conversion dramatically; this is what makes solar neutrinos behave differently in the Sun than in vacuum, and it is why long-baseline results have to be corrected for the rock the beam passes through. The sign of the mass splitting drops out of the formula entirely, because it is squared inside a sine, so this expression cannot tell you which mass state is heaviest. And a real beam is not monochromatic: it carries a spread of energies, so a detector sees the probability averaged over that spread, which is precisely why the lab stops drawing individual wiggles once they are packed tighter than it can honestly resolve.
Finally, the expression assumes the mass states stay coherent for the entire flight. Over astrophysical distances the wave packets separate and the interference washes out for good, leaving a flat average that no detector placement can undo. Supernova and solar neutrinos arrive in exactly that state.
Where these numbers are actually used
T2K fires a muon neutrino beam 295 km from the J-PARC accelerator at Tokai to the Super-Kamiokande detector at Kamioka, and the beam is deliberately tuned to about 0.6 GeV so that the baseline lands on the first oscillation maximum. Press the T2K preset and the first-maximum readout gives 296.8 km against a real baseline of 295 km. NOvA runs the same idea at 810 km and about 2 GeV, and DUNE will run it at 1300 km with a wide-band beam, which is why its preset shows the detector sitting past the first peak rather than on it.
Reactor experiments work the opposite end of the scale. Daya Bay, RENO and Double Chooz measured the small mixing angle by putting detectors roughly 1.65 km from reactor cores producing antineutrinos of a few MeV. The reactor preset reproduces that configuration: an amplitude of 0.085 and an appearance probability of 0.0793, a deficit of under 8 percent that took years of careful counting to establish. KamLAND used a 180 km average baseline at similar energies to reach the solar splitting instead. Every one of these numbers came out of the same expression, run at a different L/E, and the fact that a neutrino leaves in the first place is inseparable from beta decay — the process whose missing energy caused Pauli to propose the particle in 1930, and whose energy budget the Beta Decay Energy calculator works out from atomic masses.
Atmospheric neutrinos gave the first convincing evidence of all. Cosmic rays make muon neutrinos in the upper atmosphere, and Super-Kamiokande found fewer arriving from below — having crossed the Earth — than from above. The path lengths differ by four orders of magnitude, from about 15 km to 13,000 km, which sweeps L/E across the whole oscillation pattern with no accelerator required. That measurement, together with the Sudbury Neutrino Observatory's demonstration that solar neutrinos were arriving as other flavours rather than disappearing, won the 2015 Nobel Prize and forced the first confirmed amendment to the Standard Model. The spectrum that started the whole story is the one you can watch build up in the beta decay simulator.
Frequently asked questions
Why does L/E matter more than distance on its own?
Because the phase the beam accumulates is proportional to the ratio, not to either quantity alone. The argument of the sine is 1.27 times delta-m-squared times L divided by E, so doubling the baseline and doubling the energy leave it completely unchanged, and the detector reads exactly what it read before. The simulator makes that concrete in about ten seconds: set the baseline to 295 km at 0.60 GeV and note the appearance probability, then set 590 km at 1.20 GeV and watch it land on the same number. That is why the graph is drawn against L/E rather than against distance, and why an experiment is described by a ratio in km per GeV rather than by how far apart its two ends happen to be.
What does the mixing angle actually change?
It sets how high the oscillation can climb, and nothing else. The angle enters only through sin2(2 theta), which multiplies the whole expression, so it scales the peak of the curve without touching where the peaks fall. Drag the mixing angle slider and you will see the two curves squash toward each other or open out to the full range, while every crossing point stays exactly where it was. At 45 degrees the amplitude is 1.0000 and the beam can convert completely; at 20 degrees it is 0.4132, so even a perfectly placed detector never sees more than about 41 percent of the beam change flavour. The two are genuinely independent knobs, which is why experiments can measure them separately.
Why is the constant 1.27?
It is a unit conversion, not a piece of physics. Written in natural units the oscillation phase is delta-m-squared times L divided by 4E, and turning that into the units people actually quote - electronvolts squared for the mass splitting, kilometres for the baseline and gigaelectronvolts for the energy - leaves a numerical factor of about 1.267. The lab hard codes 1.27 and labels every slider in exactly those units, because the number is only correct for that combination. Feed it a baseline in metres or an energy in MeV without converting and the answer is wrong by orders of magnitude, which is the single most common slip in an exam question on this topic.
What happens if I set the energy very low?
The oscillation gets faster and faster until the picture stops being a curve at all. Energy sits in the denominator, so lowering it raises L/E and packs more complete oscillations into the same baseline. Below a certain point the lab stops drawing a wiggle it cannot honestly resolve and shows the envelope and the average instead, with the number of oscillations printed on screen. That is not the simulator giving up: it is what a real detector sees. A beam with any spread in energy at all smears those rapid oscillations into their average, which is why solar and reactor experiments in that regime quote an averaged survival probability rather than a point on a curve.
Why do real experiments pick one specific baseline?
Because the detector has to sit where the effect is largest, and once the mass splitting is known that position is fixed by the beam energy. Setting the sine argument to a quarter turn gives the first oscillation maximum, and the lab prints the corresponding distance for whatever energy you have dialled in. Take the atmospheric splitting of 2.50e-3 eV squared and a 0.60 GeV beam and the readout says 296.8 km - which is why Japan built T2K with 295 km between Tokai and Kamioka. Reactor experiments run the same calculation at a few MeV and end up roughly 1.65 km from the core. The baseline is not chosen for convenience; it is solved for.
References & formula source
- Particle Data Group — Review of Particle Physics, "Neutrino Masses, Mixing, and Oscillations" (the two-flavour formula and the current global-fit values).
- Nobel Prize in Physics 2015 — Takaaki Kajita and Arthur B. McDonald, for the discovery of neutrino oscillations showing that neutrinos have mass.
- Griffiths — Introduction to Elementary Particles, chapter on neutrino oscillations (derivation of the phase from the relativistic dispersion relation).
- Further reading: Neutrino oscillation — Wikipedia